| Param | Original file | Final file |
|---|---|---|
| Filename | modeM0/AS1G08_082T01_9000001986_13361cztM0_level2.evt | modeM0/AS1G08_082T01_9000001986_13361cztM0_level2_quad_clean.evt |
| Size (bytes) | 420,160,320 | 100,984,320 |
| Size | 400.7 MB | 96.3 MB |
| Events in quadrant A | 3,058,440 | 662,403 |
| Events in quadrant B | 3,083,379 | 687,989 |
| Events in quadrant C | 3,123,557 | 658,302 |
| Events in quadrant D | 3,041,714 | 620,790 |
| Mode M9 | |||
|---|---|---|---|
| Quadrant | BADHDUFLAG | Total packets | Discarded packets |
| A | 0 | 19 | 0 |
| B | 0 | 19 | 0 |
| C | 0 | 19 | 0 |
| D | 0 | 20 | 0 |
| Mode M0 | |||
|---|---|---|---|
| Quadrant | BADHDUFLAG | Total packets | Discarded packets |
| A | 0 | 13075 | 3 |
| B | 0 | 13119 | 2 |
| C | 0 | 13281 | 2 |
| D | 0 | 13183 | 2 |
| Mode SS | |||
|---|---|---|---|
| Quadrant | BADHDUFLAG | Total packets | Discarded packets |
| A | 0 | 124 | 0 |
| B | 0 | 124 | 0 |
| C | 0 | 124 | 0 |
| D | 0 | 124 | 0 |
| Quadrant | Total seconds | Saturated seconds | Saturation percentage |
|---|---|---|---|
| A | 6144 | 26 | 0.423177% |
| B | 6144 | 30 | 0.488281% |
| C | 6144 | 15 | 0.244141% |
| D | 6144 | 13 | 0.211589% |
Noise dominated data is calculated using 1-second bins in cleaned event files. If a bin has >2000 counts, and if more than 50% of those come from <1% of pixels, then it is considered to be noise-dominated and hence unusable.
| Quadrant | # 1 sec bins | Bins with >0 counts | Bins with >2000 counts | High rate bins dominated by noise | Noise dominated (total time) | Noise dominated (detector-on time) | Marked lightcurve |
|---|---|---|---|---|---|---|---|
| A | 7425 | 6146 | 16 | 16 | 0.22% | 0.26% | 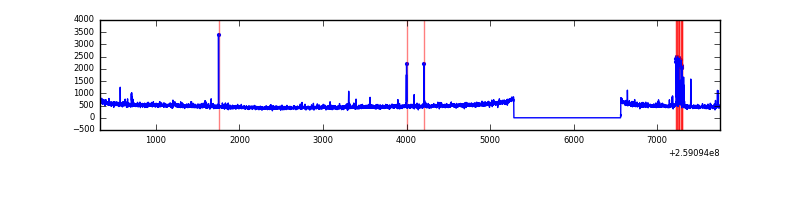 |
| B | 7425 | 6146 | 1 | 1 | 0.01% | 0.02% | 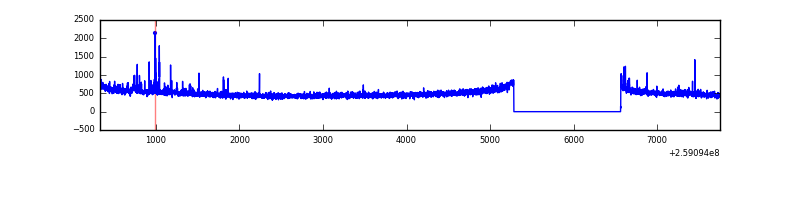 |
| C | 7425 | 6146 | 3 | 3 | 0.04% | 0.05% | 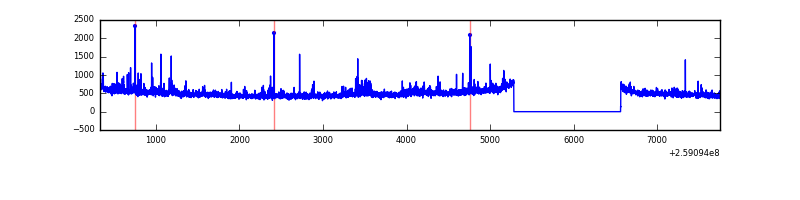 |
| D | 7425 | 6146 | 8 | 8 | 0.11% | 0.13% | 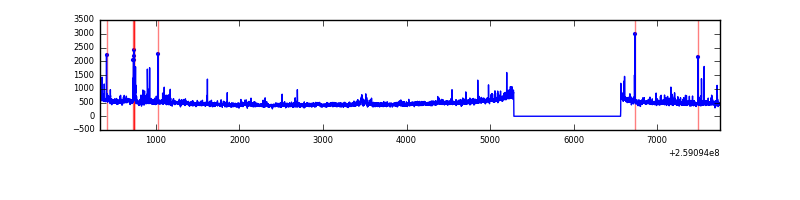 |
Top three noisy pixels from each quadrant. If the there are fewer than three noisy pixels in the level2.evt file, extra rows are filled as -1
| Pixel properties | Quadrant properties | ||||||
|---|---|---|---|---|---|---|---|
| Quadrant | DetID | PixID | Counts | Sigma | Mean | Median | Sigma |
| A | 9 | 143 | 83297 | 545.07 | 757 | 743 | 151.5 |
| A | 1 | 162 | 19630 | 124.7 | 757 | 743 | 151.5 |
| A | 8 | 15 | 11370 | 70.17 | 757 | 743 | 151.5 |
| B | 3 | 64 | 33298 | 225.48 | 769 | 751 | 144.3 |
| B | 3 | 209 | 16854 | 111.56 | 769 | 751 | 144.3 |
| B | 12 | 111 | 16262 | 107.46 | 769 | 751 | 144.3 |
| C | 14 | 220 | 165745 | 973.82 | 737 | 743 | 169.4 |
| C | 3 | 233 | 80458 | 470.47 | 737 | 743 | 169.4 |
| C | 13 | 61 | 5306 | 26.93 | 737 | 743 | 169.4 |
| D | 1 | 52 | 111534 | 643.79 | 722 | 701 | 172.2 |
| D | 8 | 195 | 88668 | 510.97 | 722 | 701 | 172.2 |
| D | 5 | 222 | 46832 | 267.96 | 722 | 701 | 172.2 |
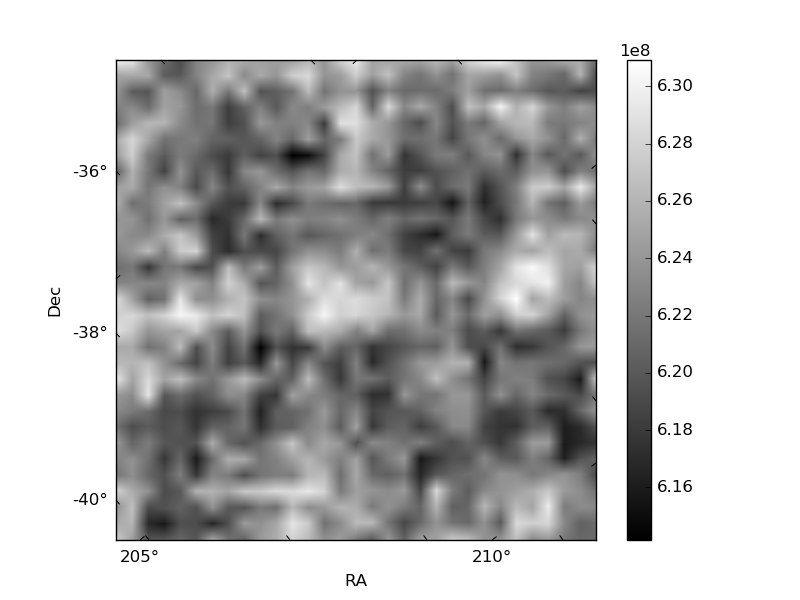
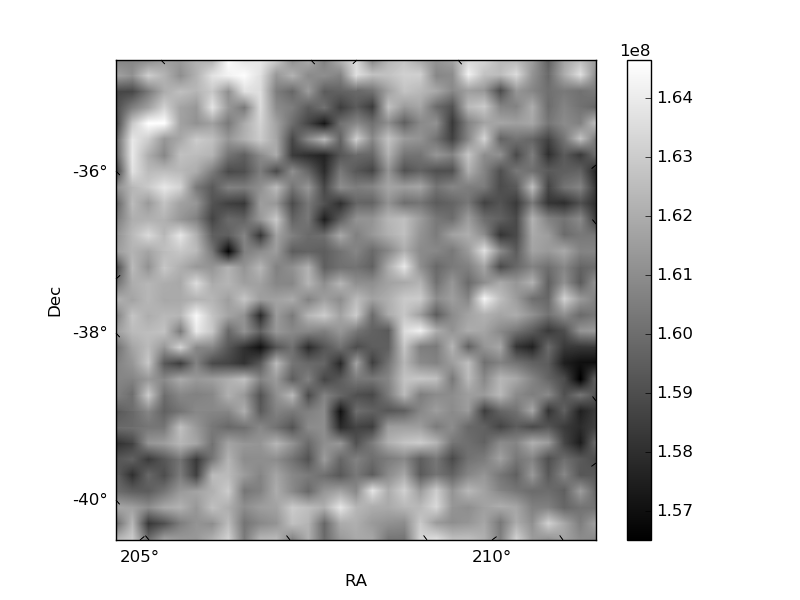
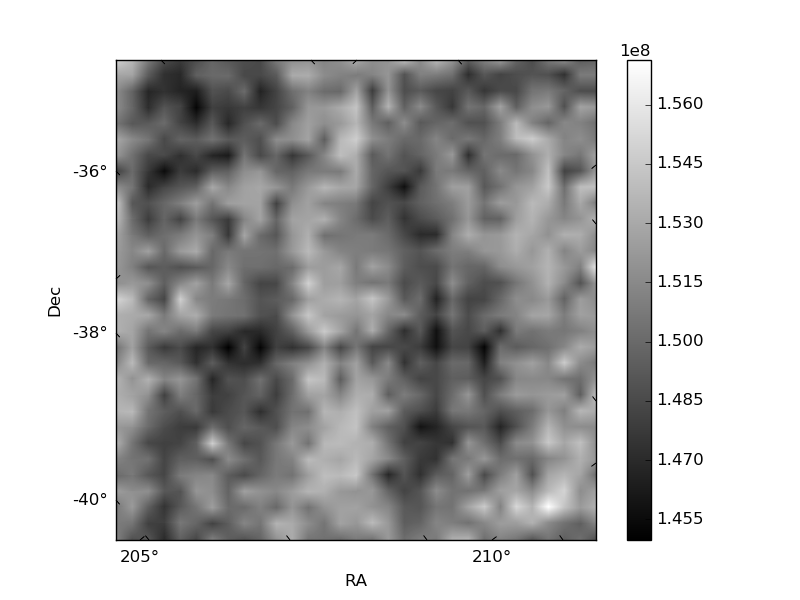
Histogram calculated using DETX and DETY for each event in the final _common_clean file
| Quadrant A | 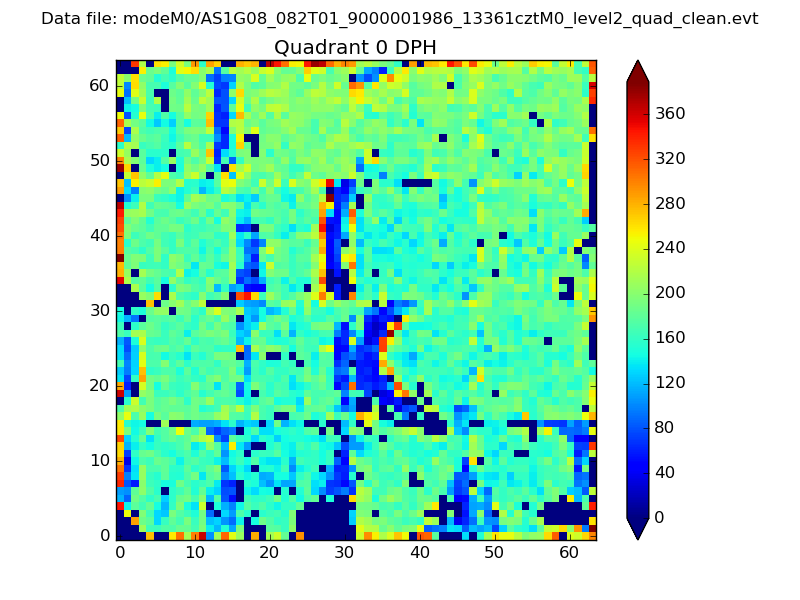 |
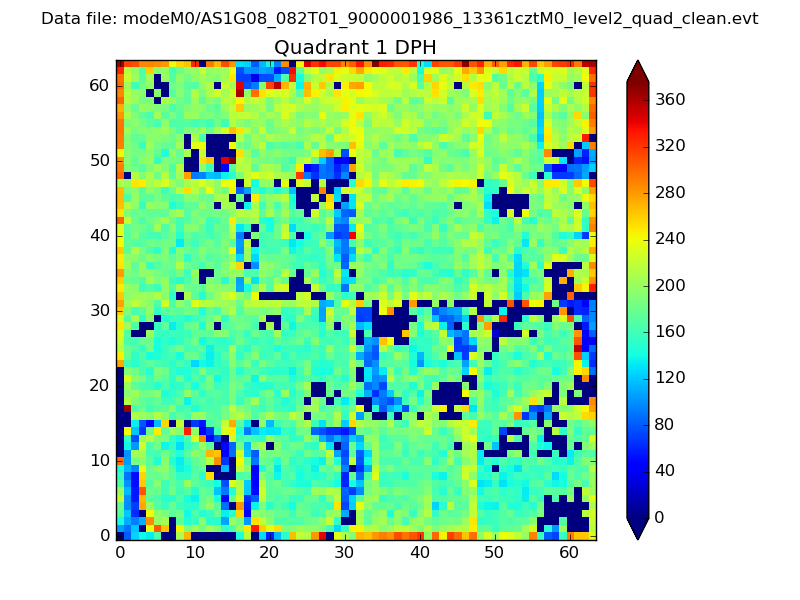 |
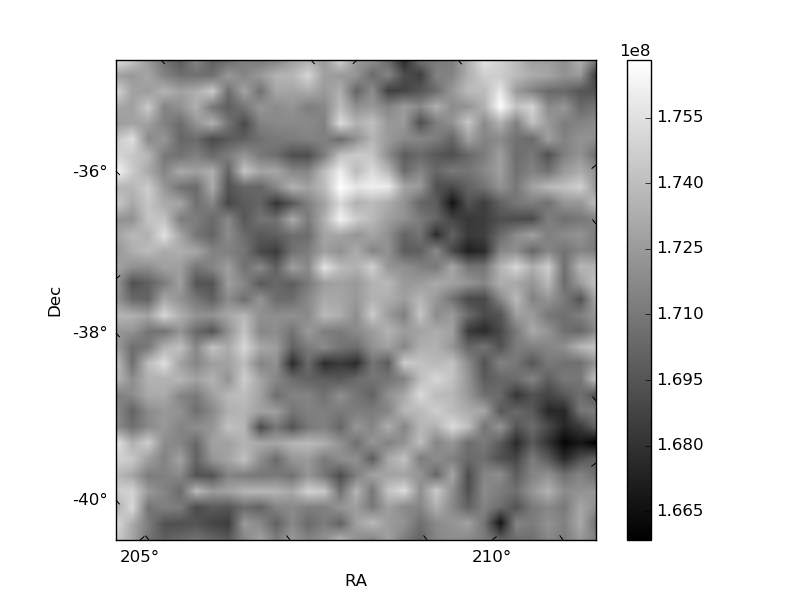
Quadrant B |
|---|---|---|---|
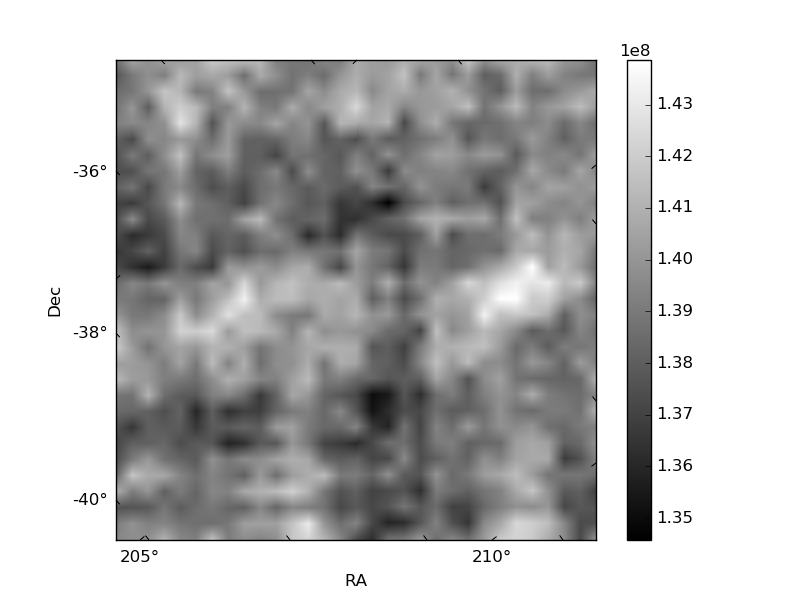
| Quadrant D | 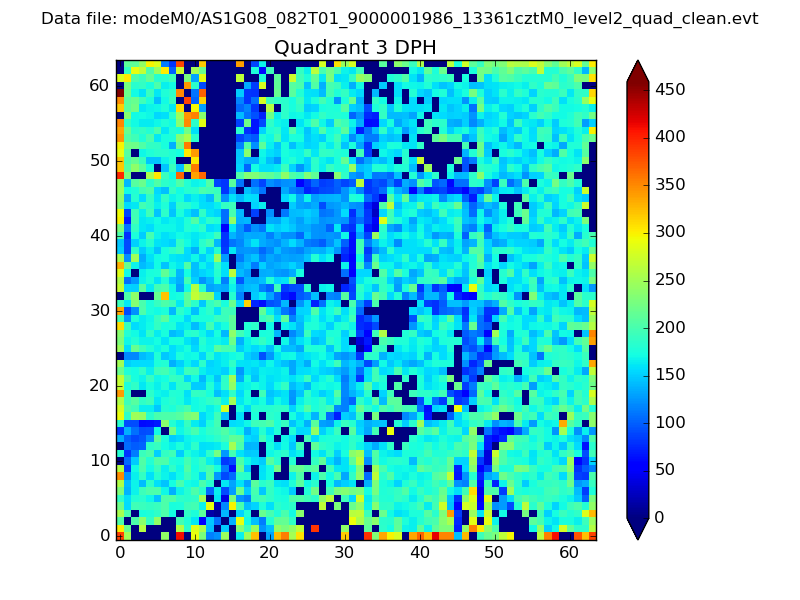 |
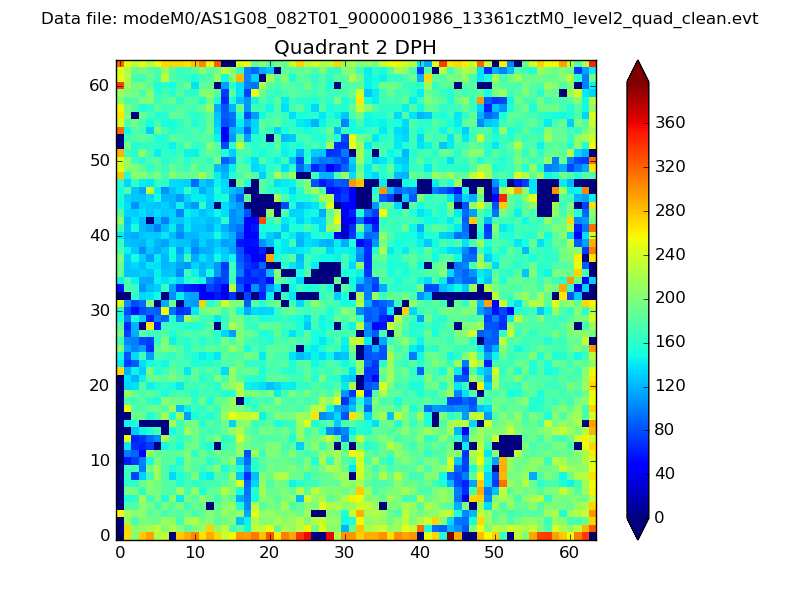 |
Quadrant C |
| Plot type | Count rate plots | Images |
|---|---|---|
| Comparison with Poisson distribution Blue bars denote a histogram of data divided into 1 sec bins. Red curve is a Poisson curve with rate = median count rate of data. |
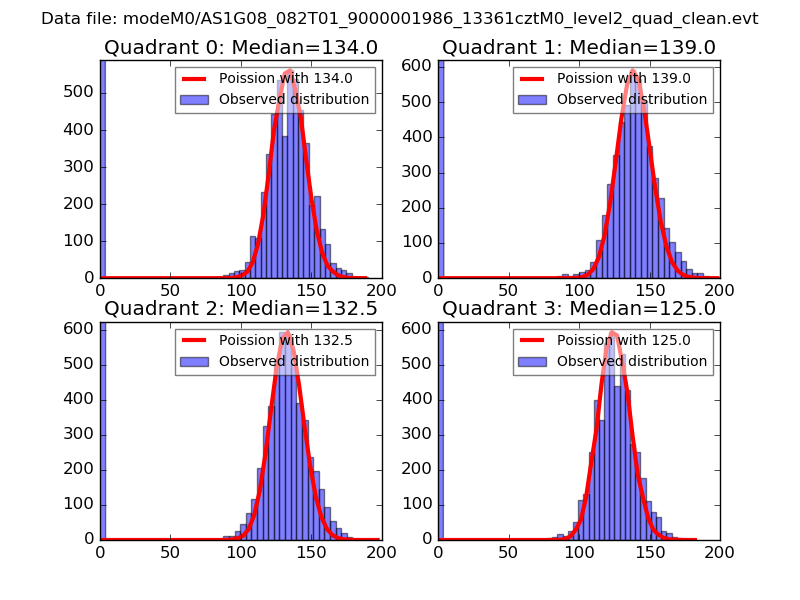 |
 |
| Quadrant-wise count rates Data is divided into 100 sec bins |
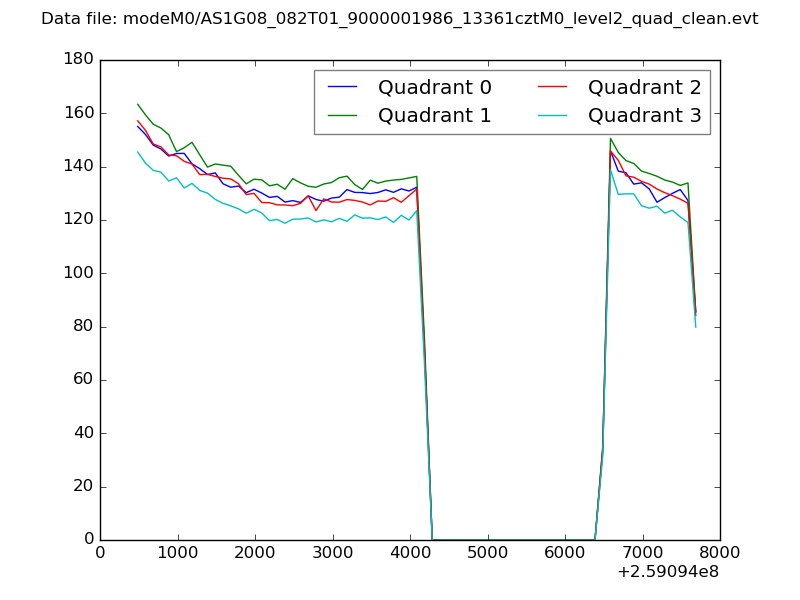 |
|
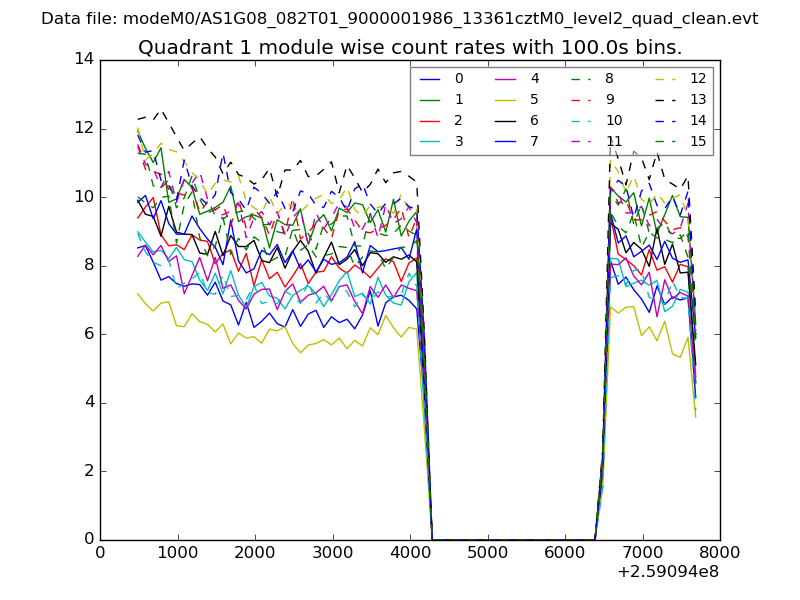
| Module-wise count rates for Quadrant A Data is divided into 100 sec bins |
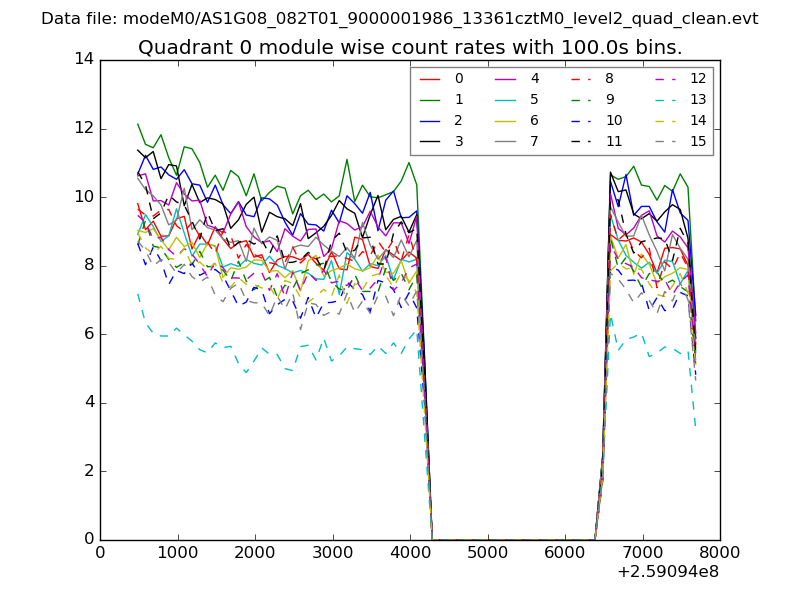 |
 |
| Module-wise count rates for Quadrant B Data is divided into 100 sec bins |
 |
 |
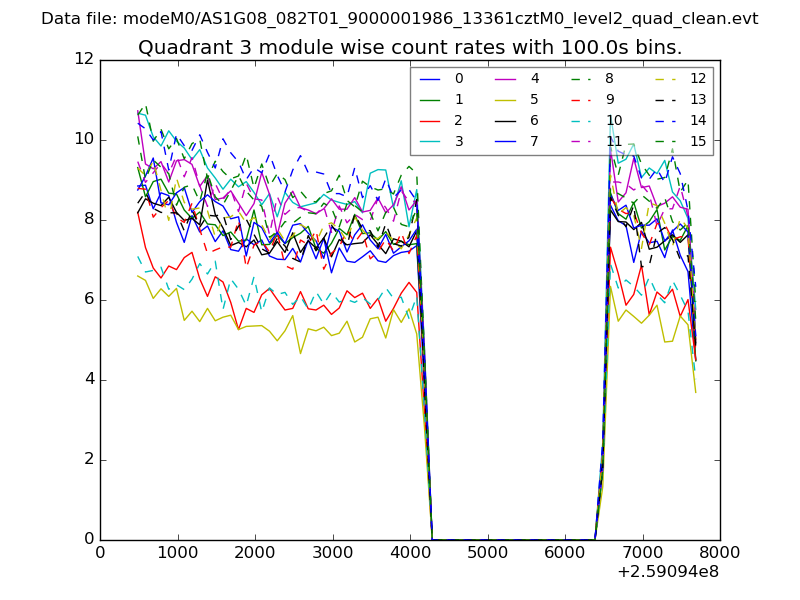
| Module-wise count rates for Quadrant C Data is divided into 100 sec bins |
 |
 |
| Module-wise count rates for Quadrant D Data is divided into 100 sec bins |
 |
 |
| Parameter | Plot |
|---|---|
| CZT HV Monitor |  |
| D_VDD | 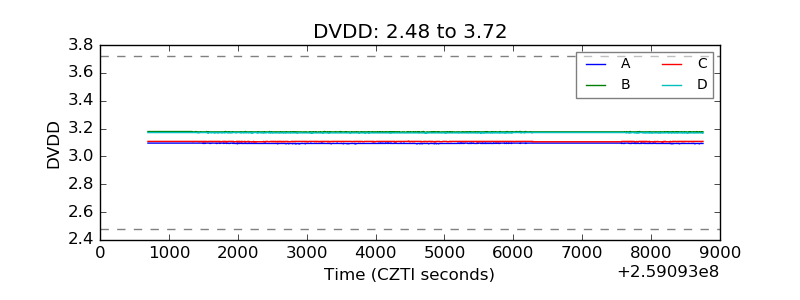 |
| Temperature 1 | 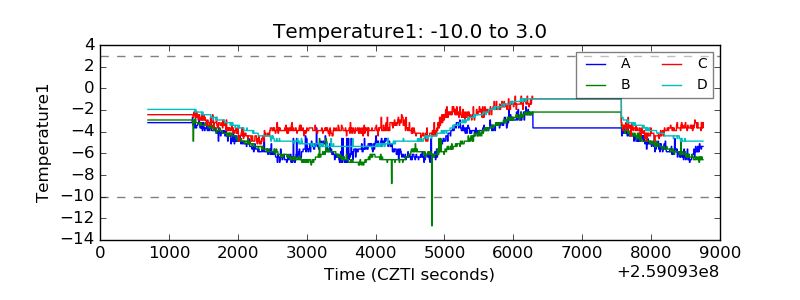 |
| Veto HV Monitor | 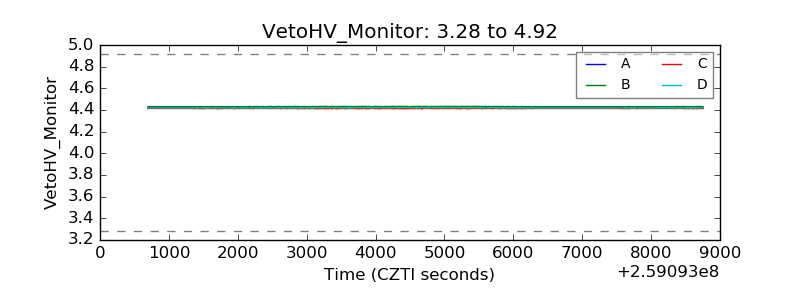 |
| Veto LLD |  |
| Alpha Counter | 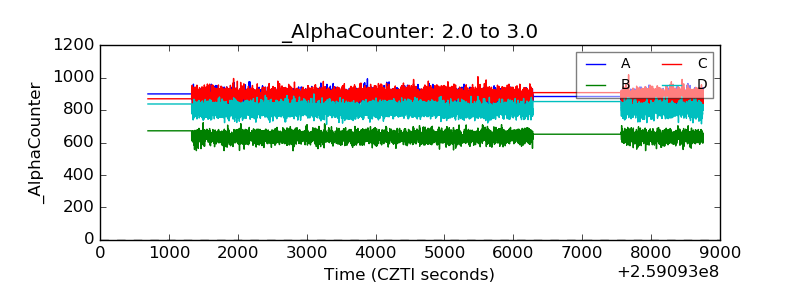 |
| _CPM_Rate | 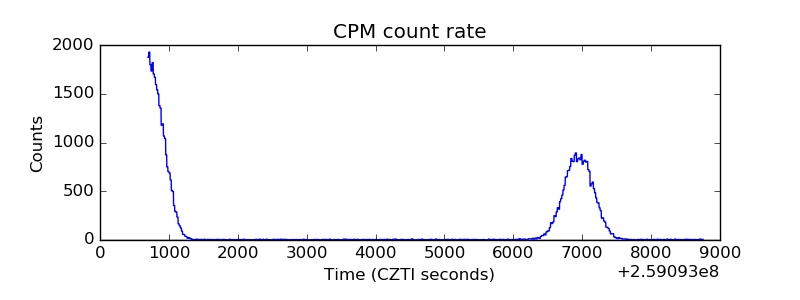 |
| CZT Counter | 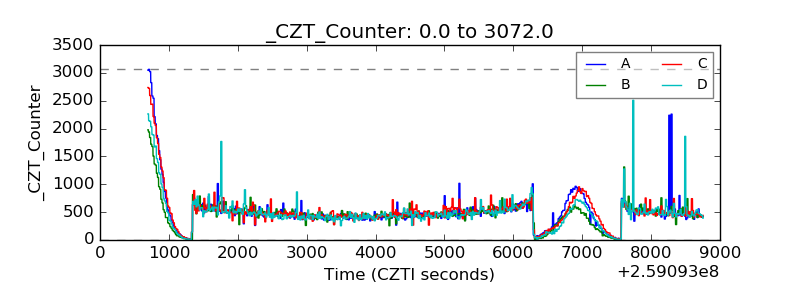 |
| +2.5 Volts monitor |  |
| +5 Volts monitor | 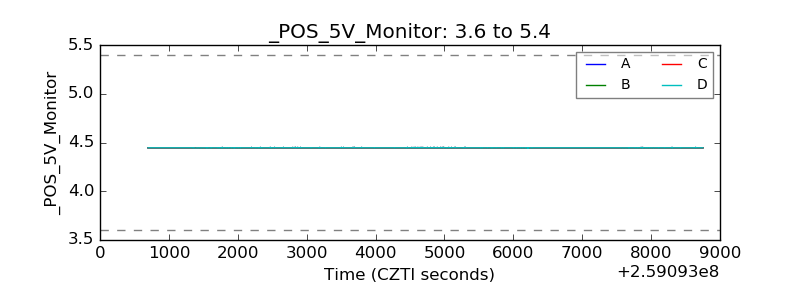 |
| _ROLL_ROT | 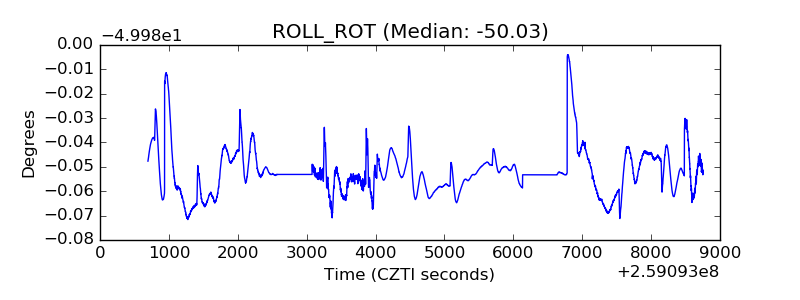 |
| _Roll_DEC | 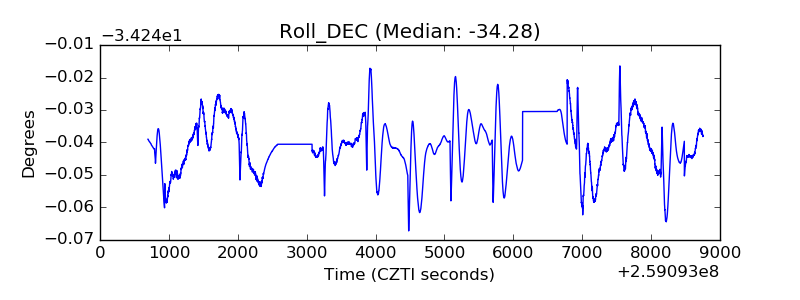 |
| _Roll_RA | 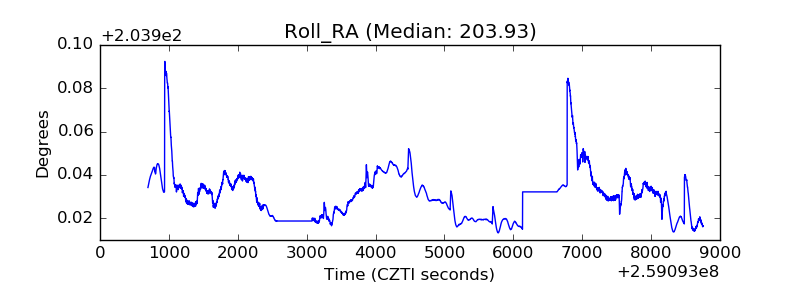 |
| Veto Counter | 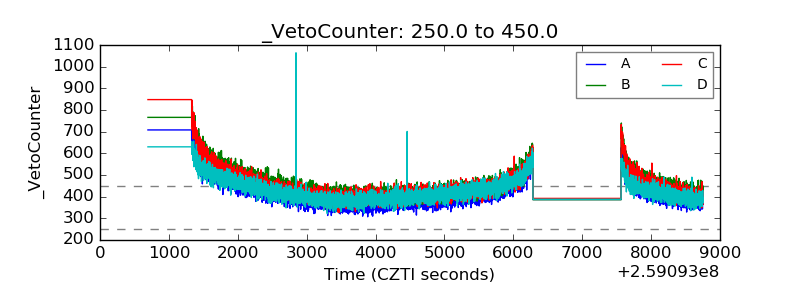 |