| Param | Original file | Final file |
|---|---|---|
| Filename | modeM0/AS1G08_082T01_9000001986_13362cztM0_level2.evt | modeM0/AS1G08_082T01_9000001986_13362cztM0_level2_quad_clean.evt |
| Size (bytes) | 466,171,200 | 100,209,600 |
| Size | 444.6 MB | 95.6 MB |
| Events in quadrant A | 3,284,961 | 644,831 |
| Events in quadrant B | 3,330,036 | 666,081 |
| Events in quadrant C | 3,299,989 | 642,998 |
| Events in quadrant D | 3,737,215 | 603,275 |
| Mode M9 | |||
|---|---|---|---|
| Quadrant | BADHDUFLAG | Total packets | Discarded packets |
| A | 0 | 17 | 0 |
| B | 0 | 17 | 0 |
| C | 0 | 17 | 0 |
| D | 0 | 18 | 0 |
| Mode M0 | |||
|---|---|---|---|
| Quadrant | BADHDUFLAG | Total packets | Discarded packets |
| A | 0 | 14386 | 3 |
| B | 0 | 14425 | 2 |
| C | 0 | 14319 | 2 |
| D | 0 | 15744 | 2 |
| Mode SS | |||
|---|---|---|---|
| Quadrant | BADHDUFLAG | Total packets | Discarded packets |
| A | 0 | 140 | 0 |
| B | 0 | 140 | 0 |
| C | 0 | 140 | 0 |
| D | 0 | 140 | 0 |
| Quadrant | Total seconds | Saturated seconds | Saturation percentage |
|---|---|---|---|
| A | 6852 | 34 | 0.496205% |
| B | 6852 | 42 | 0.612960% |
| C | 6852 | 10 | 0.145943% |
| D | 6852 | 71 | 1.036194% |
Noise dominated data is calculated using 1-second bins in cleaned event files. If a bin has >2000 counts, and if more than 50% of those come from <1% of pixels, then it is considered to be noise-dominated and hence unusable.
| Quadrant | # 1 sec bins | Bins with >0 counts | Bins with >2000 counts | High rate bins dominated by noise | Noise dominated (total time) | Noise dominated (detector-on time) | Marked lightcurve |
|---|---|---|---|---|---|---|---|
| A | 7778 | 6854 | 13 | 13 | 0.17% | 0.19% |  |
| B | 7778 | 6854 | 8 | 8 | 0.10% | 0.12% |  |
| C | 7778 | 6854 | 4 | 4 | 0.05% | 0.06% |  |
| D | 7778 | 6854 | 57 | 57 | 0.73% | 0.83% | 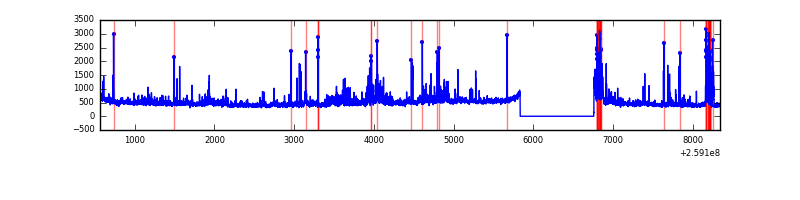 |
Top three noisy pixels from each quadrant. If the there are fewer than three noisy pixels in the level2.evt file, extra rows are filled as -1
| Pixel properties | Quadrant properties | ||||||
|---|---|---|---|---|---|---|---|
| Quadrant | DetID | PixID | Counts | Sigma | Mean | Median | Sigma |
| A | 9 | 143 | 82634 | 495.6 | 819 | 801 | 165.1 |
| A | 8 | 15 | 22108 | 129.04 | 819 | 801 | 165.1 |
| A | 1 | 162 | 13242 | 75.35 | 819 | 801 | 165.1 |
| B | 4 | 142 | 31294 | 193.27 | 828 | 807 | 157.7 |
| B | 15 | 201 | 24108 | 147.72 | 828 | 807 | 157.7 |
| B | 4 | 173 | 21058 | 128.38 | 828 | 807 | 157.7 |
| C | 14 | 220 | 100613 | 539.29 | 800 | 806 | 185.1 |
| C | 3 | 233 | 79218 | 423.69 | 800 | 806 | 185.1 |
| C | 13 | 61 | 5665 | 26.25 | 800 | 806 | 185.1 |
| D | 5 | 222 | 215872 | 1148.66 | 782 | 761 | 187.3 |
| D | 1 | 52 | 143243 | 760.83 | 782 | 761 | 187.3 |
| D | 8 | 195 | 118174 | 626.97 | 782 | 761 | 187.3 |
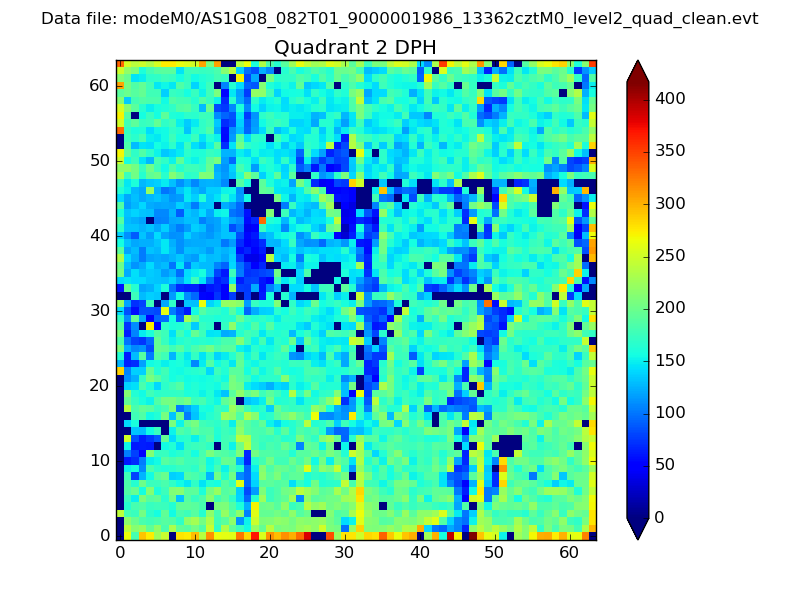
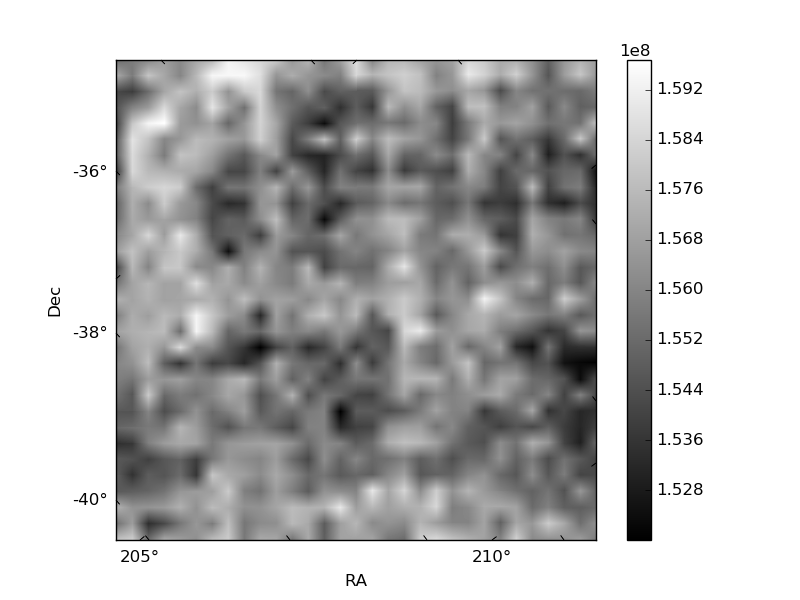
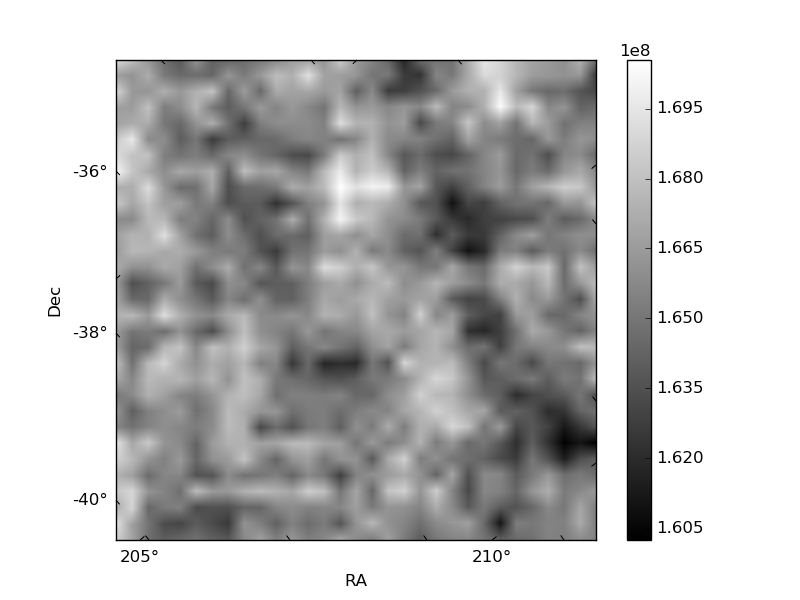
Histogram calculated using DETX and DETY for each event in the final _common_clean file
| Quadrant A |  |
 |
Quadrant B |
|---|---|---|---|
| Quadrant D |  |
 |
Quadrant C |
| Plot type | Count rate plots | Images |
|---|---|---|
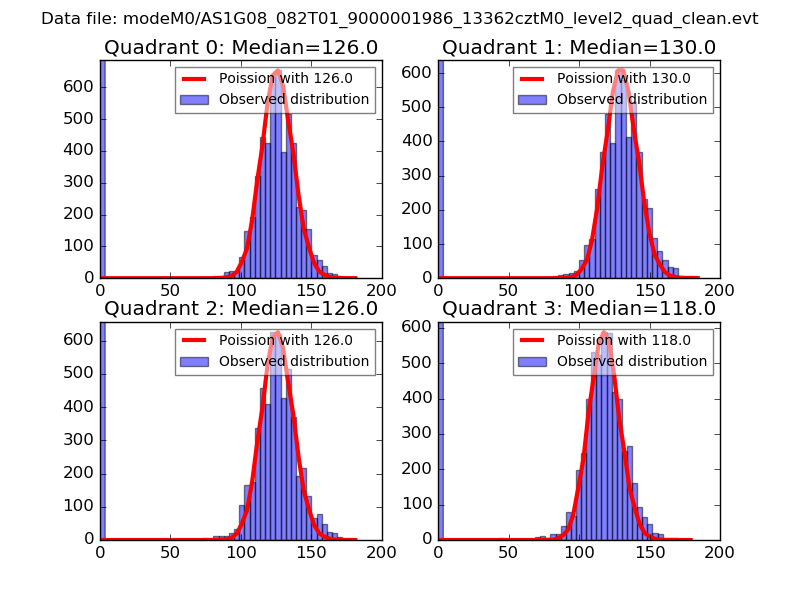
| Comparison with Poisson distribution Blue bars denote a histogram of data divided into 1 sec bins. Red curve is a Poisson curve with rate = median count rate of data. |
 |
 |
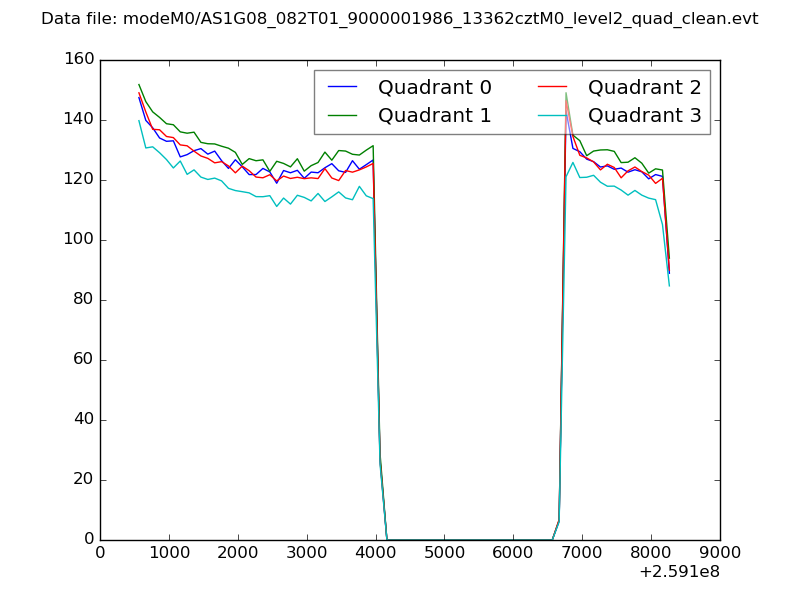
| Quadrant-wise count rates Data is divided into 100 sec bins |
 |
|
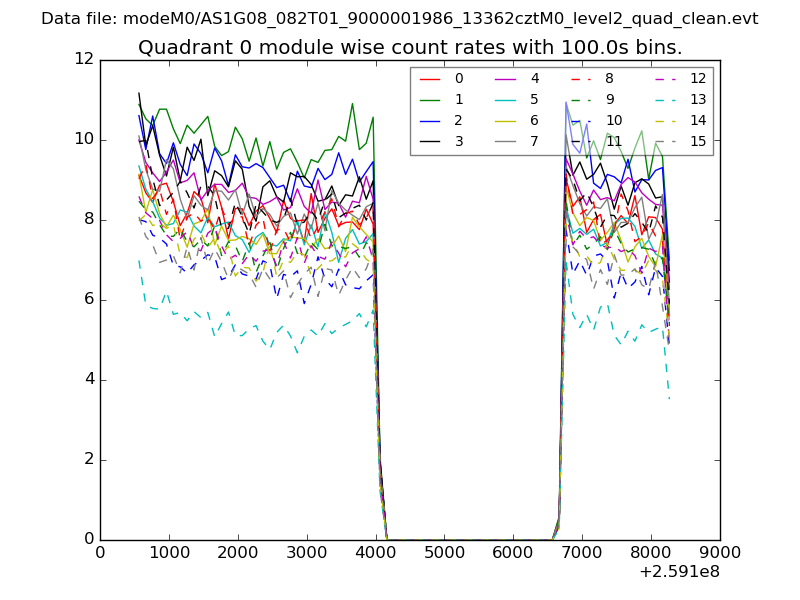
| Module-wise count rates for Quadrant A Data is divided into 100 sec bins |
 |
 |
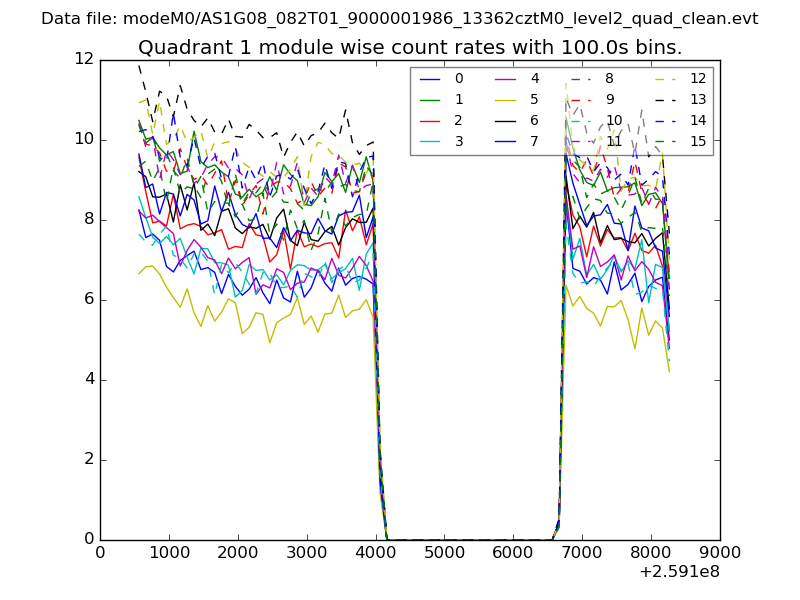
| Module-wise count rates for Quadrant B Data is divided into 100 sec bins |
 |
 |
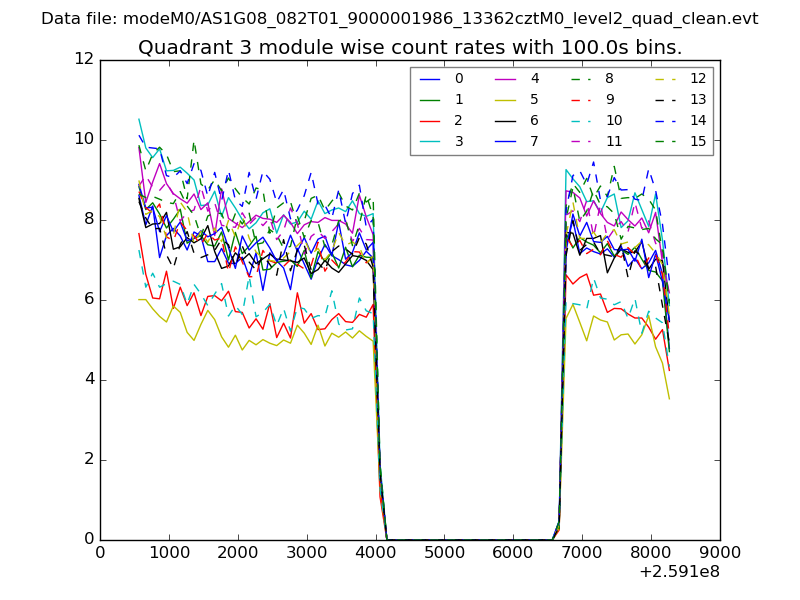
| Module-wise count rates for Quadrant C Data is divided into 100 sec bins |
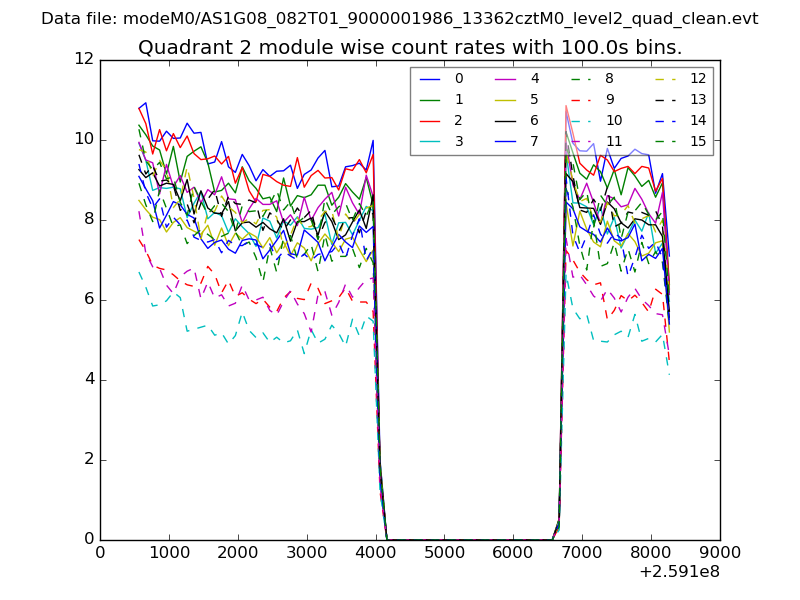 |
 |
| Module-wise count rates for Quadrant D Data is divided into 100 sec bins |
 |
 |
| Parameter | Plot |
|---|---|
| CZT HV Monitor | 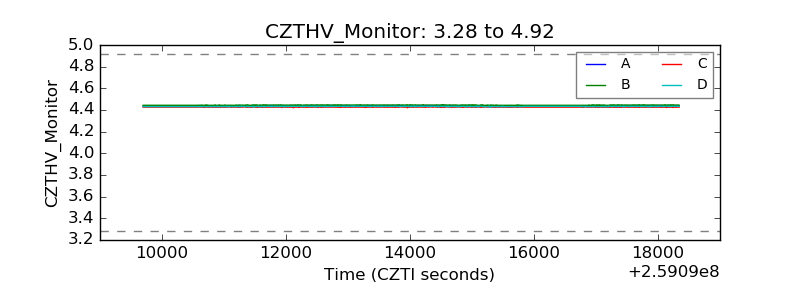 |
| D_VDD | 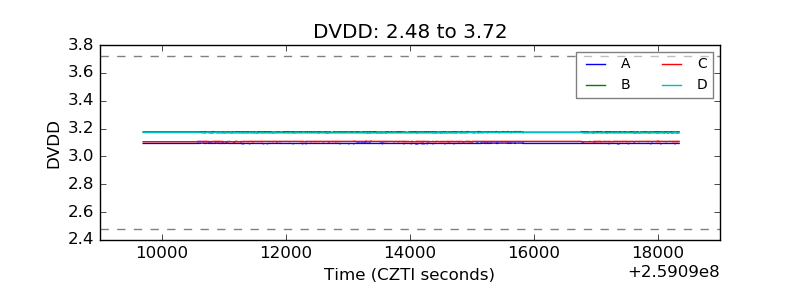 |
| Temperature 1 | 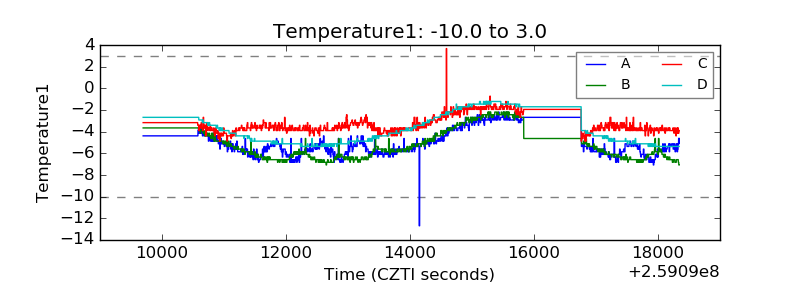 |
| Veto HV Monitor | 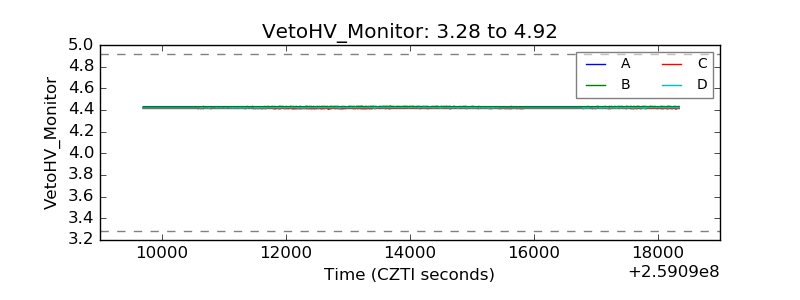 |
| Veto LLD | 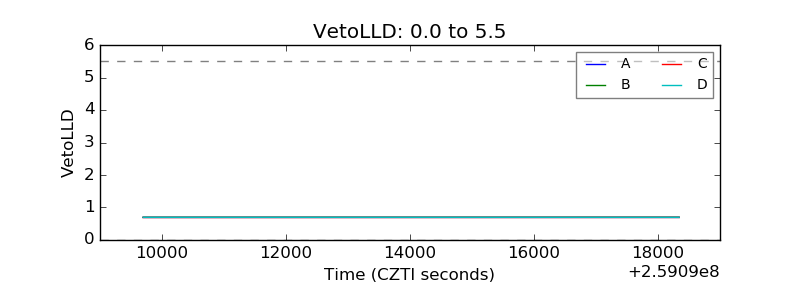 |
| Alpha Counter | 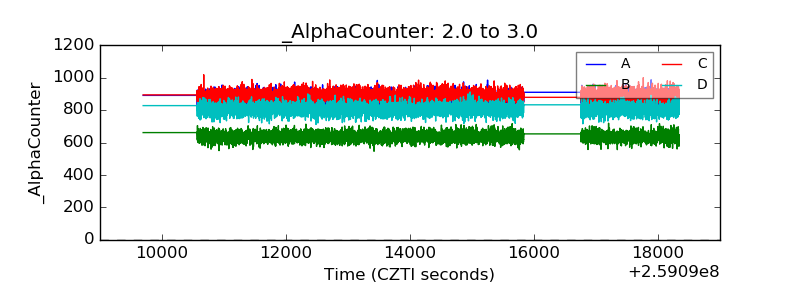 |
| _CPM_Rate | 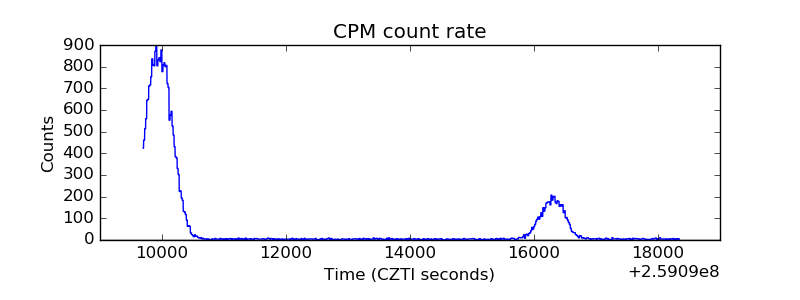 |
| CZT Counter | 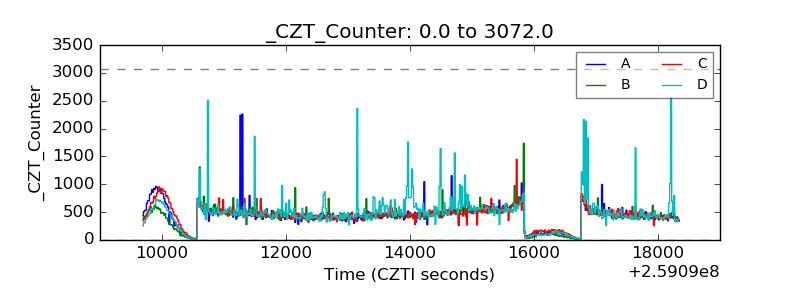 |
| +2.5 Volts monitor |  |
| +5 Volts monitor |  |
| _ROLL_ROT | 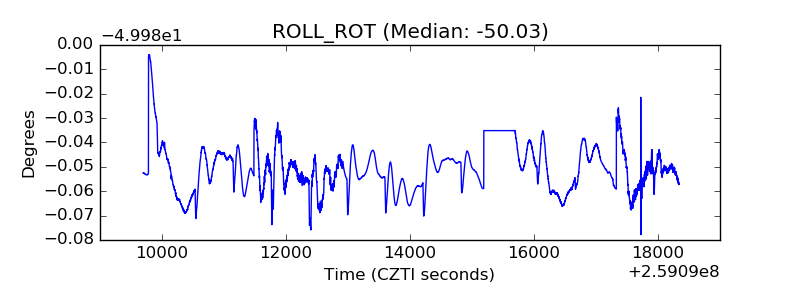 |
| _Roll_DEC | 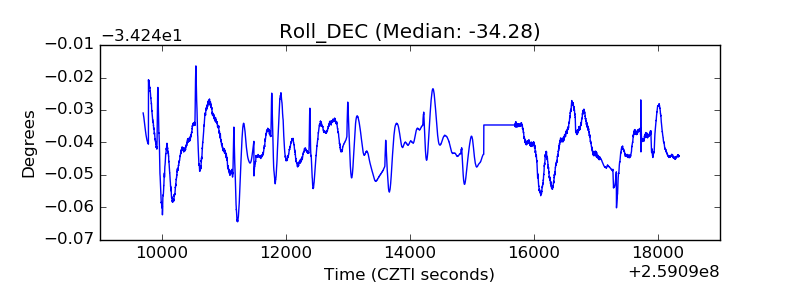 |
| _Roll_RA | 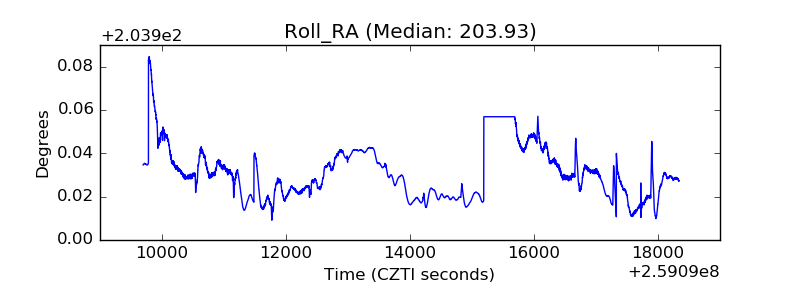 |
| Veto Counter | 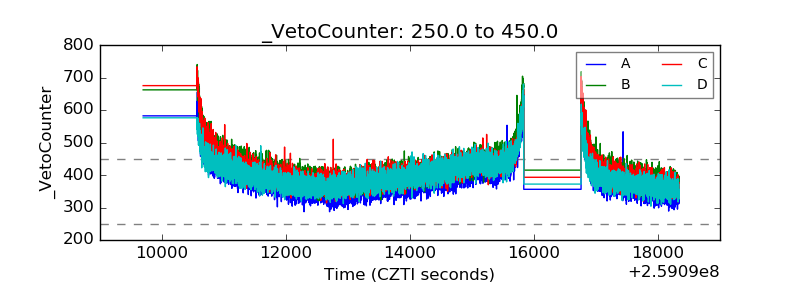 |