| Param | Original file | Final file |
|---|---|---|
| Filename | modeM0/AS1G08_082T01_9000001986_13363cztM0_level2.evt | modeM0/AS1G08_082T01_9000001986_13363cztM0_level2_quad_clean.evt |
| Size (bytes) | 512,081,280 | 103,656,960 |
| Size | 488.4 MB | 98.9 MB |
| Events in quadrant A | 3,639,073 | 657,824 |
| Events in quadrant B | 3,694,258 | 679,809 |
| Events in quadrant C | 3,661,839 | 657,416 |
| Events in quadrant D | 4,003,745 | 622,108 |
| Mode M9 | |||
|---|---|---|---|
| Quadrant | BADHDUFLAG | Total packets | Discarded packets |
| A | 0 | 14 | 0 |
| B | 0 | 14 | 0 |
| C | 0 | 14 | 0 |
| D | 0 | 14 | 0 |
| Mode M0 | |||
|---|---|---|---|
| Quadrant | BADHDUFLAG | Total packets | Discarded packets |
| A | 0 | 16029 | 3 |
| B | 0 | 16187 | 2 |
| C | 0 | 15894 | 2 |
| D | 0 | 17216 | 2 |
| Mode SS | |||
|---|---|---|---|
| Quadrant | BADHDUFLAG | Total packets | Discarded packets |
| A | 0 | 156 | 0 |
| B | 0 | 156 | 0 |
| C | 0 | 156 | 0 |
| D | 0 | 156 | 0 |
| Quadrant | Total seconds | Saturated seconds | Saturation percentage |
|---|---|---|---|
| A | 7498 | 38 | 0.506802% |
| B | 7498 | 59 | 0.786877% |
| C | 7498 | 14 | 0.186716% |
| D | 7498 | 77 | 1.026941% |
Noise dominated data is calculated using 1-second bins in cleaned event files. If a bin has >2000 counts, and if more than 50% of those come from <1% of pixels, then it is considered to be noise-dominated and hence unusable.
| Quadrant | # 1 sec bins | Bins with >0 counts | Bins with >2000 counts | High rate bins dominated by noise | Noise dominated (total time) | Noise dominated (detector-on time) | Marked lightcurve |
|---|---|---|---|---|---|---|---|
| A | 8919 | 7501 | 1 | 1 | 0.01% | 0.01% | 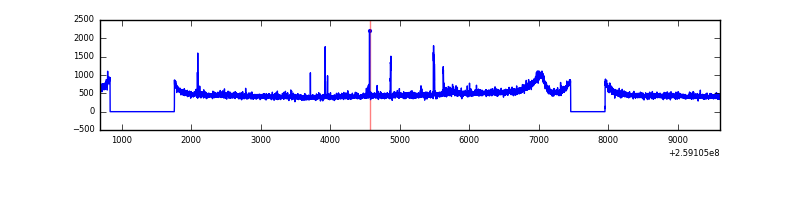 |
| B | 8919 | 7501 | 7 | 7 | 0.08% | 0.09% | 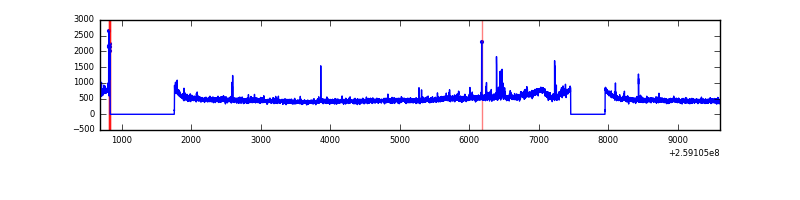 |
| C | 8919 | 7501 | 4 | 4 | 0.04% | 0.05% | 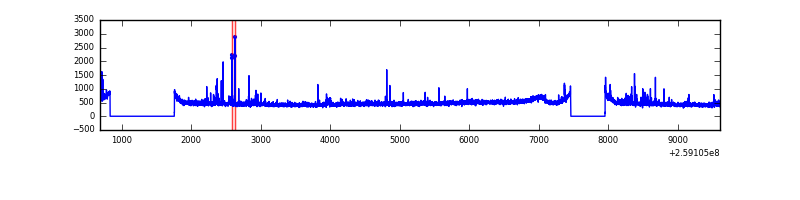 |
| D | 8919 | 7501 | 67 | 67 | 0.75% | 0.89% | 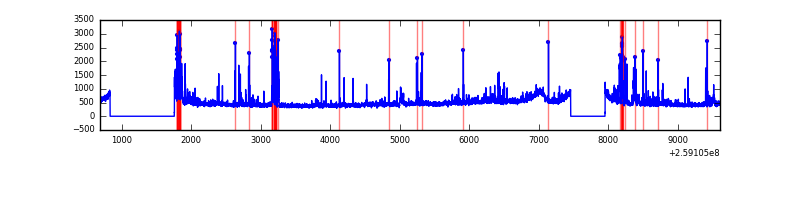 |
Top three noisy pixels from each quadrant. If the there are fewer than three noisy pixels in the level2.evt file, extra rows are filled as -1
| Pixel properties | Quadrant properties | ||||||
|---|---|---|---|---|---|---|---|
| Quadrant | DetID | PixID | Counts | Sigma | Mean | Median | Sigma |
| A | 5 | 98 | 44120 | 230.65 | 918 | 900 | 187.4 |
| A | 8 | 15 | 33499 | 173.97 | 918 | 900 | 187.4 |
| A | 1 | 162 | 13734 | 68.49 | 918 | 900 | 187.4 |
| B | 3 | 64 | 40918 | 226.24 | 916 | 890 | 176.9 |
| B | 4 | 142 | 31433 | 172.63 | 916 | 890 | 176.9 |
| B | 0 | 230 | 25683 | 140.13 | 916 | 890 | 176.9 |
| C | 14 | 220 | 144202 | 694.88 | 886 | 889 | 206.2 |
| C | 3 | 233 | 65966 | 315.54 | 886 | 889 | 206.2 |
| C | 13 | 61 | 6303 | 26.25 | 886 | 889 | 206.2 |
| D | 8 | 195 | 213319 | 998.89 | 877 | 851 | 212.7 |
| D | 2 | 136 | 145569 | 680.37 | 877 | 851 | 212.7 |
| D | 13 | 249 | 133088 | 621.7 | 877 | 851 | 212.7 |
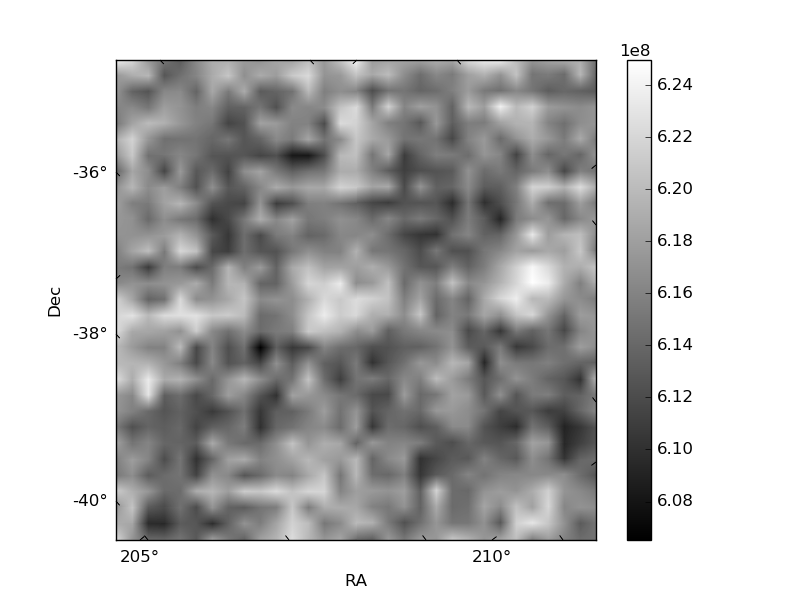
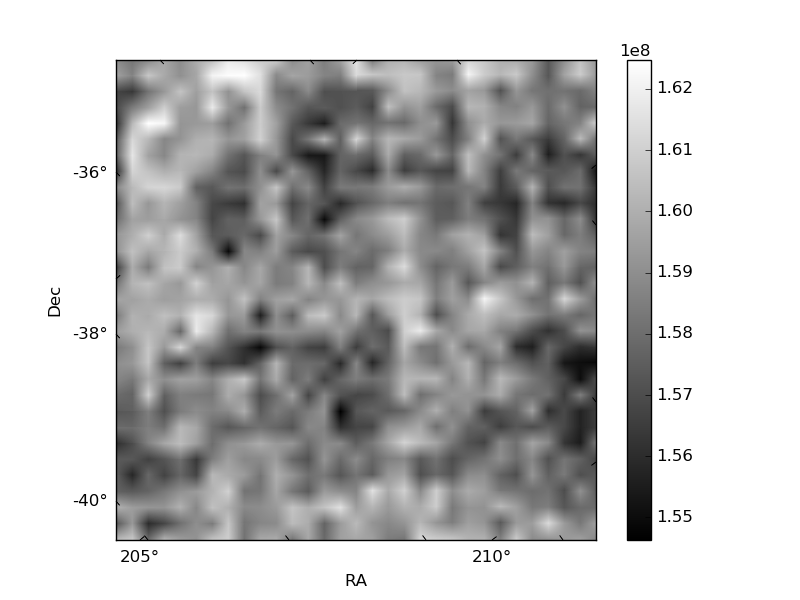
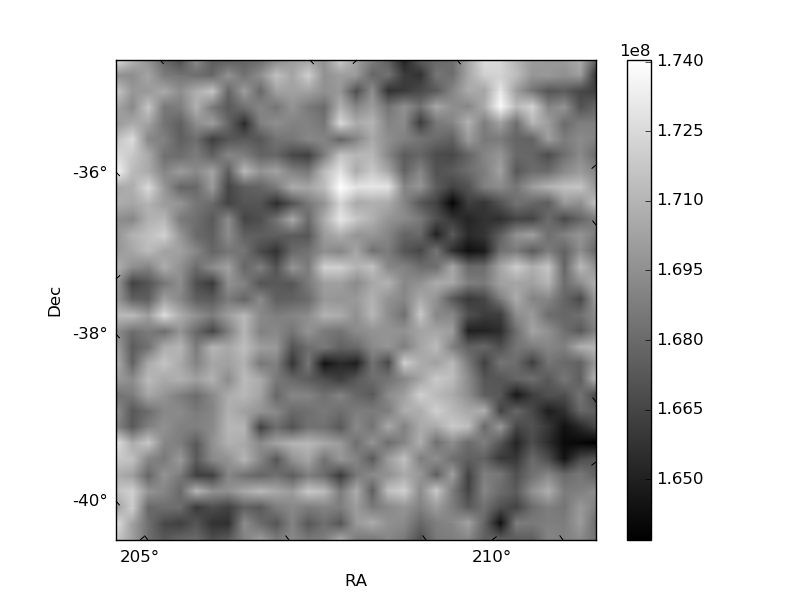
Histogram calculated using DETX and DETY for each event in the final _common_clean file
| Quadrant A | 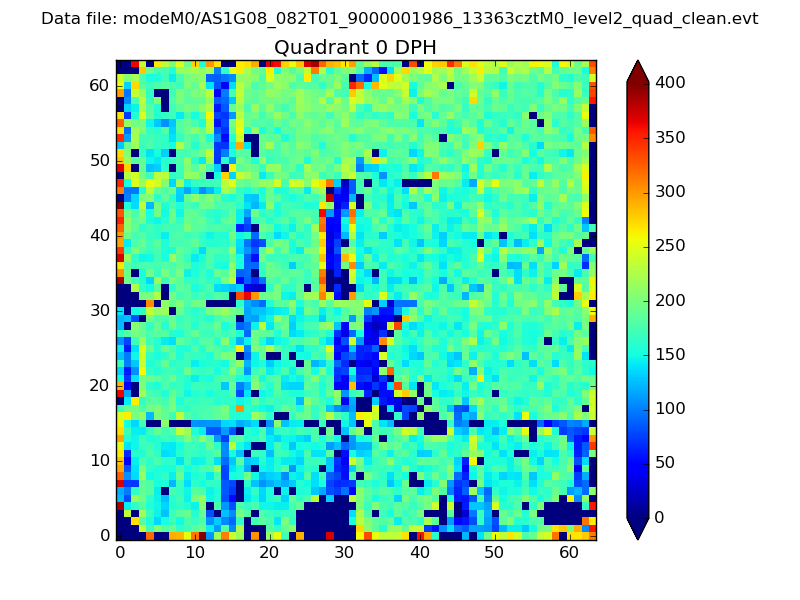 |
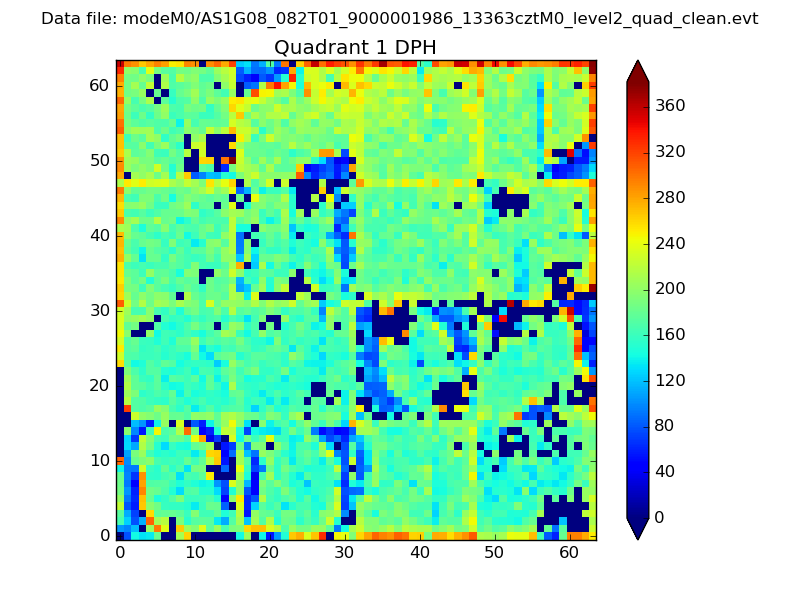 |
Quadrant B |
|---|---|---|---|
| Quadrant D | 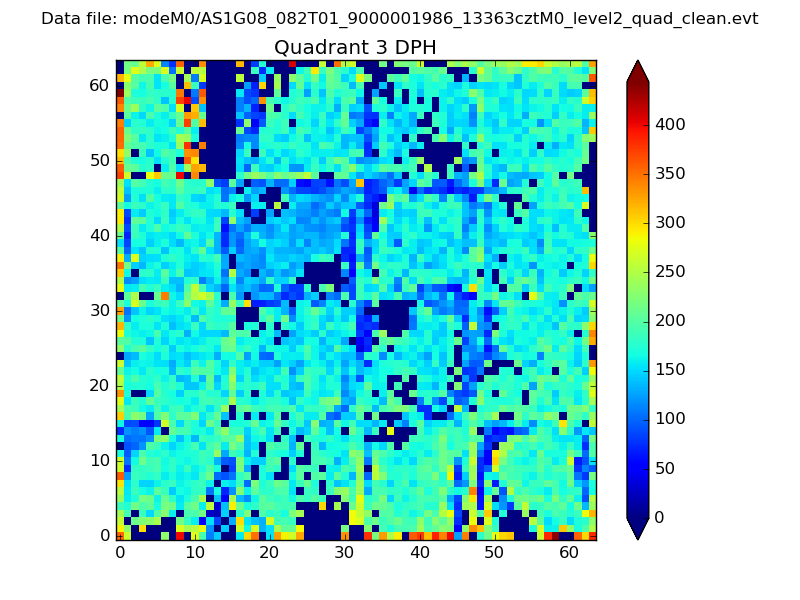 |
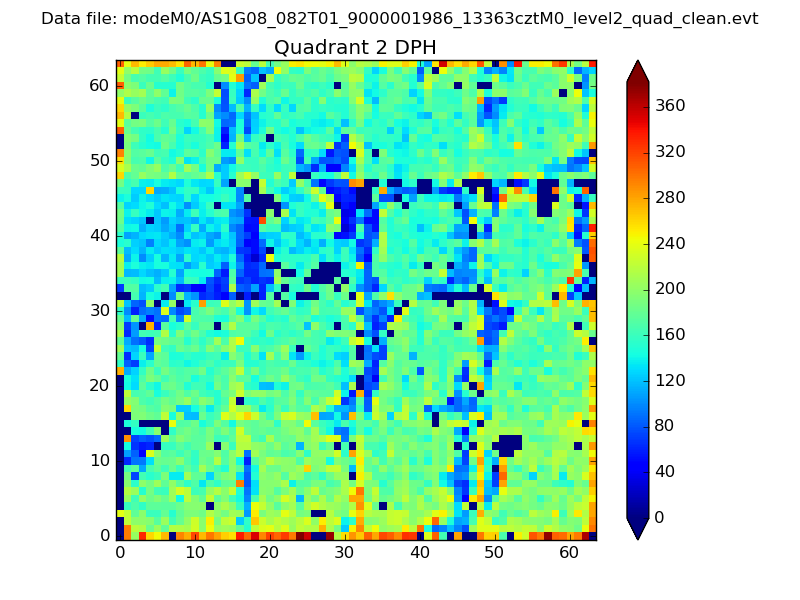 |
Quadrant C |
| Plot type | Count rate plots | Images |
|---|---|---|
| Comparison with Poisson distribution Blue bars denote a histogram of data divided into 1 sec bins. Red curve is a Poisson curve with rate = median count rate of data. |
 |
 |
| Quadrant-wise count rates Data is divided into 100 sec bins |
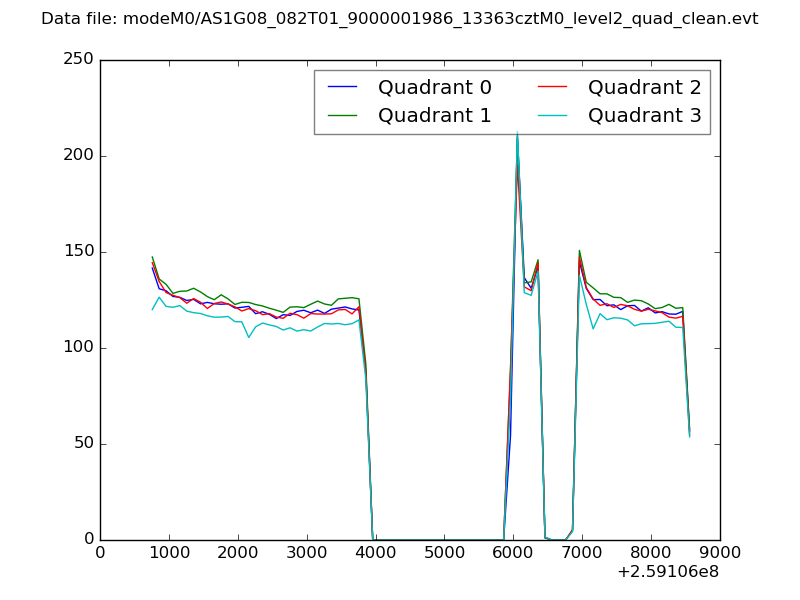 |
|
| Module-wise count rates for Quadrant A Data is divided into 100 sec bins |
 |
 |
| Module-wise count rates for Quadrant B Data is divided into 100 sec bins |
 |
 |
| Module-wise count rates for Quadrant C Data is divided into 100 sec bins |
 |
 |
| Module-wise count rates for Quadrant D Data is divided into 100 sec bins |
 |
 |
| Parameter | Plot |
|---|---|
| CZT HV Monitor |  |
| D_VDD | 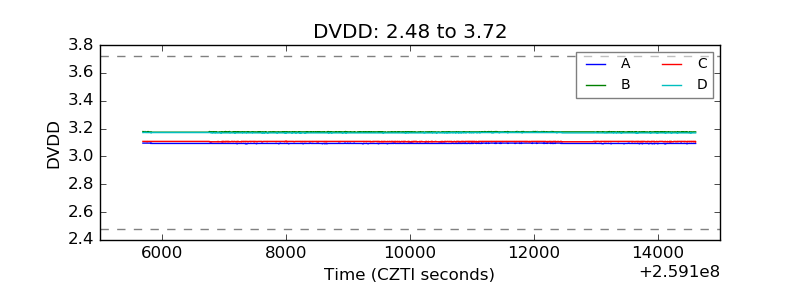 |
| Temperature 1 | 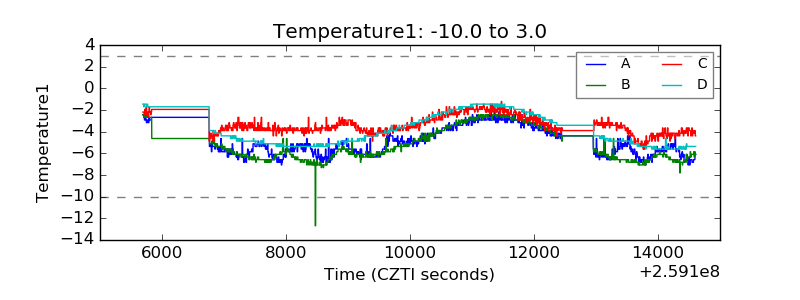 |
| Veto HV Monitor | 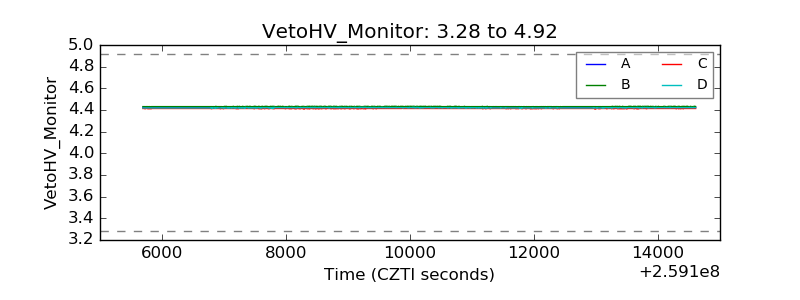 |
| Veto LLD | 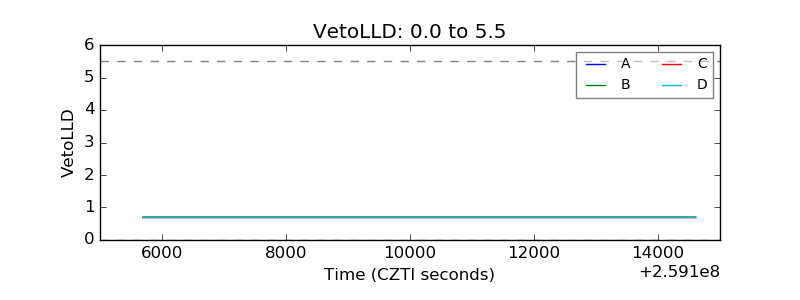 |
| Alpha Counter | 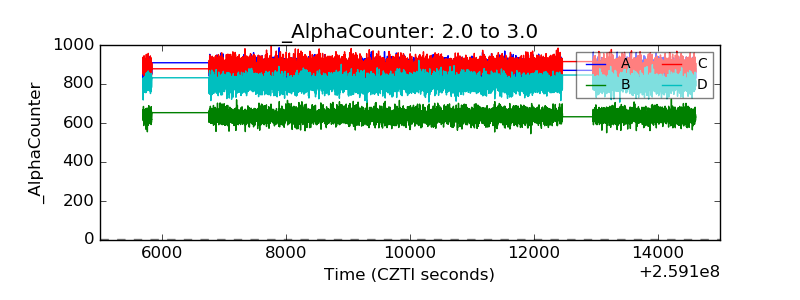 |
| _CPM_Rate | 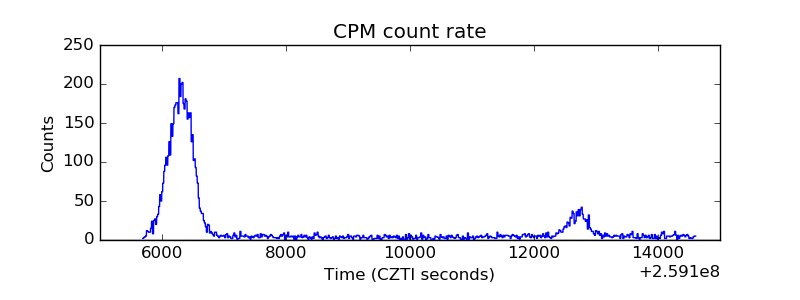 |
| CZT Counter | 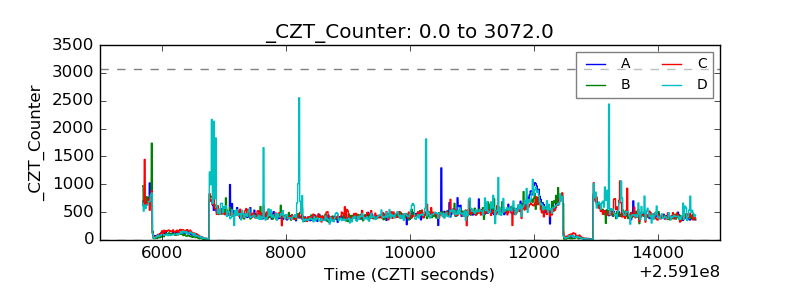 |
| +2.5 Volts monitor |  |
| +5 Volts monitor |  |
| _ROLL_ROT |  |
| _Roll_DEC |  |
| _Roll_RA | 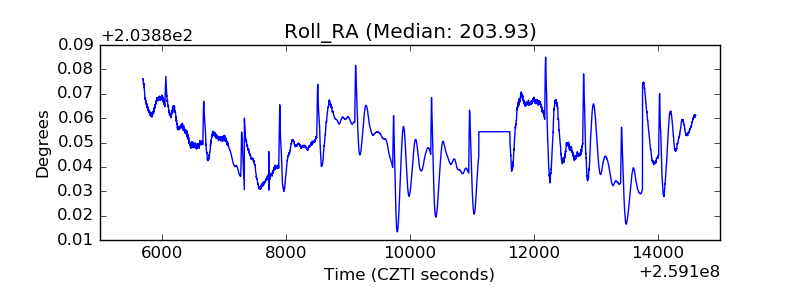 |
| Veto Counter |  |