| Param | Original file | Final file |
|---|---|---|
| Filename | modeM0/AS1G08_082T01_9000001986_13364cztM0_level2.evt | modeM0/AS1G08_082T01_9000001986_13364cztM0_level2_quad_clean.evt |
| Size (bytes) | 650,666,880 | 124,482,240 |
| Size | 620.5 MB | 118.7 MB |
| Events in quadrant A | 4,288,649 | 802,301 |
| Events in quadrant B | 4,301,778 | 819,878 |
| Events in quadrant C | 4,567,839 | 786,956 |
| Events in quadrant D | 5,951,879 | 750,830 |
| Mode M9 | |||
|---|---|---|---|
| Quadrant | BADHDUFLAG | Total packets | Discarded packets |
| A | 0 | 6 | 0 |
| B | 0 | 6 | 0 |
| C | 0 | 6 | 0 |
| D | 0 | 6 | 0 |
| Mode M0 | |||
|---|---|---|---|
| Quadrant | BADHDUFLAG | Total packets | Discarded packets |
| A | 0 | 18769 | 3 |
| B | 0 | 18784 | 2 |
| C | 0 | 19435 | 2 |
| D | 0 | 23740 | 2 |
| Mode SS | |||
|---|---|---|---|
| Quadrant | BADHDUFLAG | Total packets | Discarded packets |
| A | 0 | 178 | 0 |
| B | 0 | 178 | 0 |
| C | 0 | 178 | 0 |
| D | 0 | 178 | 0 |
| Quadrant | Total seconds | Saturated seconds | Saturation percentage |
|---|---|---|---|
| A | 8794 | 73 | 0.830111% |
| B | 8794 | 109 | 1.239481% |
| C | 8794 | 111 | 1.262224% |
| D | 8794 | 248 | 2.820105% |
Noise dominated data is calculated using 1-second bins in cleaned event files. If a bin has >2000 counts, and if more than 50% of those come from <1% of pixels, then it is considered to be noise-dominated and hence unusable.
| Quadrant | # 1 sec bins | Bins with >0 counts | Bins with >2000 counts | High rate bins dominated by noise | Noise dominated (total time) | Noise dominated (detector-on time) | Marked lightcurve |
|---|---|---|---|---|---|---|---|
| A | 9310 | 8797 | 1 | 1 | 0.01% | 0.01% | 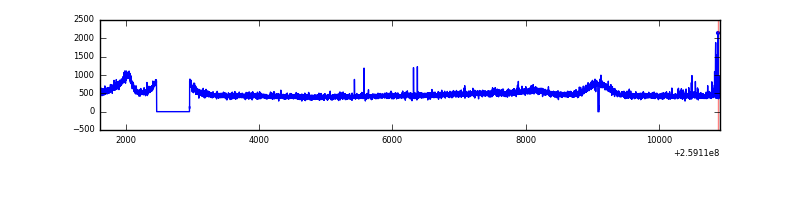 |
| B | 9310 | 8797 | 0 | 0 | 0.00% | 0.00% | 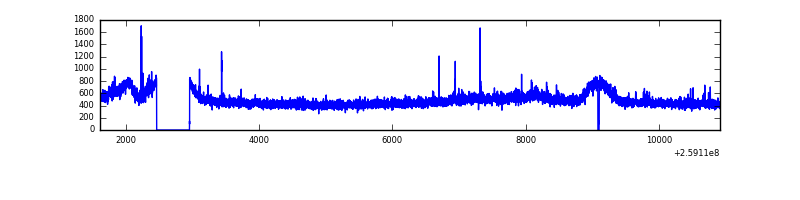 |
| C | 9310 | 8797 | 23 | 23 | 0.25% | 0.26% | 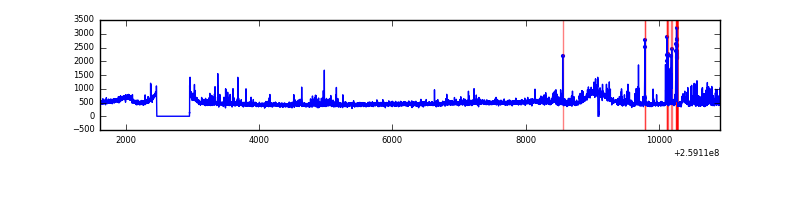 |
| D | 9310 | 8797 | 76 | 76 | 0.82% | 0.86% | 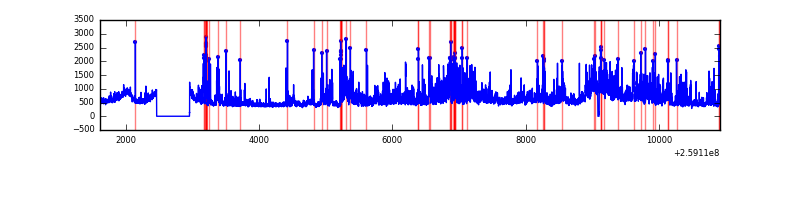 |
Top three noisy pixels from each quadrant. If the there are fewer than three noisy pixels in the level2.evt file, extra rows are filled as -1
| Pixel properties | Quadrant properties | ||||||
|---|---|---|---|---|---|---|---|
| Quadrant | DetID | PixID | Counts | Sigma | Mean | Median | Sigma |
| A | 9 | 143 | 35094 | 152.17 | 1092 | 1067 | 223.6 |
| A | 8 | 15 | 24975 | 106.92 | 1092 | 1067 | 223.6 |
| A | 1 | 162 | 17415 | 73.11 | 1092 | 1067 | 223.6 |
| B | 0 | 230 | 28374 | 131.58 | 1083 | 1055 | 207.6 |
| B | 12 | 111 | 24608 | 113.44 | 1083 | 1055 | 207.6 |
| B | 11 | 111 | 20285 | 92.62 | 1083 | 1055 | 207.6 |
| C | 14 | 220 | 401281 | 1627.26 | 1053 | 1058 | 245.9 |
| C | 3 | 233 | 56336 | 224.75 | 1053 | 1058 | 245.9 |
| C | 13 | 61 | 7688 | 26.96 | 1053 | 1058 | 245.9 |
| D | 1 | 52 | 719888 | 2843.06 | 1044 | 1010 | 252.9 |
| D | 9 | 85 | 452462 | 1785.43 | 1044 | 1010 | 252.9 |
| D | 8 | 195 | 414640 | 1635.85 | 1044 | 1010 | 252.9 |
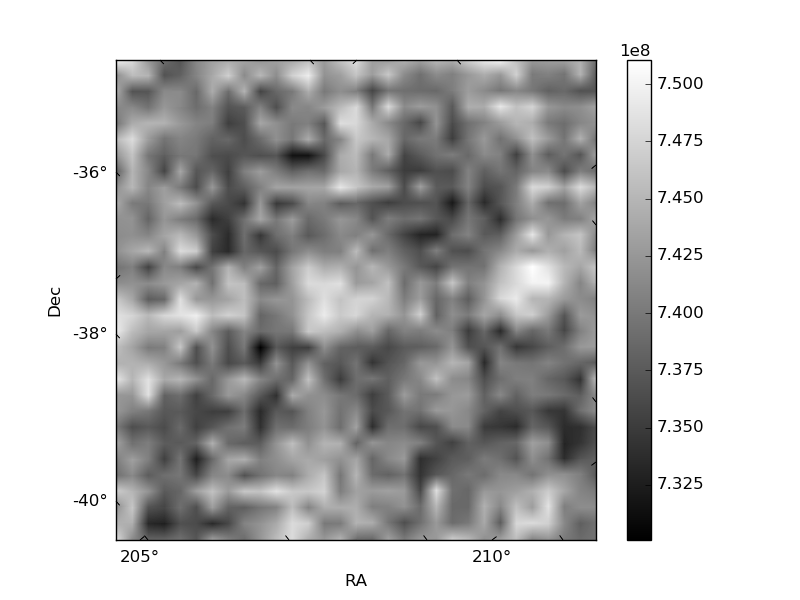
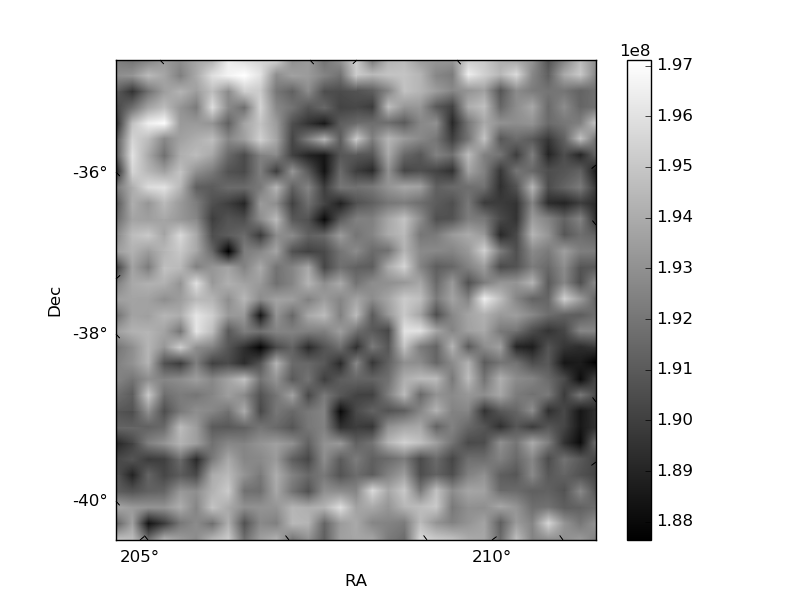
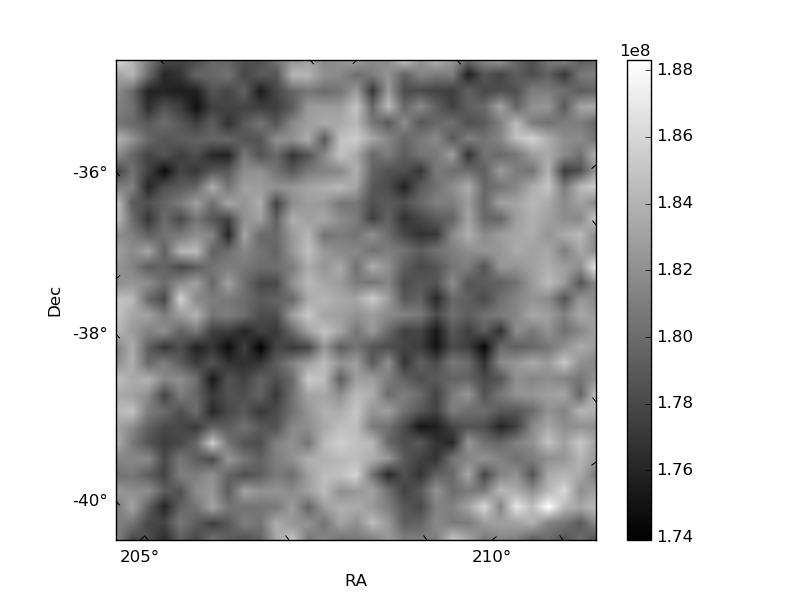
Histogram calculated using DETX and DETY for each event in the final _common_clean file
| Quadrant A | 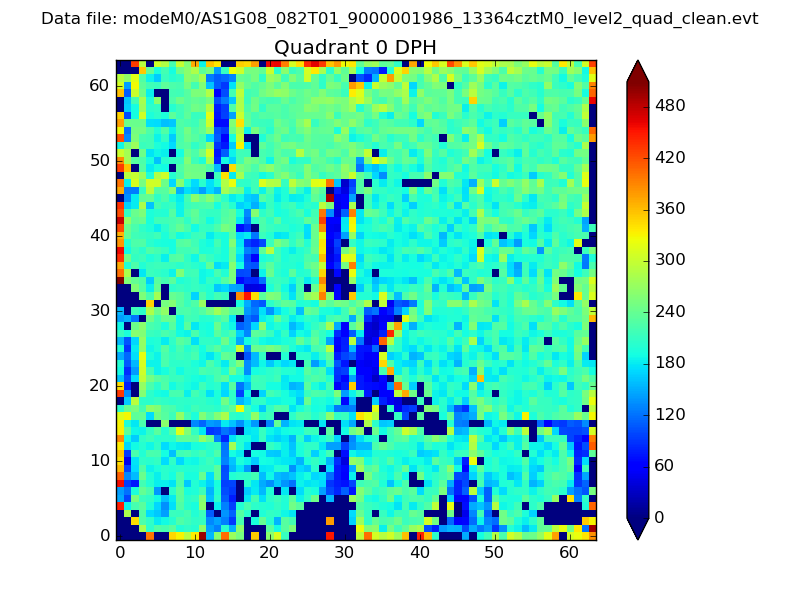 |
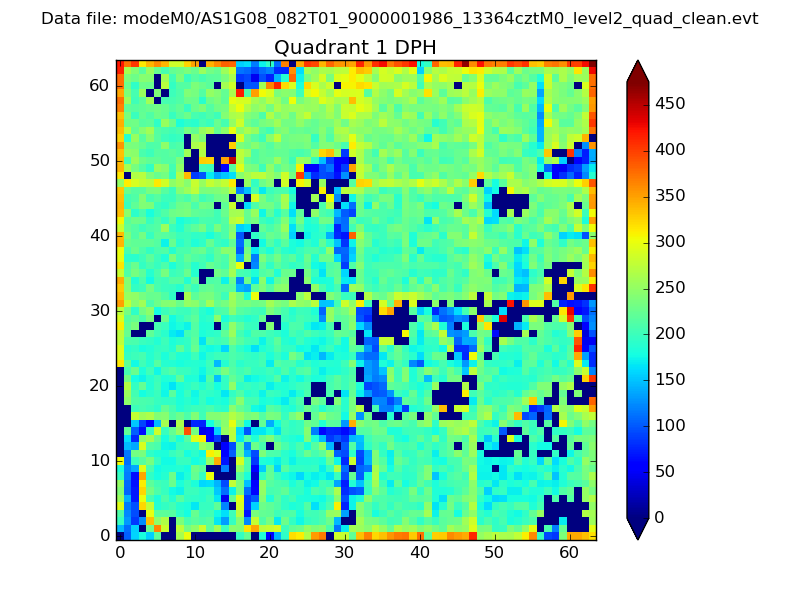 |
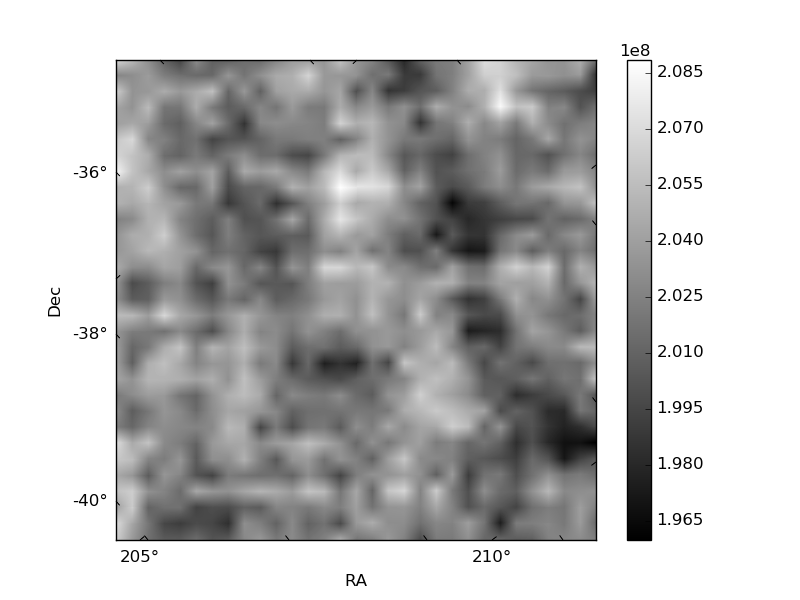
Quadrant B |
|---|---|---|---|
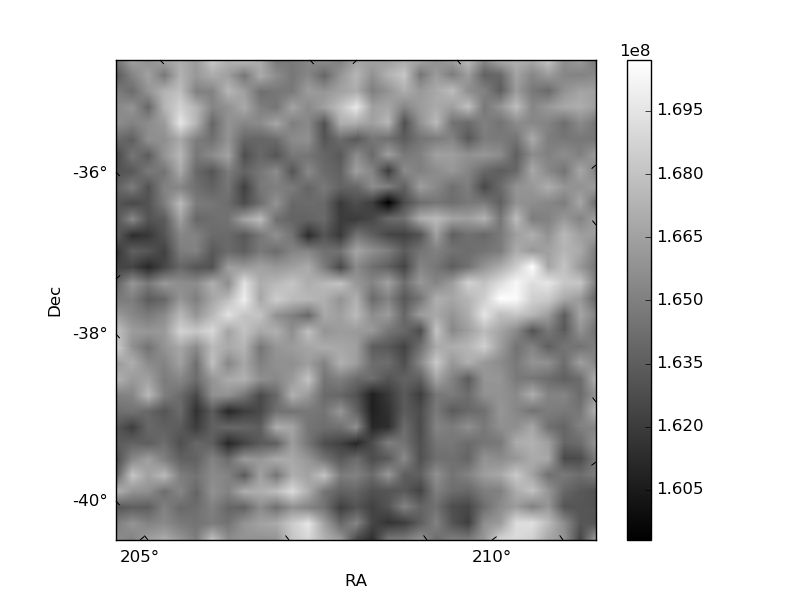
| Quadrant D | 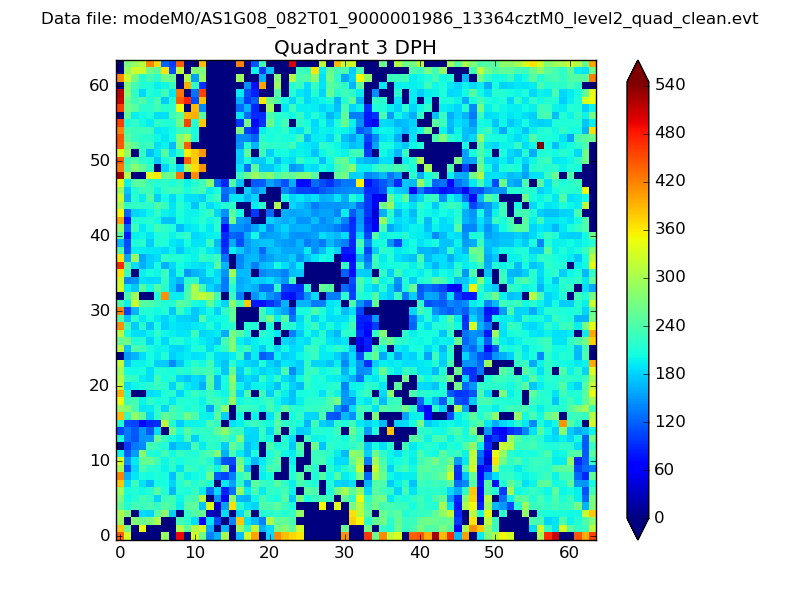 |
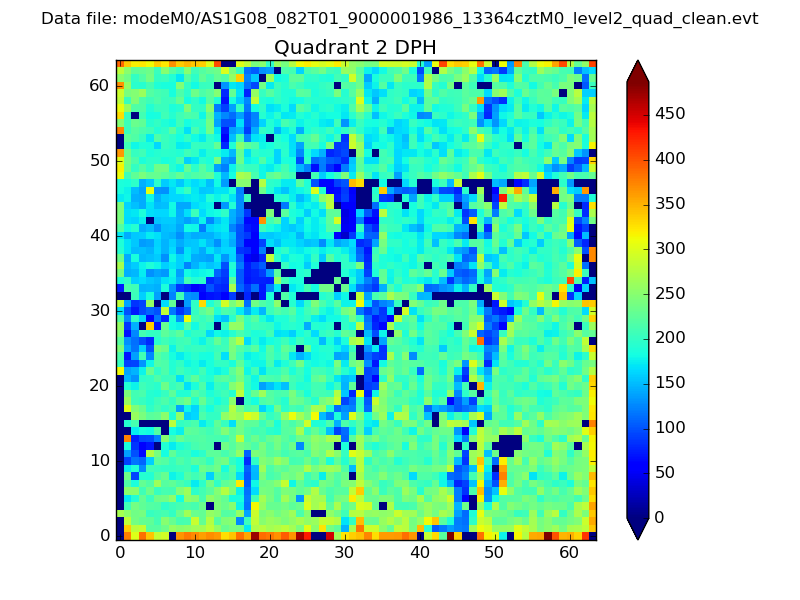 |
Quadrant C |
| Plot type | Count rate plots | Images |
|---|---|---|
| Comparison with Poisson distribution Blue bars denote a histogram of data divided into 1 sec bins. Red curve is a Poisson curve with rate = median count rate of data. |
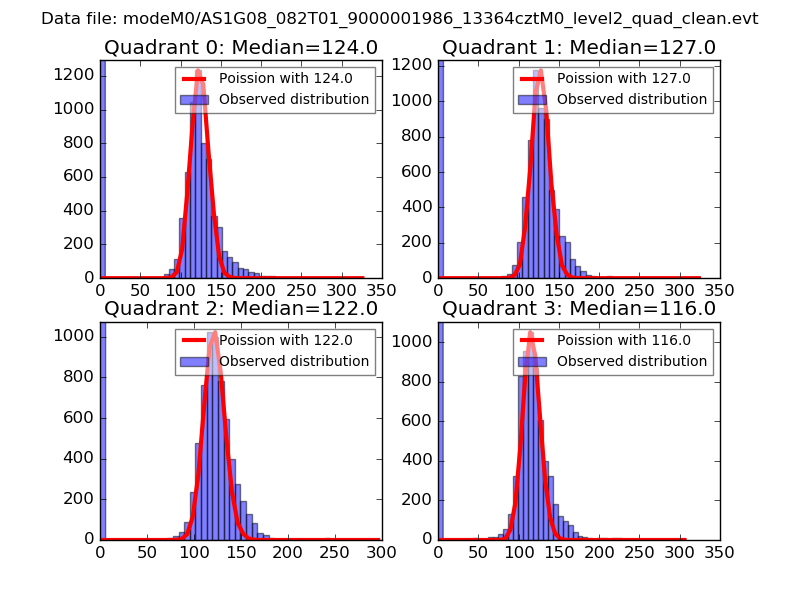 |
 |
| Quadrant-wise count rates Data is divided into 100 sec bins |
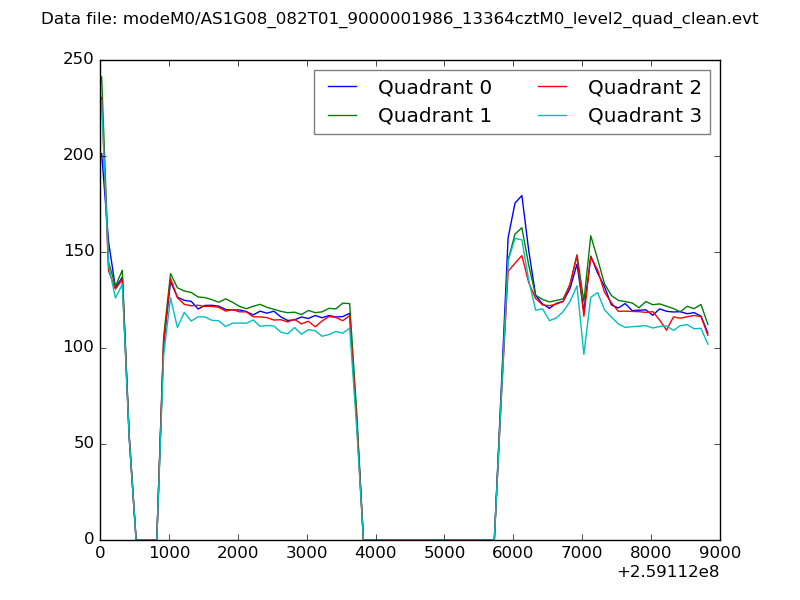 |
|
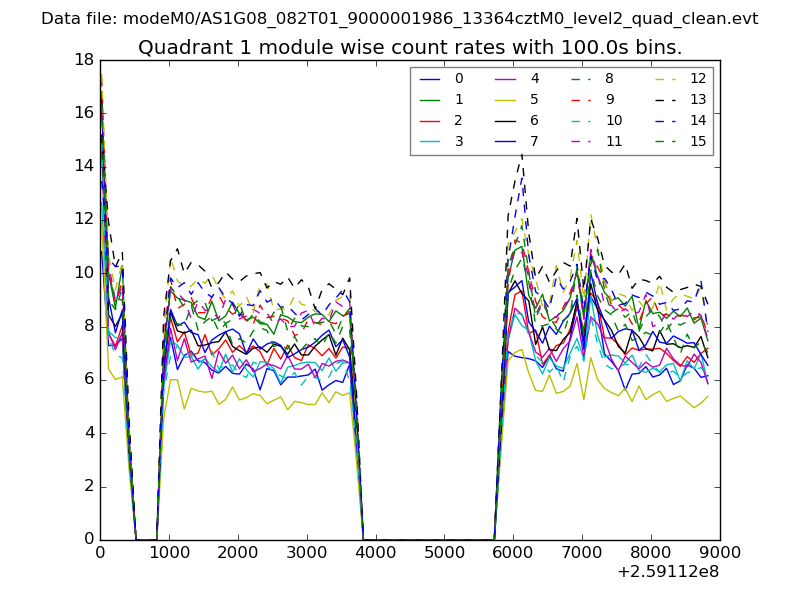
| Module-wise count rates for Quadrant A Data is divided into 100 sec bins |
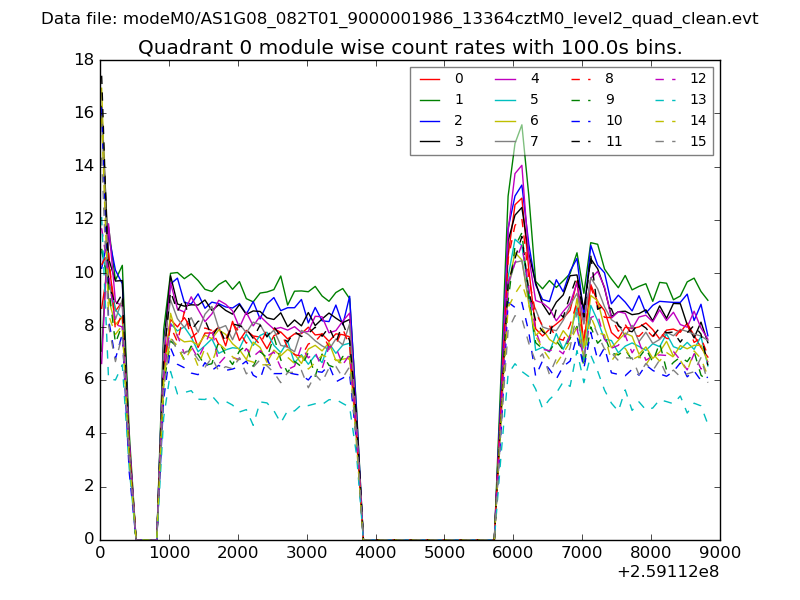 |
 |
| Module-wise count rates for Quadrant B Data is divided into 100 sec bins |
 |
 |
| Module-wise count rates for Quadrant C Data is divided into 100 sec bins |
 |
 |
| Module-wise count rates for Quadrant D Data is divided into 100 sec bins |
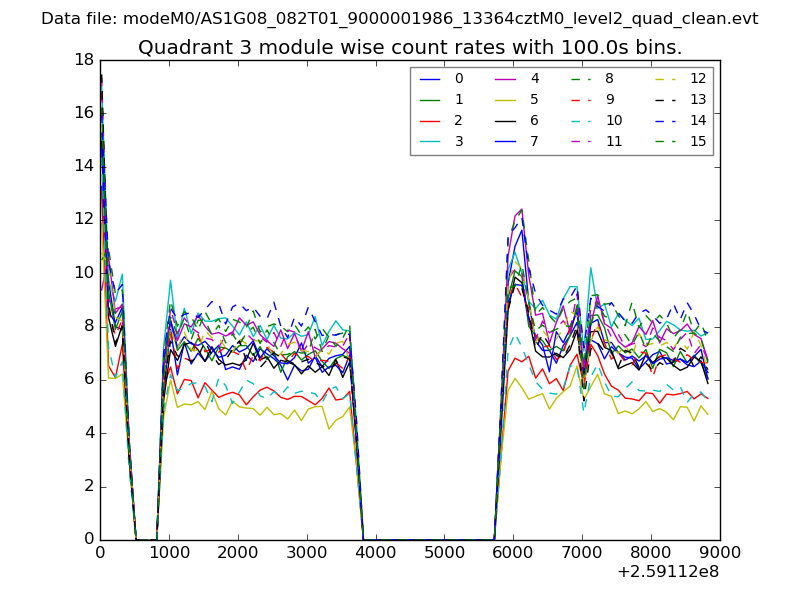 |
 |
| Parameter | Plot |
|---|---|
| CZT HV Monitor |  |
| D_VDD | 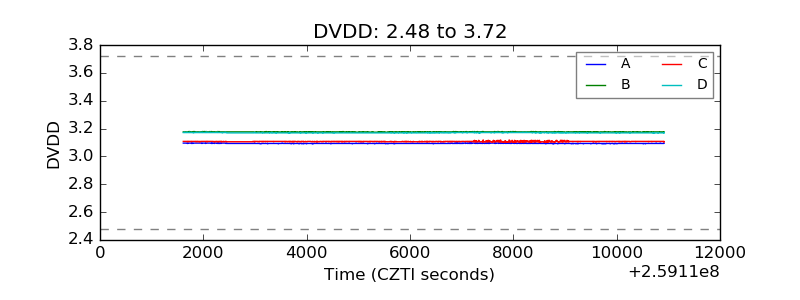 |
| Temperature 1 | 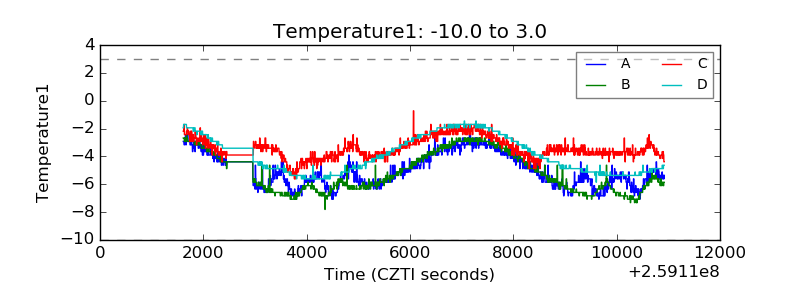 |
| Veto HV Monitor | 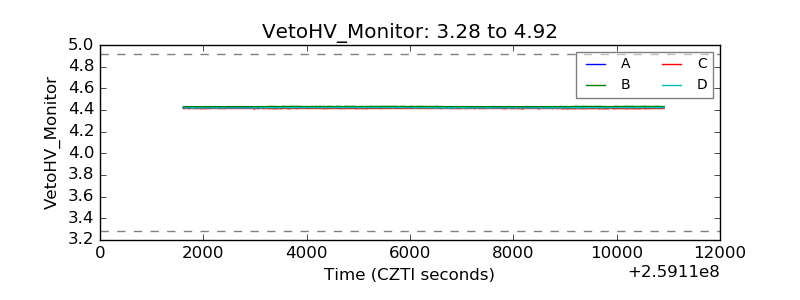 |
| Veto LLD | 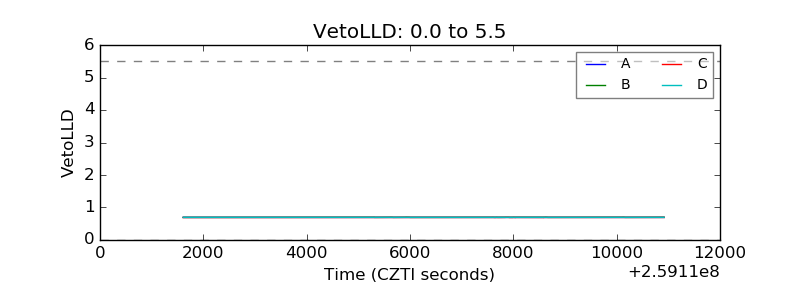 |
| Alpha Counter | 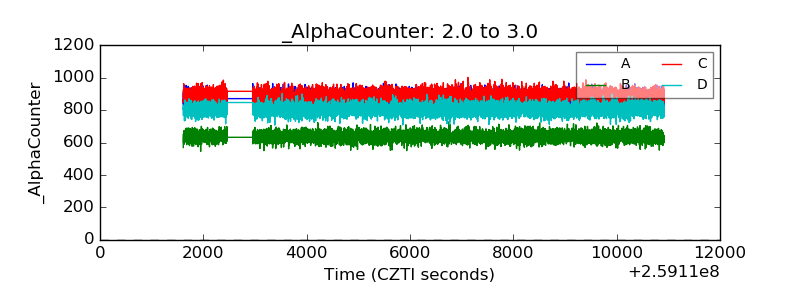 |
| _CPM_Rate | 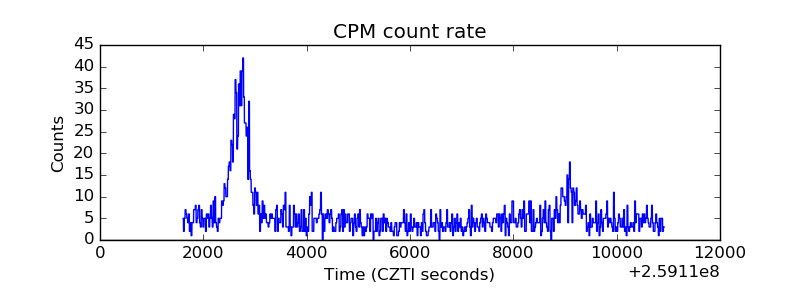 |
| CZT Counter | 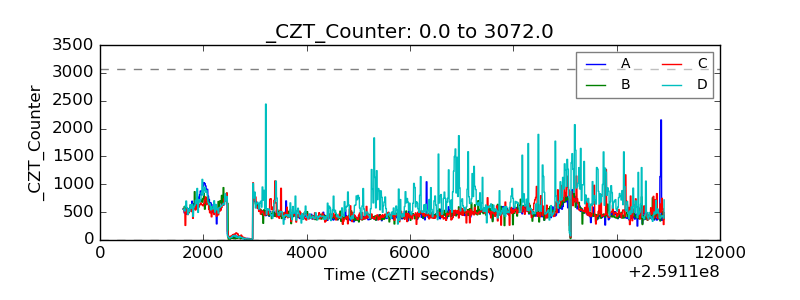 |
| +2.5 Volts monitor |  |
| +5 Volts monitor |  |
| _ROLL_ROT | 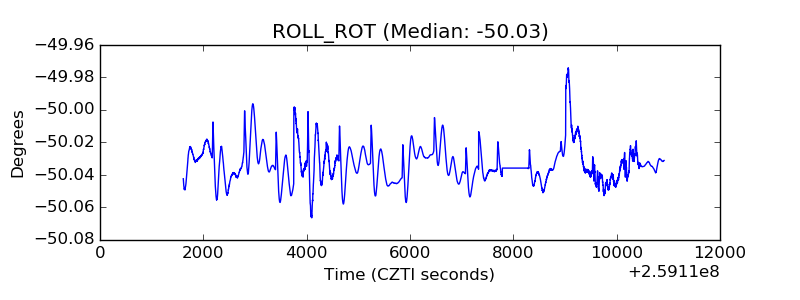 |
| _Roll_DEC | 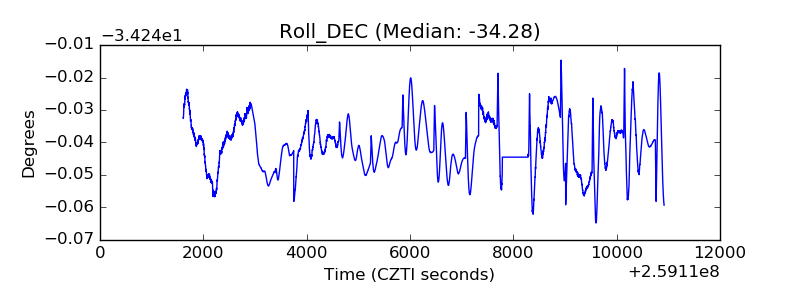 |
| _Roll_RA | 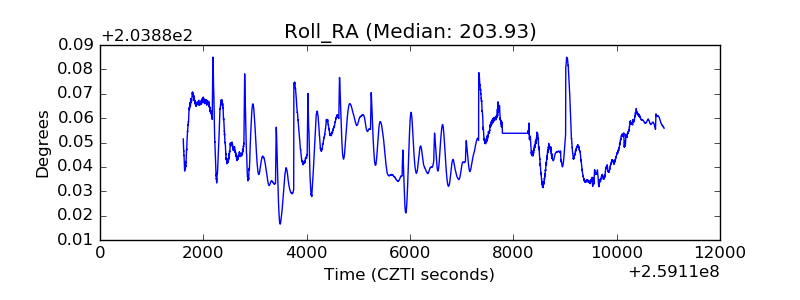 |
| Veto Counter | 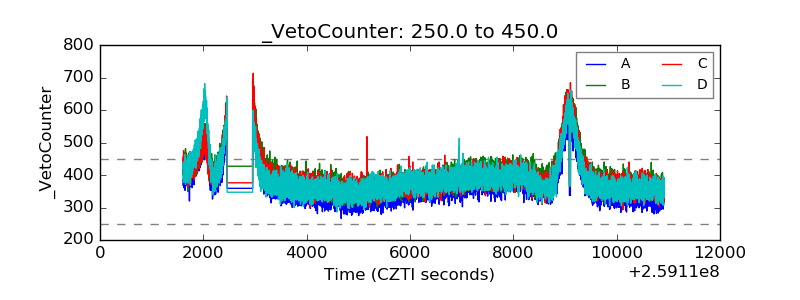 |