| Param | Original file | Final file |
|---|---|---|
| Filename | modeM0/AS1G08_082T01_9000001986_13365cztM0_level2.evt | modeM0/AS1G08_082T01_9000001986_13365cztM0_level2_quad_clean.evt |
| Size (bytes) | 671,293,440 | 126,213,120 |
| Size | 640.2 MB | 120.4 MB |
| Events in quadrant A | 4,160,950 | 822,686 |
| Events in quadrant B | 4,358,524 | 838,621 |
| Events in quadrant C | 4,560,616 | 808,731 |
| Events in quadrant D | 6,663,432 | 751,036 |
| Mode M9 | |||
|---|---|---|---|
| Quadrant | BADHDUFLAG | Total packets | Discarded packets |
| A | 0 | 3 | 0 |
| B | 0 | 3 | 0 |
| C | 0 | 3 | 0 |
| D | 0 | 3 | 0 |
| Mode M0 | |||
|---|---|---|---|
| Quadrant | BADHDUFLAG | Total packets | Discarded packets |
| A | 0 | 18204 | 3 |
| B | 0 | 18896 | 2 |
| C | 0 | 19266 | 2 |
| D | 0 | 25688 | 2 |
| Mode SS | |||
|---|---|---|---|
| Quadrant | BADHDUFLAG | Total packets | Discarded packets |
| A | 0 | 176 | 0 |
| B | 0 | 176 | 0 |
| C | 0 | 176 | 0 |
| D | 0 | 176 | 0 |
| Quadrant | Total seconds | Saturated seconds | Saturation percentage |
|---|---|---|---|
| A | 8661 | 119 | 1.373975% |
| B | 8661 | 215 | 2.482392% |
| C | 8661 | 176 | 2.032098% |
| D | 8661 | 643 | 7.424085% |
Noise dominated data is calculated using 1-second bins in cleaned event files. If a bin has >2000 counts, and if more than 50% of those come from <1% of pixels, then it is considered to be noise-dominated and hence unusable.
| Quadrant | # 1 sec bins | Bins with >0 counts | Bins with >2000 counts | High rate bins dominated by noise | Noise dominated (total time) | Noise dominated (detector-on time) | Marked lightcurve |
|---|---|---|---|---|---|---|---|
| A | 8882 | 8664 | 8 | 8 | 0.09% | 0.09% | 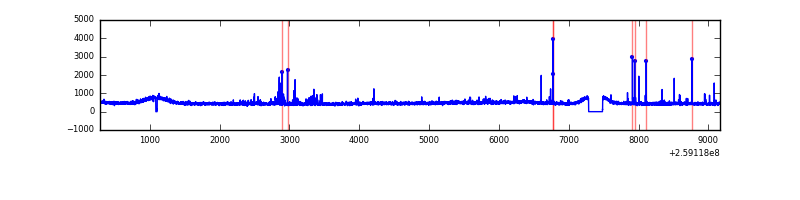 |
| B | 8882 | 8664 | 13 | 13 | 0.15% | 0.15% | 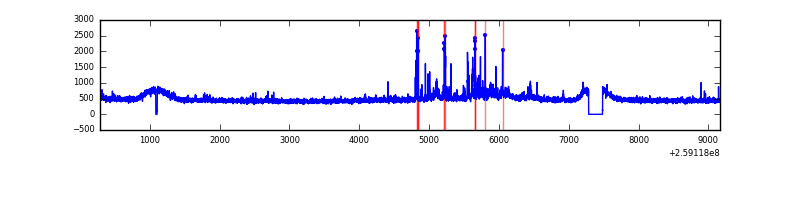 |
| C | 8882 | 8664 | 27 | 27 | 0.30% | 0.31% | 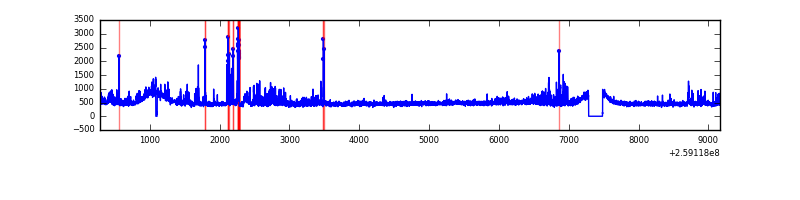 |
| D | 8882 | 8664 | 362 | 362 | 4.08% | 4.18% |  |
Top three noisy pixels from each quadrant. If the there are fewer than three noisy pixels in the level2.evt file, extra rows are filled as -1
| Pixel properties | Quadrant properties | ||||||
|---|---|---|---|---|---|---|---|
| Quadrant | DetID | PixID | Counts | Sigma | Mean | Median | Sigma |
| A | 9 | 143 | 101976 | 475.0 | 1040 | 1015 | 212.5 |
| A | 1 | 162 | 18436 | 81.96 | 1040 | 1015 | 212.5 |
| A | 15 | 69 | 12261 | 52.91 | 1040 | 1015 | 212.5 |
| B | 3 | 64 | 129611 | 640.5 | 1044 | 1013 | 200.8 |
| B | 0 | 189 | 66465 | 325.99 | 1044 | 1013 | 200.8 |
| B | 0 | 230 | 48696 | 237.49 | 1044 | 1013 | 200.8 |
| C | 14 | 220 | 488587 | 2051.2 | 1021 | 1027 | 237.7 |
| C | 3 | 233 | 86771 | 360.73 | 1021 | 1027 | 237.7 |
| C | 13 | 61 | 7581 | 27.57 | 1021 | 1027 | 237.7 |
| D | 1 | 52 | 2062332 | 8624.31 | 984 | 952 | 239.0 |
| D | 8 | 195 | 362742 | 1513.64 | 984 | 952 | 239.0 |
| D | 9 | 85 | 225180 | 938.12 | 984 | 952 | 239.0 |
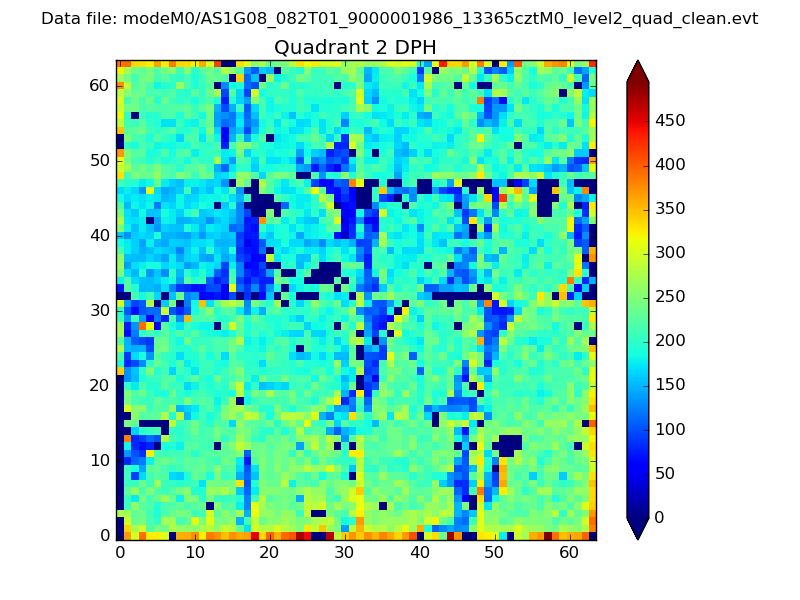
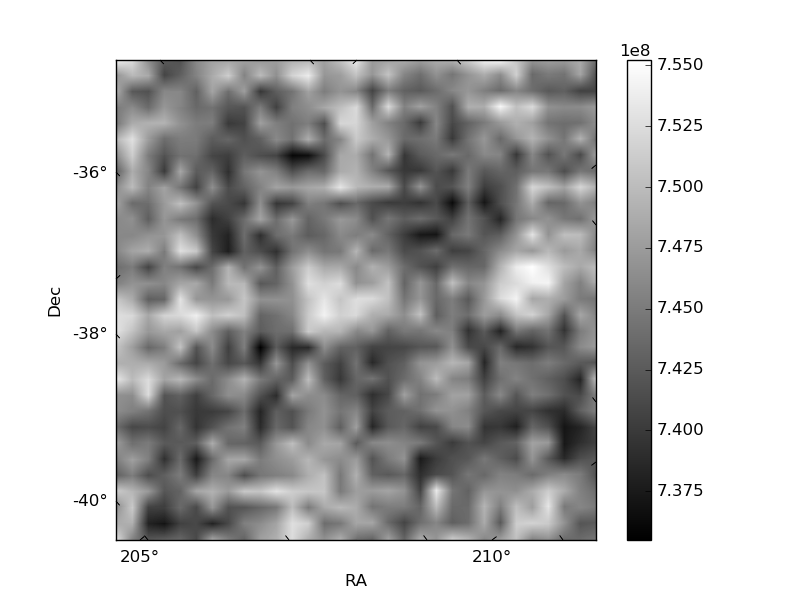
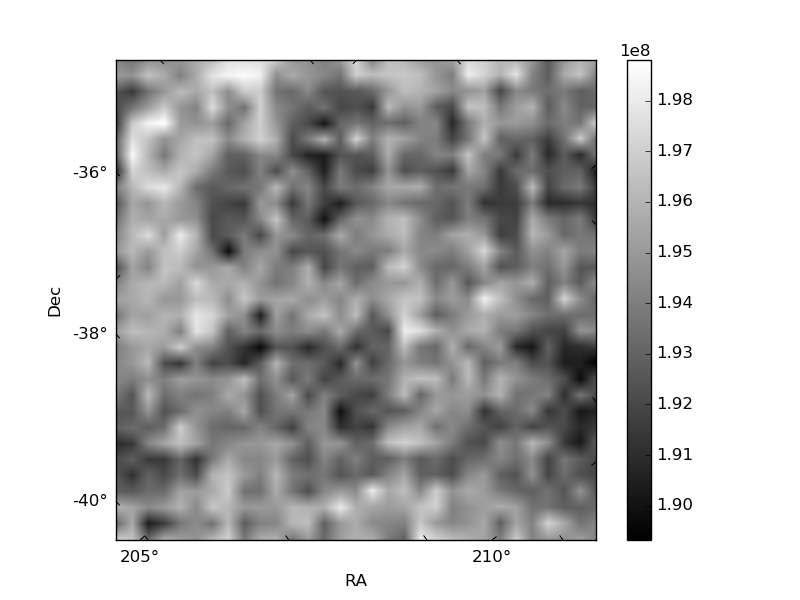
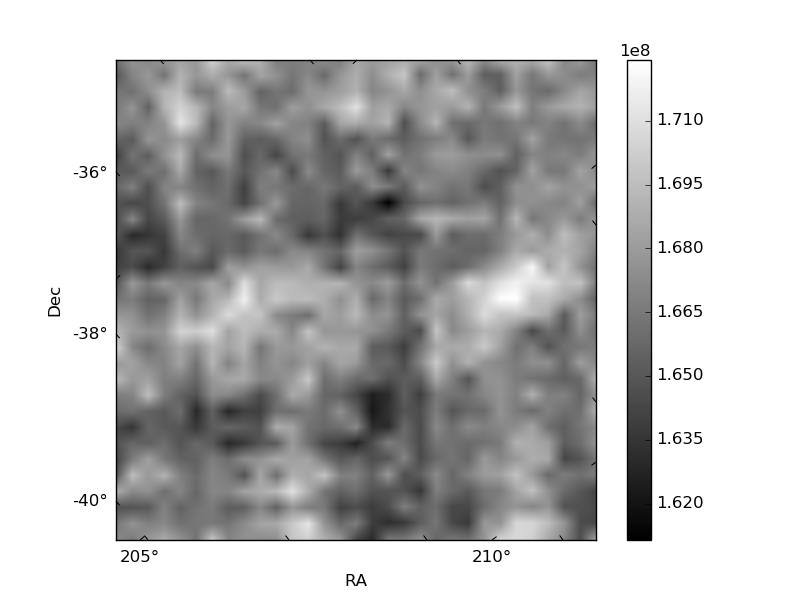
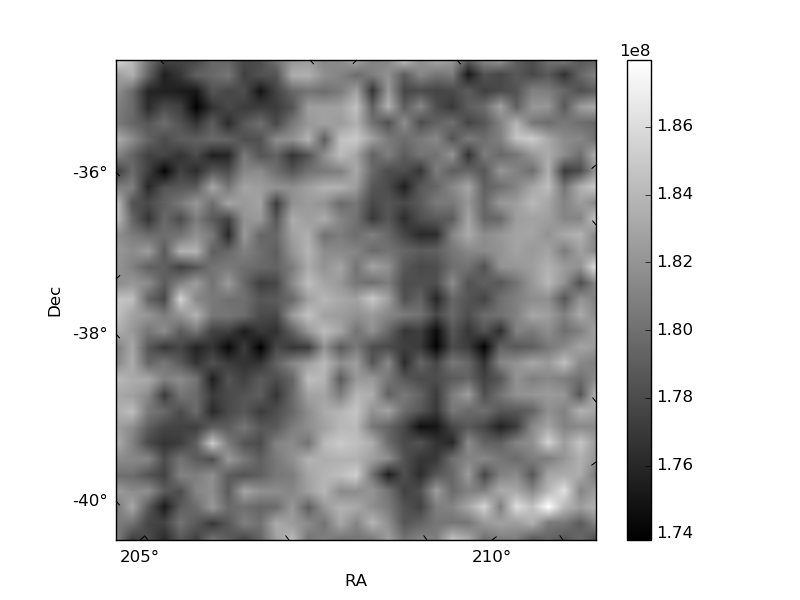
Histogram calculated using DETX and DETY for each event in the final _common_clean file
| Quadrant A |  |
 |
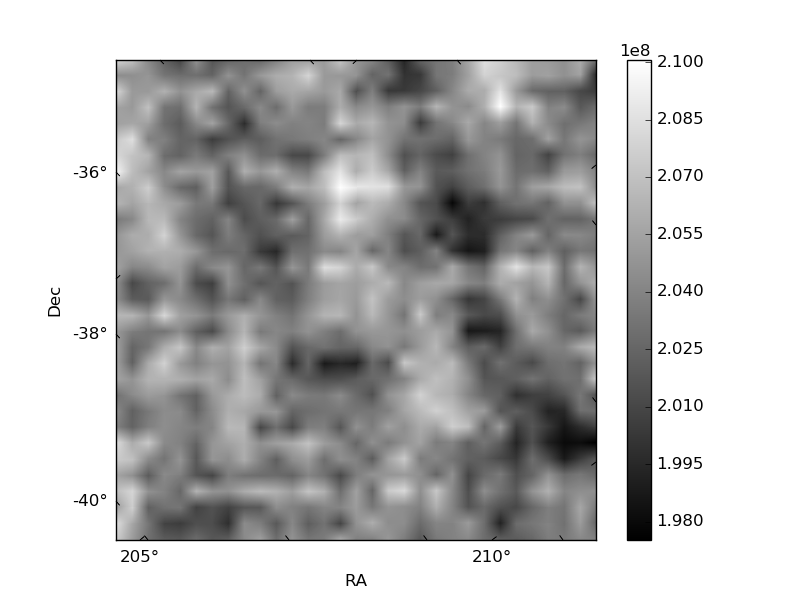
Quadrant B |
|---|---|---|---|
| Quadrant D |  |
 |
Quadrant C |
| Plot type | Count rate plots | Images |
|---|---|---|
| Comparison with Poisson distribution Blue bars denote a histogram of data divided into 1 sec bins. Red curve is a Poisson curve with rate = median count rate of data. |
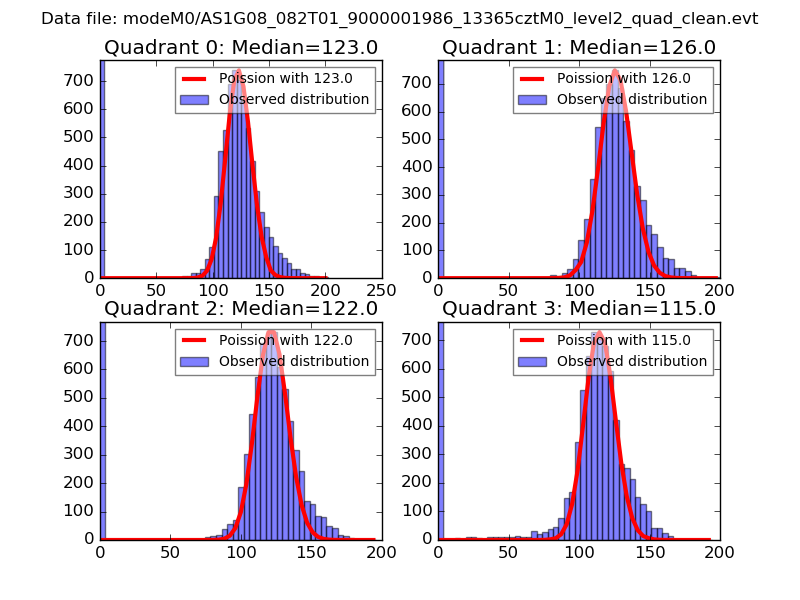 |
 |
| Quadrant-wise count rates Data is divided into 100 sec bins |
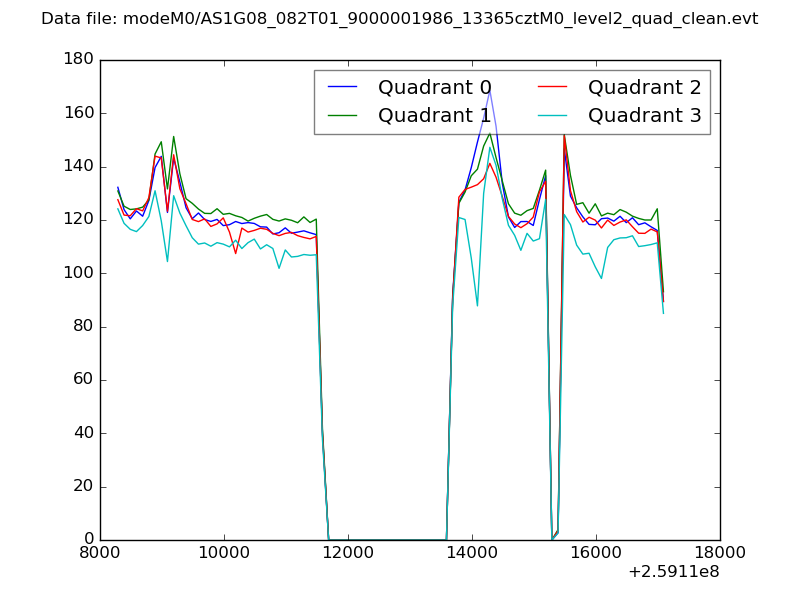 |
|
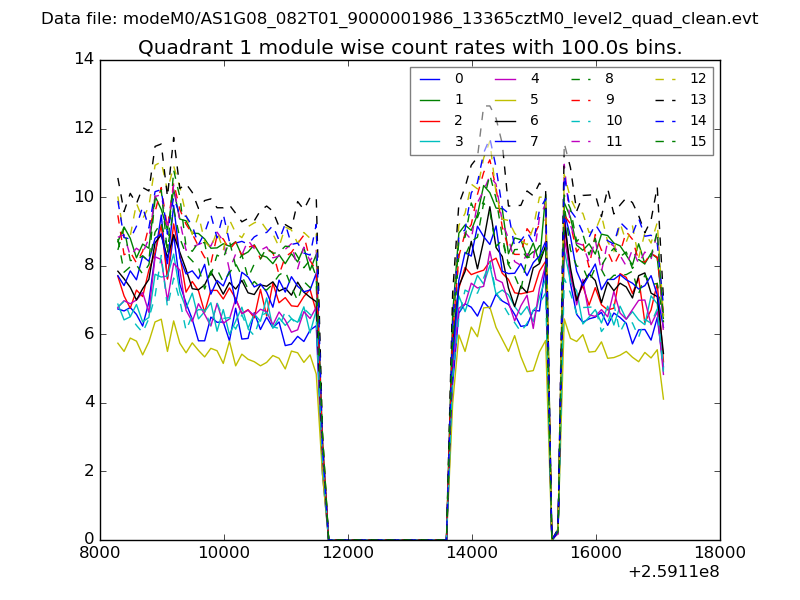
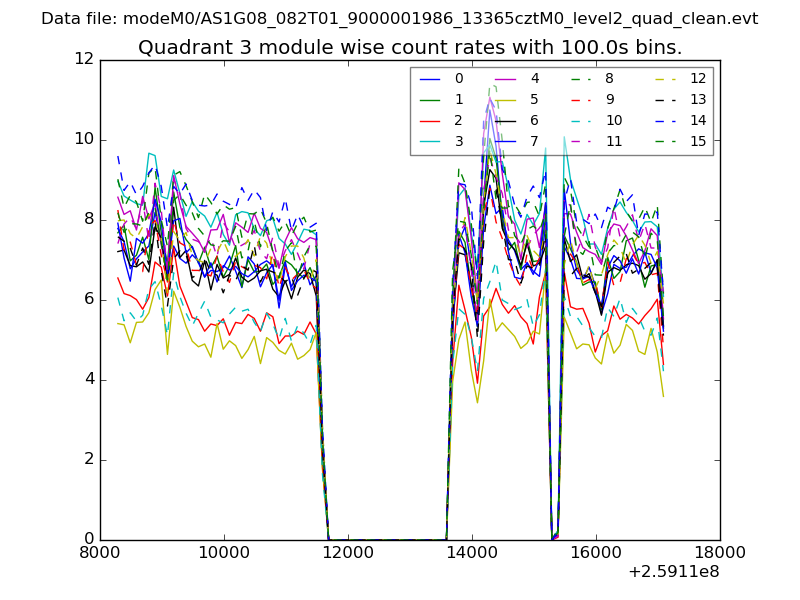
| Module-wise count rates for Quadrant A Data is divided into 100 sec bins |
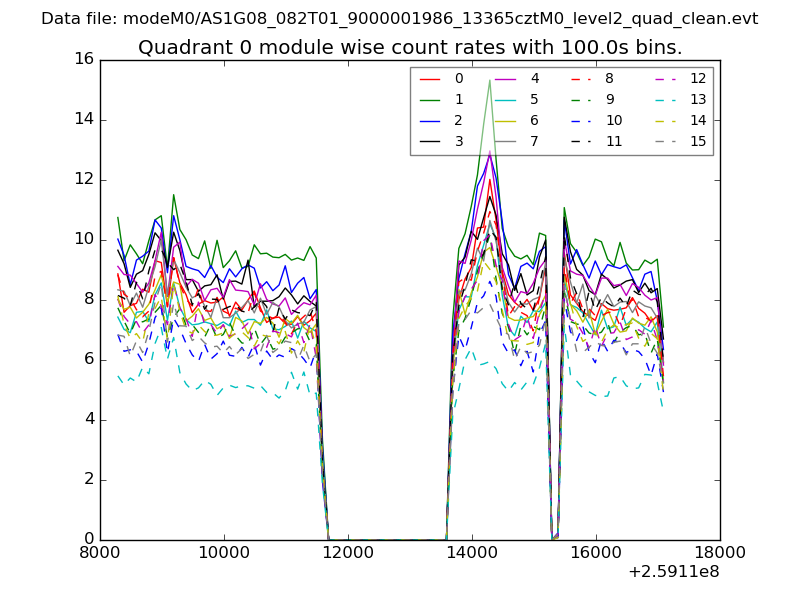 |
 |
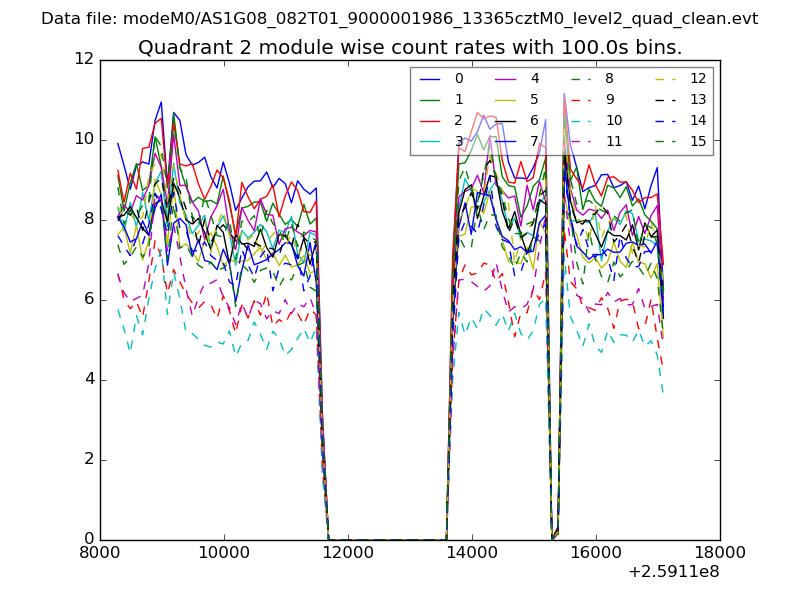
| Module-wise count rates for Quadrant B Data is divided into 100 sec bins |
 |
 |
| Module-wise count rates for Quadrant C Data is divided into 100 sec bins |
 |
 |
| Module-wise count rates for Quadrant D Data is divided into 100 sec bins |
 |
 |
| Parameter | Plot |
|---|---|
| CZT HV Monitor |  |
| D_VDD | 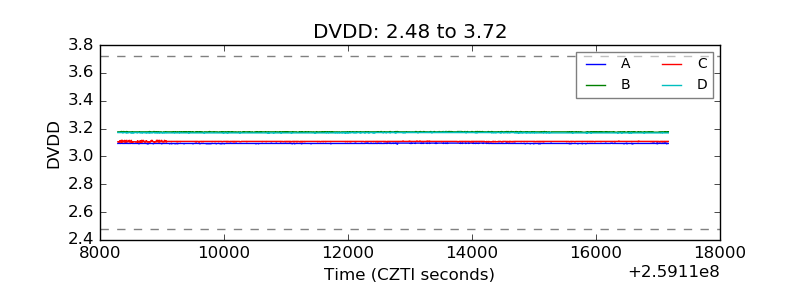 |
| Temperature 1 | 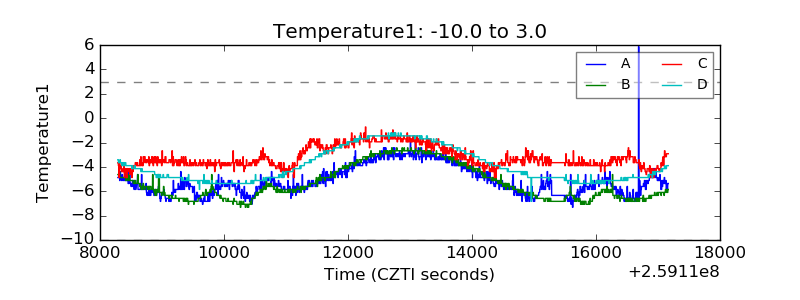 |
| Veto HV Monitor | 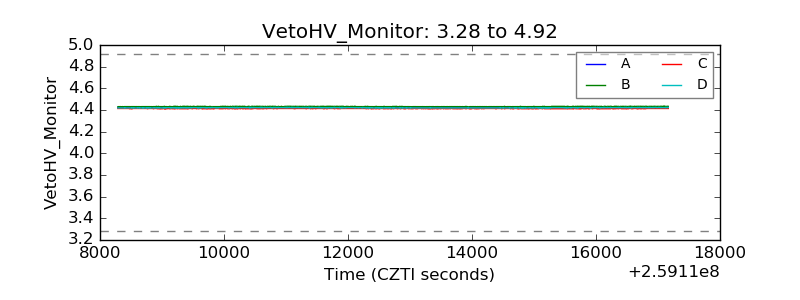 |
| Veto LLD | 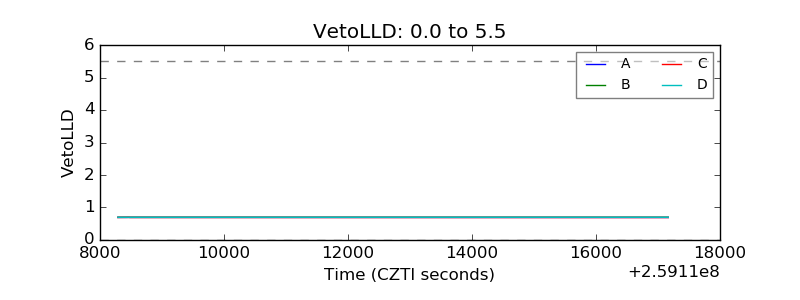 |
| Alpha Counter | 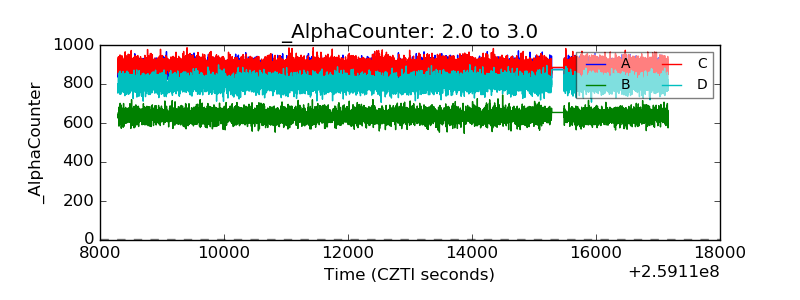 |
| _CPM_Rate | 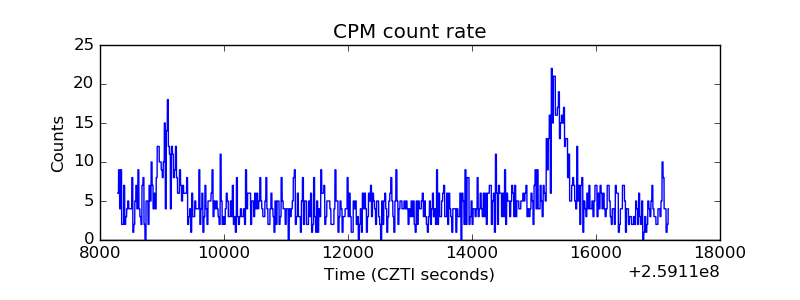 |
| CZT Counter | 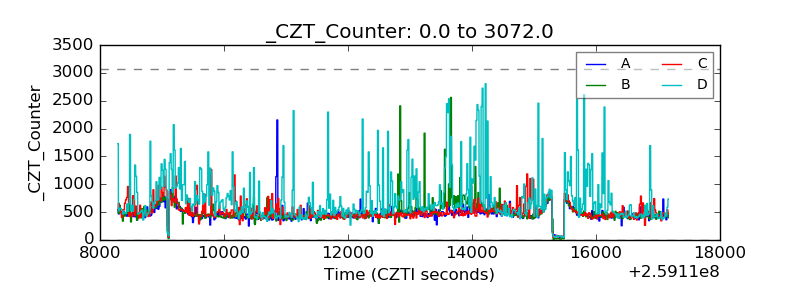 |
| +2.5 Volts monitor |  |
| +5 Volts monitor |  |
| _ROLL_ROT | 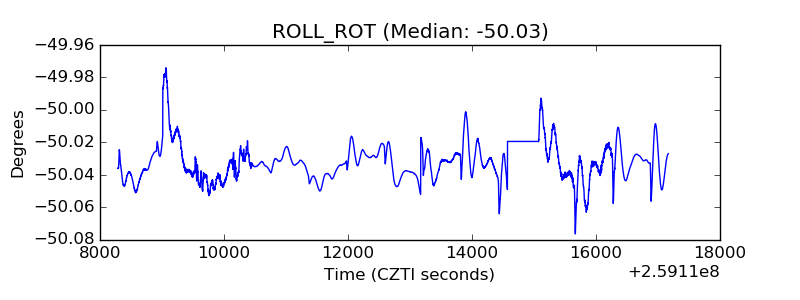 |
| _Roll_DEC | 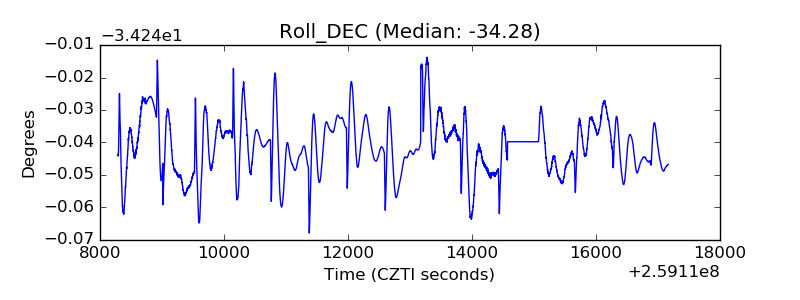 |
| _Roll_RA | 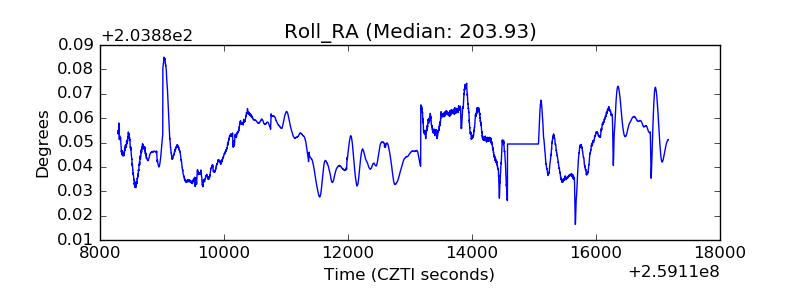 |
| Veto Counter | 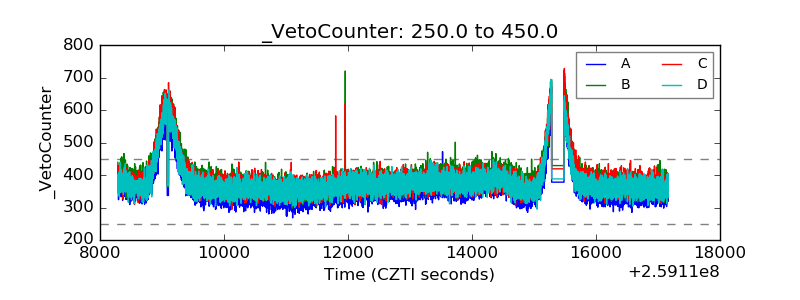 |