| Param | Original file | Final file |
|---|---|---|
| Filename | modeM0/AS1G08_082T01_9000001986_13368cztM0_level2.evt | modeM0/AS1G08_082T01_9000001986_13368cztM0_level2_quad_clean.evt |
| Size (bytes) | 1,092,216,960 | 176,160,960 |
| Size | 1.0 GB | 168.0 MB |
| Events in quadrant A | 7,248,767 | 1,084,534 |
| Events in quadrant B | 7,467,756 | 1,107,930 |
| Events in quadrant C | 7,219,445 | 1,081,977 |
| Events in quadrant D | 10,121,130 | 1,018,666 |
| Mode M9 | |||
|---|---|---|---|
| Quadrant | BADHDUFLAG | Total packets | Discarded packets |
| A | 0 | 12 | 0 |
| B | 0 | 12 | 0 |
| C | 0 | 12 | 0 |
| D | 0 | 12 | 0 |
| Mode M0 | |||
|---|---|---|---|
| Quadrant | BADHDUFLAG | Total packets | Discarded packets |
| A | 0 | 31765 | 4 |
| B | 0 | 32085 | 3 |
| C | 0 | 31370 | 3 |
| D | 0 | 39925 | 3 |
| Mode SS | |||
|---|---|---|---|
| Quadrant | BADHDUFLAG | Total packets | Discarded packets |
| A | 0 | 308 | 0 |
| B | 0 | 308 | 0 |
| C | 0 | 308 | 0 |
| D | 0 | 308 | 0 |
| Quadrant | Total seconds | Saturated seconds | Saturation percentage |
|---|---|---|---|
| A | 15088 | 210 | 1.391835% |
| B | 15088 | 252 | 1.670201% |
| C | 15088 | 164 | 1.086957% |
| D | 15088 | 605 | 4.009809% |
Noise dominated data is calculated using 1-second bins in cleaned event files. If a bin has >2000 counts, and if more than 50% of those come from <1% of pixels, then it is considered to be noise-dominated and hence unusable.
| Quadrant | # 1 sec bins | Bins with >0 counts | Bins with >2000 counts | High rate bins dominated by noise | Noise dominated (total time) | Noise dominated (detector-on time) | Marked lightcurve |
|---|---|---|---|---|---|---|---|
| A | 16344 | 15093 | 30 | 30 | 0.18% | 0.20% | 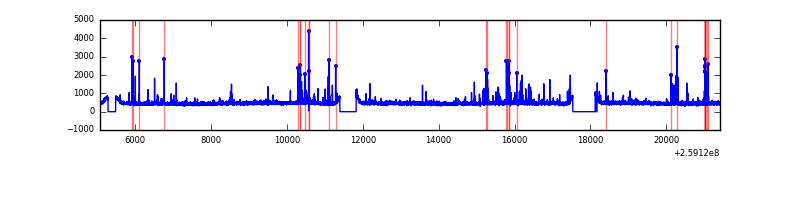 |
| B | 16344 | 15093 | 29 | 29 | 0.18% | 0.19% | 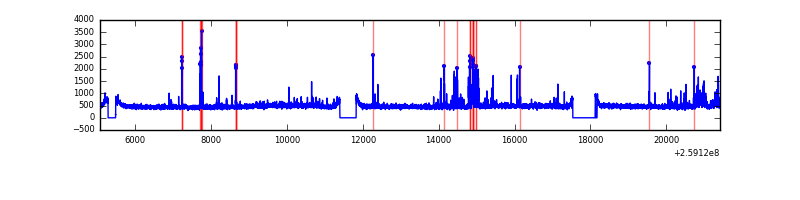 |
| C | 16344 | 15093 | 4 | 4 | 0.02% | 0.03% | 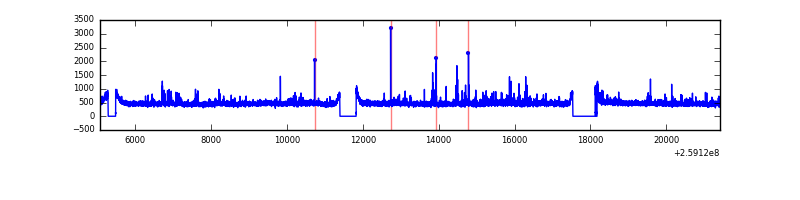 |
| D | 16344 | 15093 | 377 | 377 | 2.31% | 2.50% | 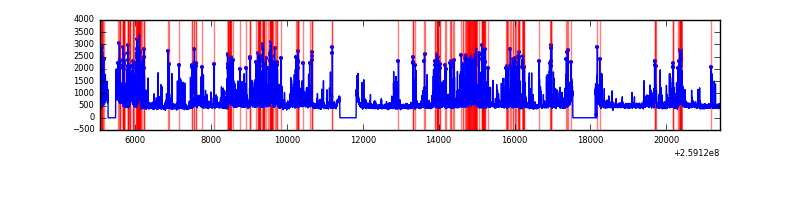 |
Top three noisy pixels from each quadrant. If the there are fewer than three noisy pixels in the level2.evt file, extra rows are filled as -1
| Pixel properties | Quadrant properties | ||||||
|---|---|---|---|---|---|---|---|
| Quadrant | DetID | PixID | Counts | Sigma | Mean | Median | Sigma |
| A | 9 | 143 | 382707 | 1062.77 | 1767 | 1727 | 358.5 |
| A | 1 | 162 | 20917 | 53.53 | 1767 | 1727 | 358.5 |
| A | 4 | 2 | 19745 | 50.26 | 1767 | 1727 | 358.5 |
| B | 3 | 64 | 405366 | 1189.67 | 1773 | 1727 | 339.3 |
| B | 4 | 142 | 40445 | 114.12 | 1773 | 1727 | 339.3 |
| B | 12 | 111 | 39912 | 112.54 | 1773 | 1727 | 339.3 |
| C | 14 | 220 | 290926 | 721.08 | 1737 | 1744 | 401.0 |
| C | 3 | 233 | 146588 | 361.17 | 1737 | 1744 | 401.0 |
| C | 13 | 61 | 12754 | 27.45 | 1737 | 1744 | 401.0 |
| D | 1 | 52 | 2313922 | 5663.78 | 1701 | 1649 | 408.3 |
| D | 14 | 34 | 587829 | 1435.81 | 1701 | 1649 | 408.3 |
| D | 8 | 195 | 585579 | 1430.3 | 1701 | 1649 | 408.3 |
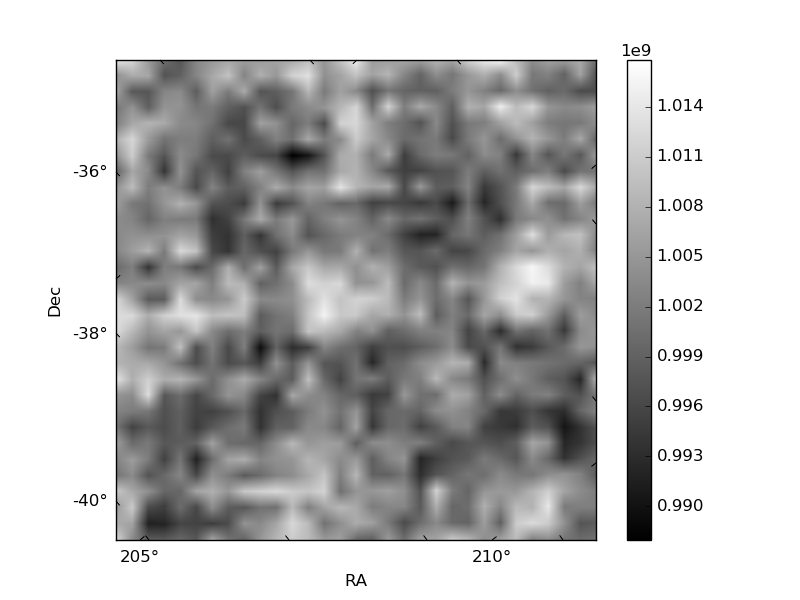
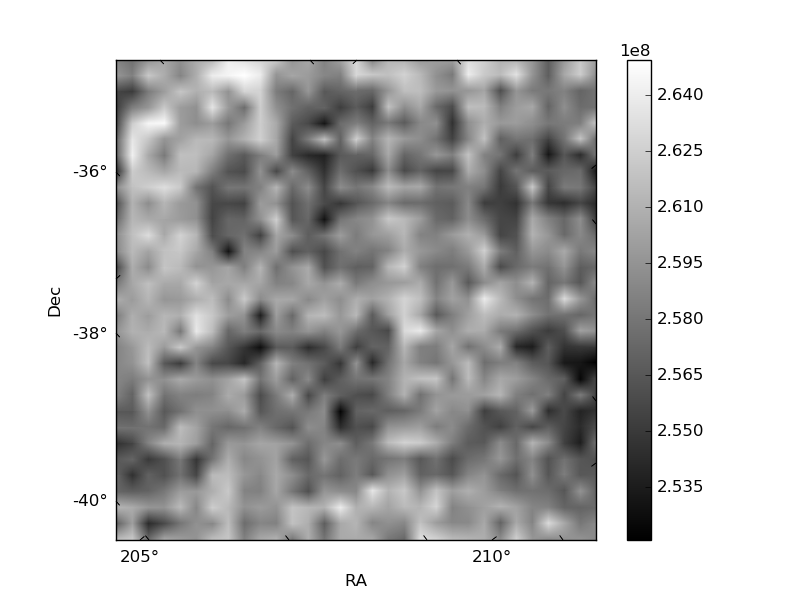
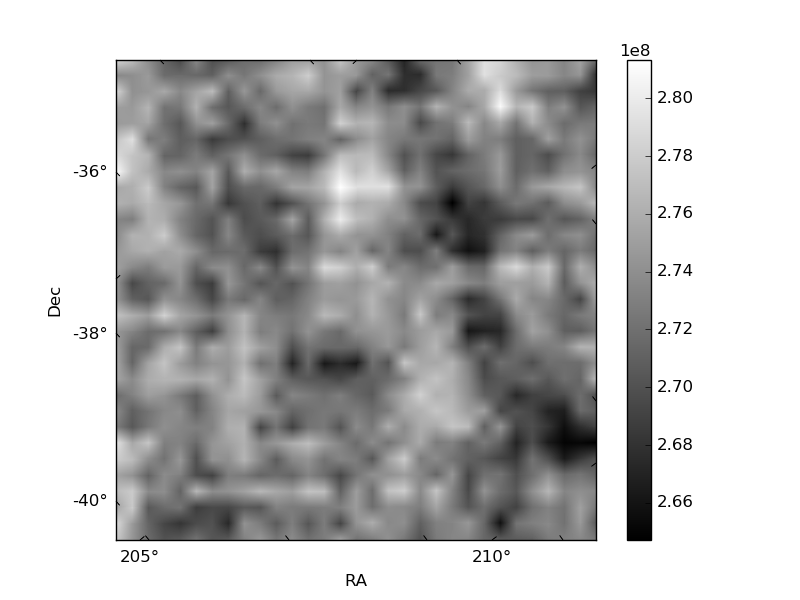
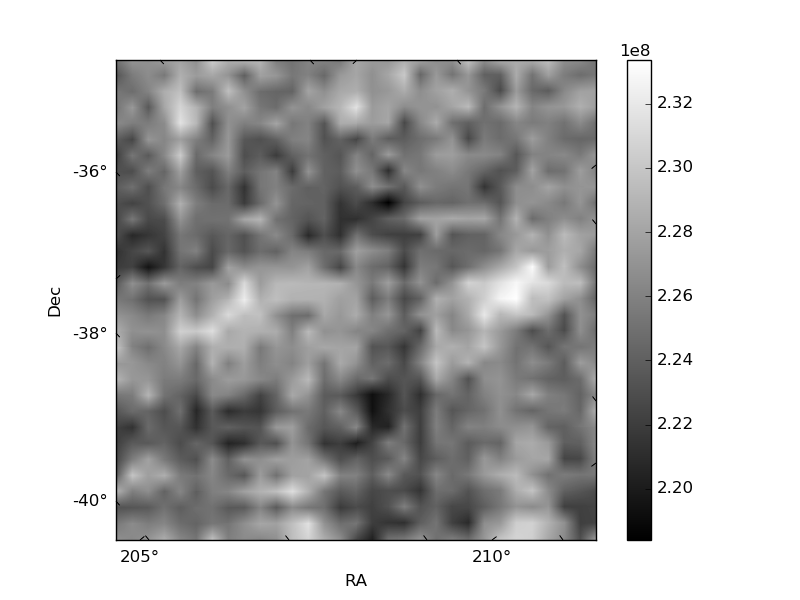
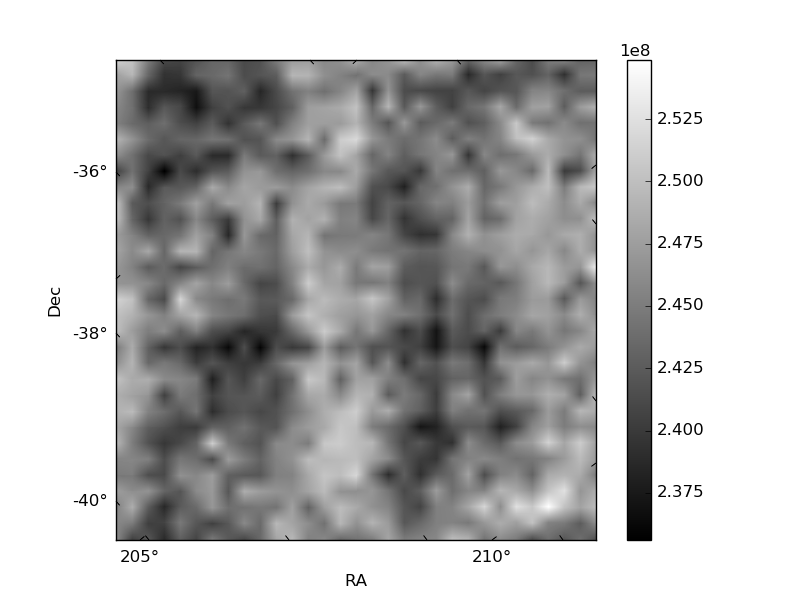
Histogram calculated using DETX and DETY for each event in the final _common_clean file
| Quadrant A | 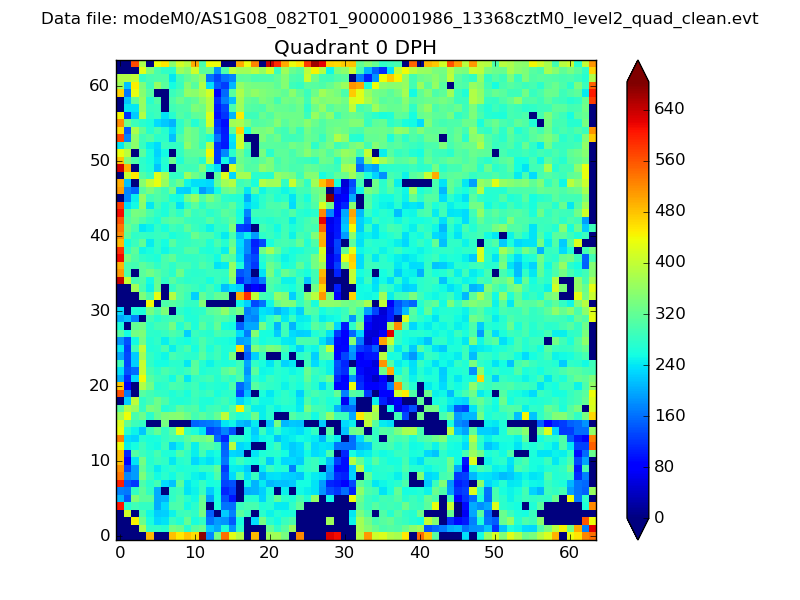 |
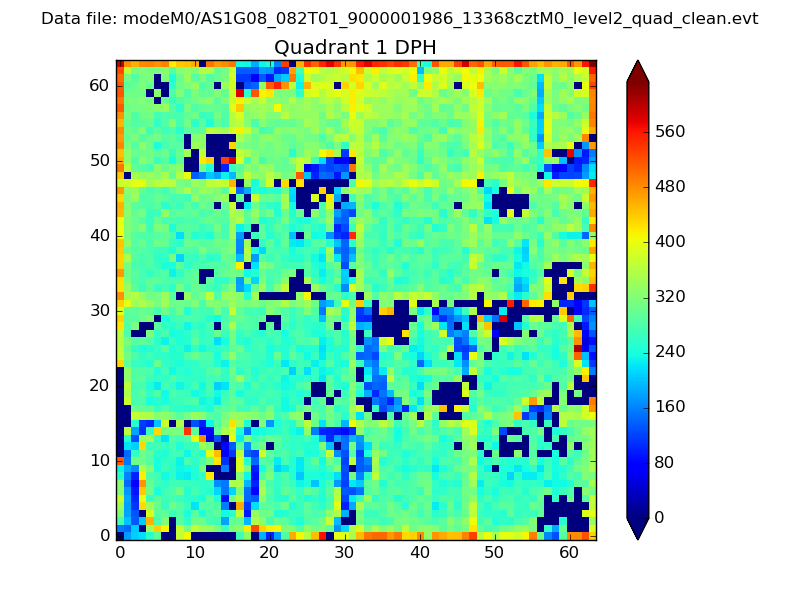 |
Quadrant B |
|---|---|---|---|
| Quadrant D |  |
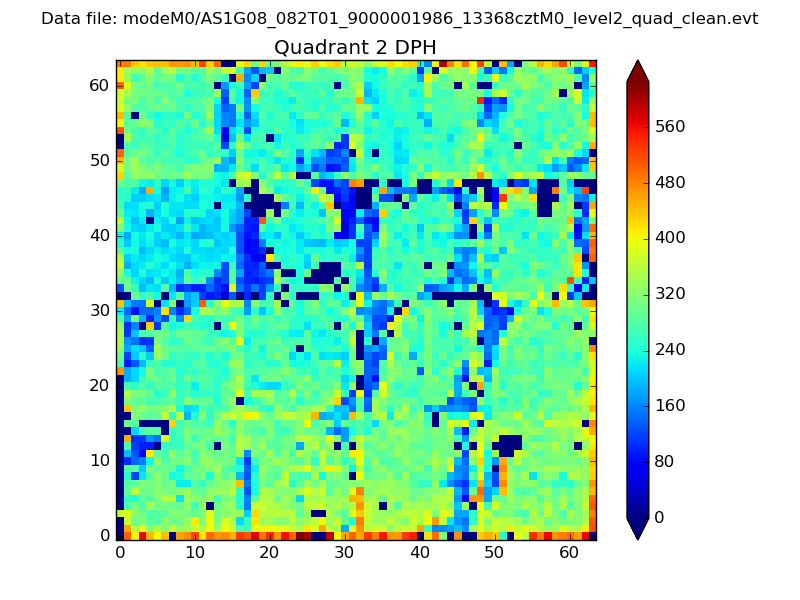 |
Quadrant C |
| Plot type | Count rate plots | Images |
|---|---|---|
| Comparison with Poisson distribution Blue bars denote a histogram of data divided into 1 sec bins. Red curve is a Poisson curve with rate = median count rate of data. |
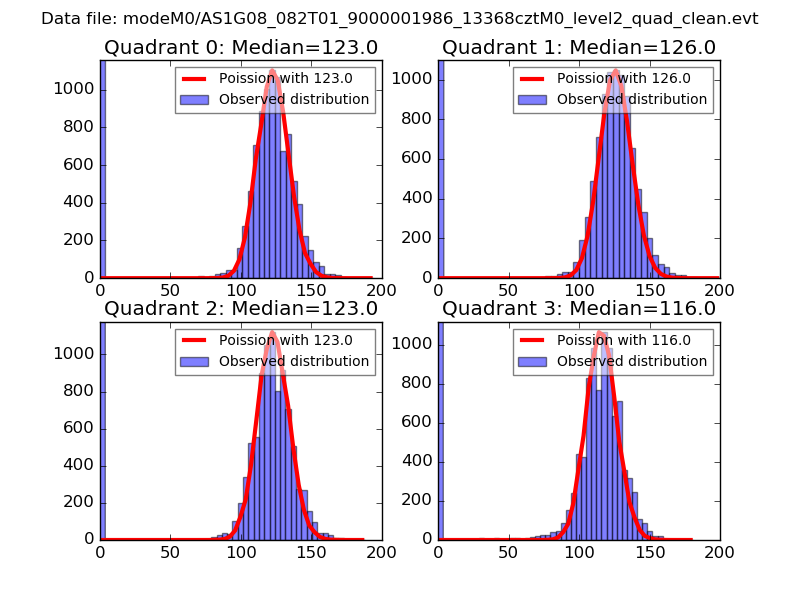 |
 |
| Quadrant-wise count rates Data is divided into 100 sec bins |
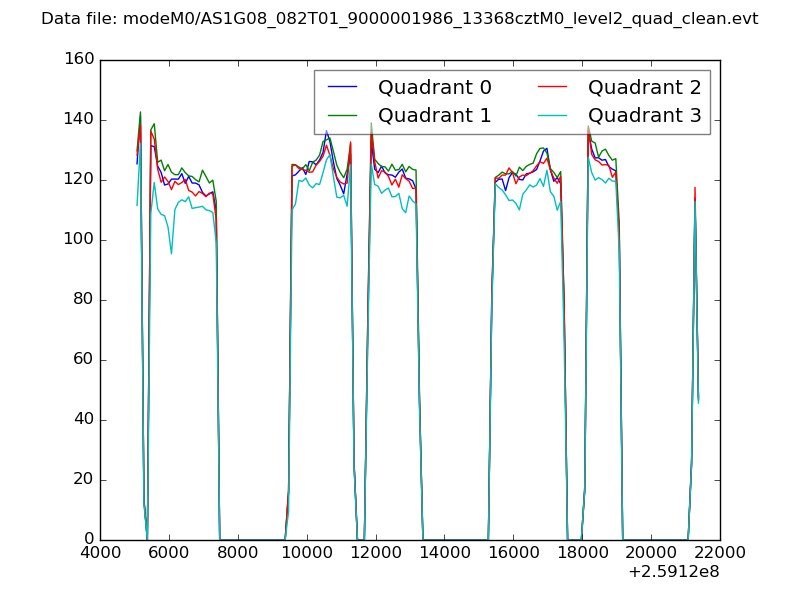 |
|
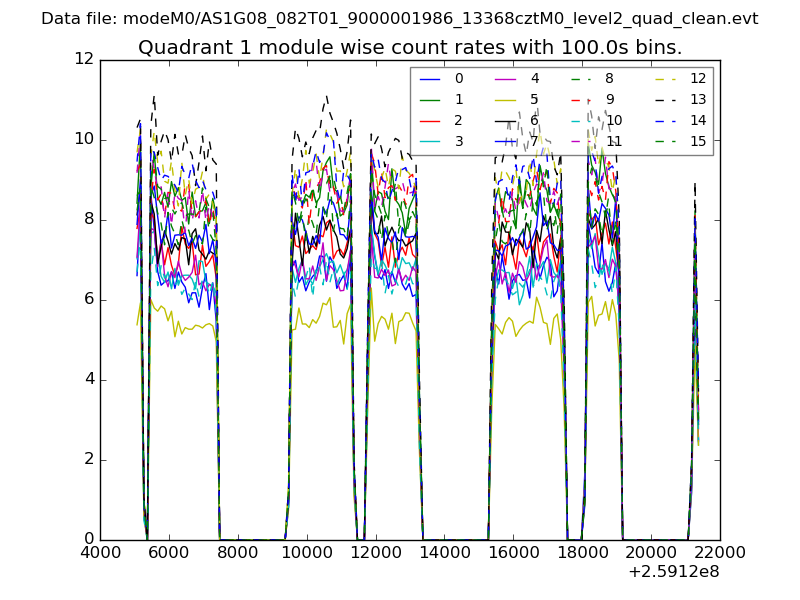
| Module-wise count rates for Quadrant A Data is divided into 100 sec bins |
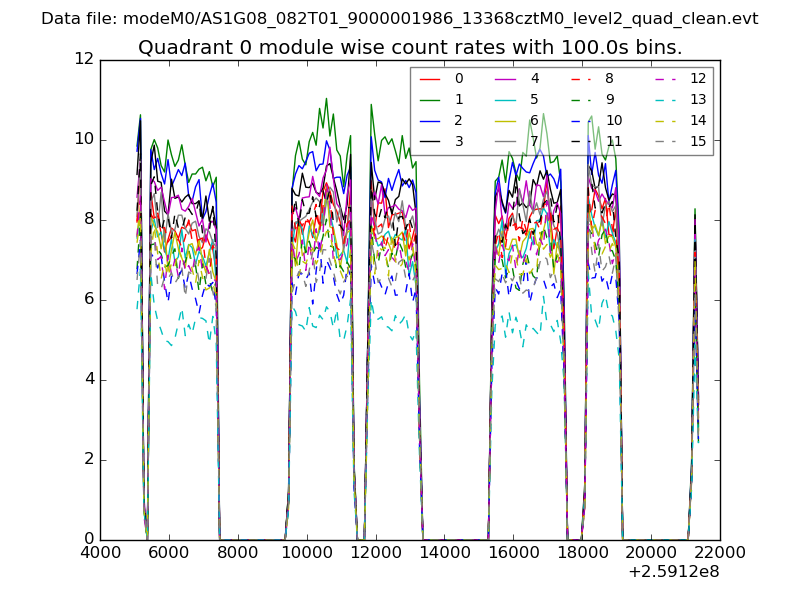 |
 |
| Module-wise count rates for Quadrant B Data is divided into 100 sec bins |
 |
 |
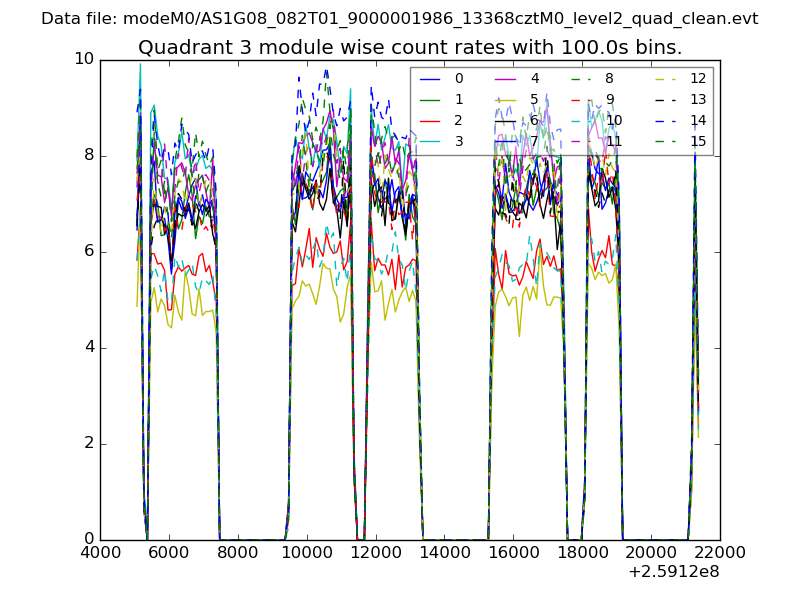
| Module-wise count rates for Quadrant C Data is divided into 100 sec bins |
 |
 |
| Module-wise count rates for Quadrant D Data is divided into 100 sec bins |
 |
 |
| Parameter | Plot |
|---|---|
| CZT HV Monitor | 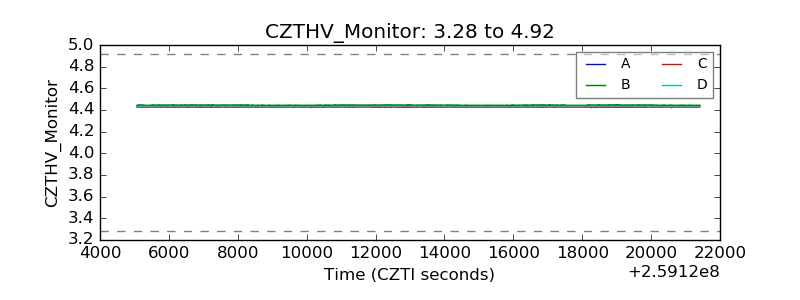 |
| D_VDD | 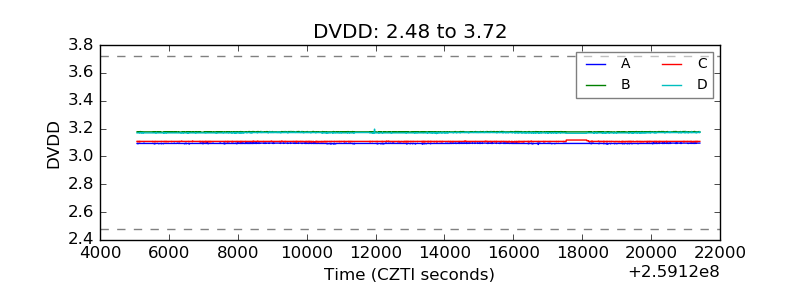 |
| Temperature 1 | 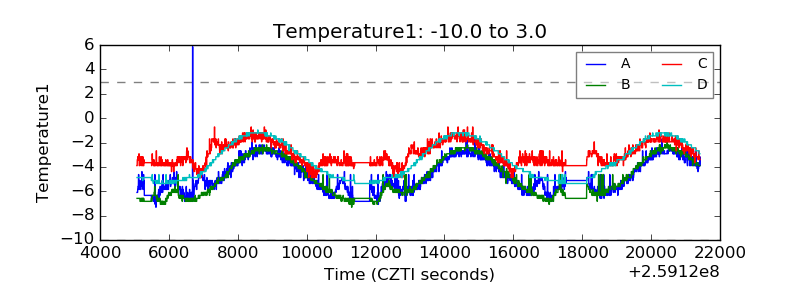 |
| Veto HV Monitor | 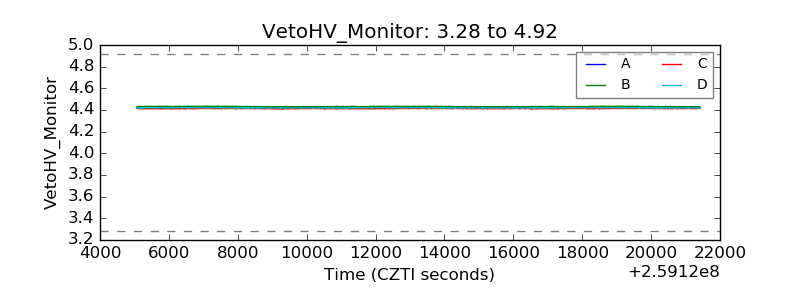 |
| Veto LLD | 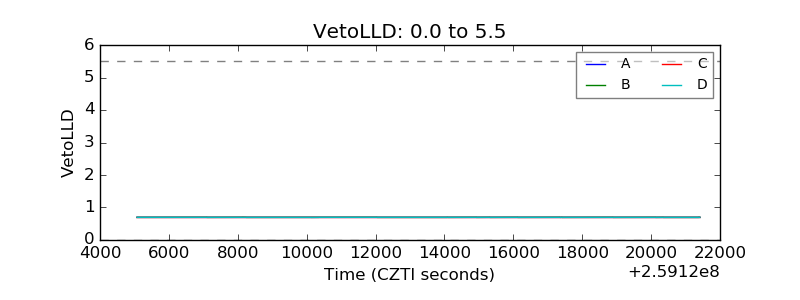 |
| Alpha Counter | 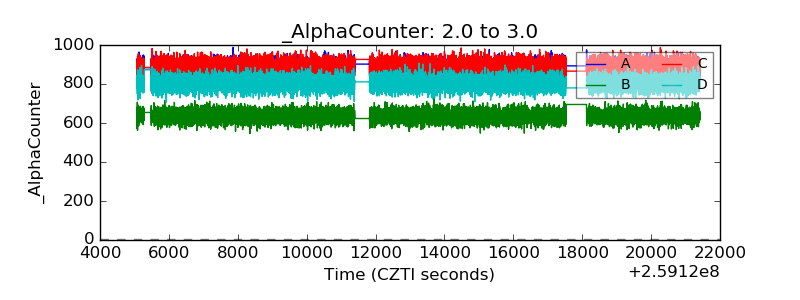 |
| _CPM_Rate | 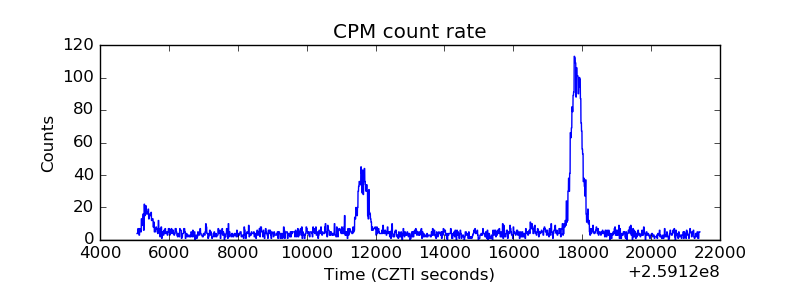 |
| CZT Counter | 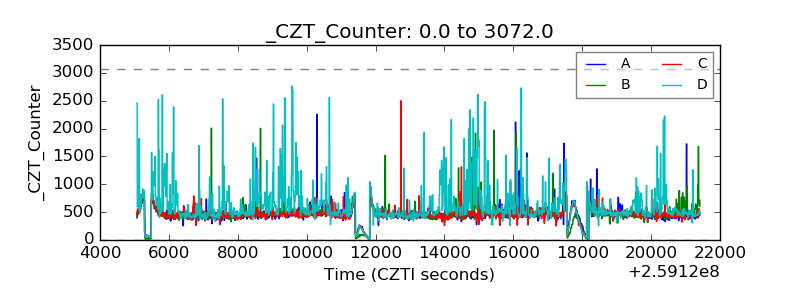 |
| +2.5 Volts monitor |  |
| +5 Volts monitor |  |
| _ROLL_ROT | 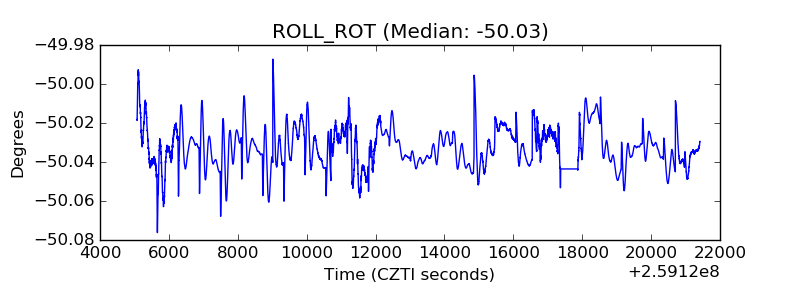 |
| _Roll_DEC | 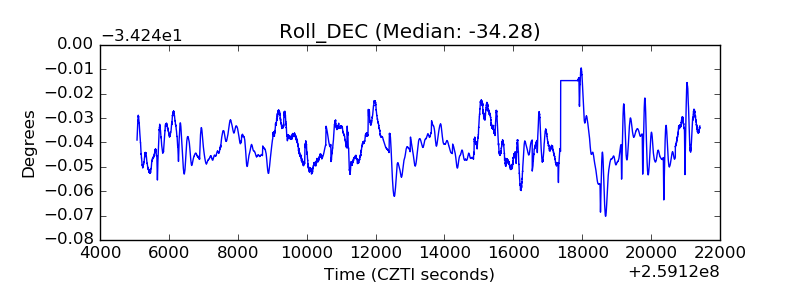 |
| _Roll_RA | 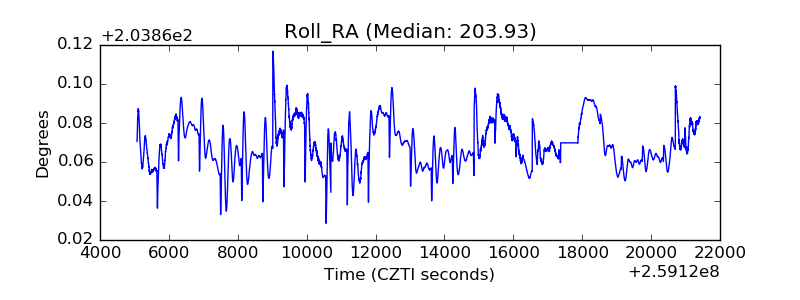 |
| Veto Counter |  |