| Param | Original file | Final file |
|---|---|---|
| Filename | modeM0/AS1G08_082T01_9000001986_13369cztM0_level2.evt | modeM0/AS1G08_082T01_9000001986_13369cztM0_level2_quad_clean.evt |
| Size (bytes) | 739,581,120 | 116,254,080 |
| Size | 705.3 MB | 110.9 MB |
| Events in quadrant A | 5,122,869 | 710,621 |
| Events in quadrant B | 5,477,832 | 723,512 |
| Events in quadrant C | 4,950,981 | 715,288 |
| Events in quadrant D | 6,168,497 | 676,930 |
| Mode M9 | |||
|---|---|---|---|
| Quadrant | BADHDUFLAG | Total packets | Discarded packets |
| A | 0 | 17 | 0 |
| B | 0 | 17 | 0 |
| C | 0 | 17 | 0 |
| D | 0 | 17 | 0 |
| Mode M0 | |||
|---|---|---|---|
| Quadrant | BADHDUFLAG | Total packets | Discarded packets |
| A | 0 | 21802 | 3 |
| B | 0 | 22654 | 2 |
| C | 0 | 21203 | 2 |
| D | 0 | 24775 | 2 |
| Mode SS | |||
|---|---|---|---|
| Quadrant | BADHDUFLAG | Total packets | Discarded packets |
| A | 0 | 204 | 0 |
| B | 0 | 204 | 0 |
| C | 0 | 204 | 0 |
| D | 0 | 204 | 0 |
| Quadrant | Total seconds | Saturated seconds | Saturation percentage |
|---|---|---|---|
| A | 10015 | 237 | 2.366450% |
| B | 10015 | 238 | 2.376435% |
| C | 10015 | 121 | 1.208188% |
| D | 10015 | 261 | 2.606091% |
Noise dominated data is calculated using 1-second bins in cleaned event files. If a bin has >2000 counts, and if more than 50% of those come from <1% of pixels, then it is considered to be noise-dominated and hence unusable.
| Quadrant | # 1 sec bins | Bins with >0 counts | Bins with >2000 counts | High rate bins dominated by noise | Noise dominated (total time) | Noise dominated (detector-on time) | Marked lightcurve |
|---|---|---|---|---|---|---|---|
| A | 11741 | 10018 | 60 | 60 | 0.51% | 0.60% | 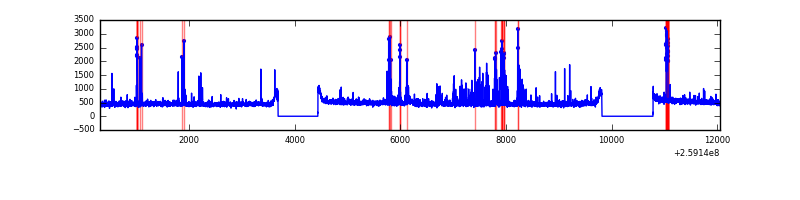 |
| B | 11741 | 10018 | 77 | 77 | 0.66% | 0.77% | 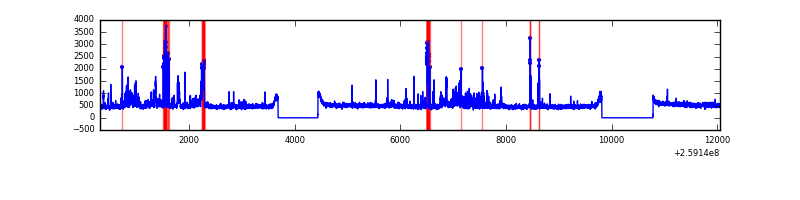 |
| C | 11741 | 10018 | 1 | 1 | 0.01% | 0.01% | 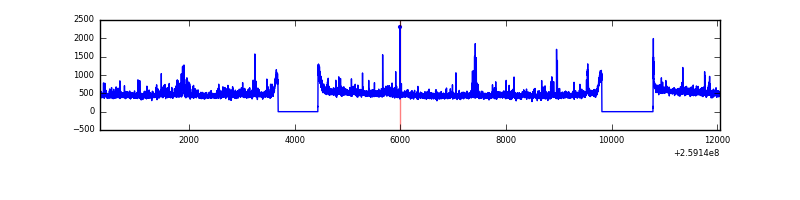 |
| D | 11741 | 10018 | 115 | 115 | 0.98% | 1.15% | 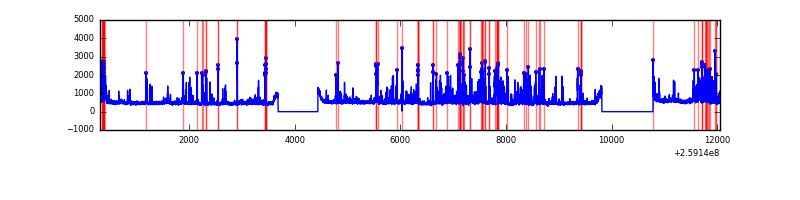 |
Top three noisy pixels from each quadrant. If the there are fewer than three noisy pixels in the level2.evt file, extra rows are filled as -1
| Pixel properties | Quadrant properties | ||||||
|---|---|---|---|---|---|---|---|
| Quadrant | DetID | PixID | Counts | Sigma | Mean | Median | Sigma |
| A | 9 | 143 | 378670 | 1554.84 | 1196 | 1170 | 242.8 |
| A | 1 | 162 | 70742 | 286.55 | 1196 | 1170 | 242.8 |
| A | 1 | 178 | 27771 | 109.56 | 1196 | 1170 | 242.8 |
| B | 3 | 64 | 629396 | 2745.7 | 1199 | 1165 | 228.8 |
| B | 0 | 230 | 63552 | 272.66 | 1199 | 1165 | 228.8 |
| B | 10 | 245 | 33435 | 141.04 | 1199 | 1165 | 228.8 |
| C | 14 | 220 | 215006 | 785.1 | 1173 | 1177 | 272.4 |
| C | 3 | 233 | 164584 | 599.97 | 1173 | 1177 | 272.4 |
| C | 13 | 61 | 8533 | 27.01 | 1173 | 1177 | 272.4 |
| D | 1 | 52 | 1043186 | 3733.06 | 1158 | 1122 | 279.1 |
| D | 8 | 195 | 426161 | 1522.65 | 1158 | 1122 | 279.1 |
| D | 14 | 34 | 129094 | 458.44 | 1158 | 1122 | 279.1 |
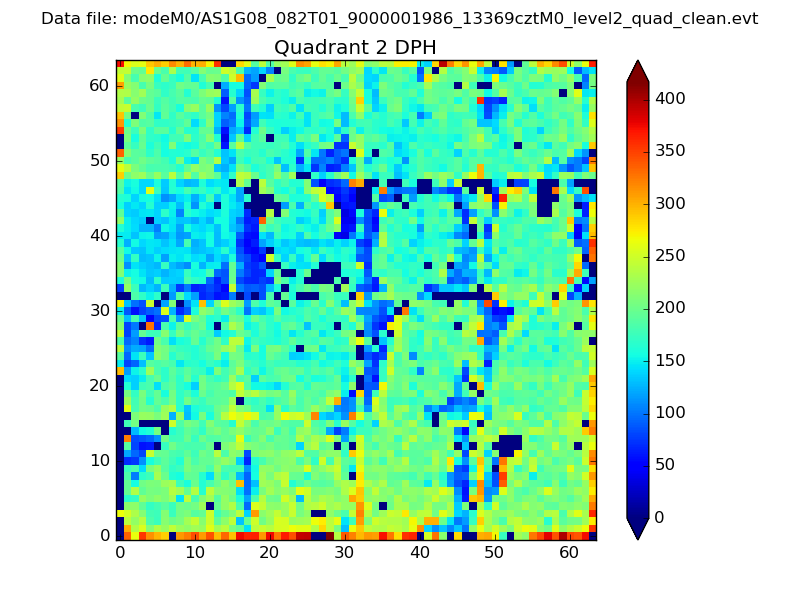
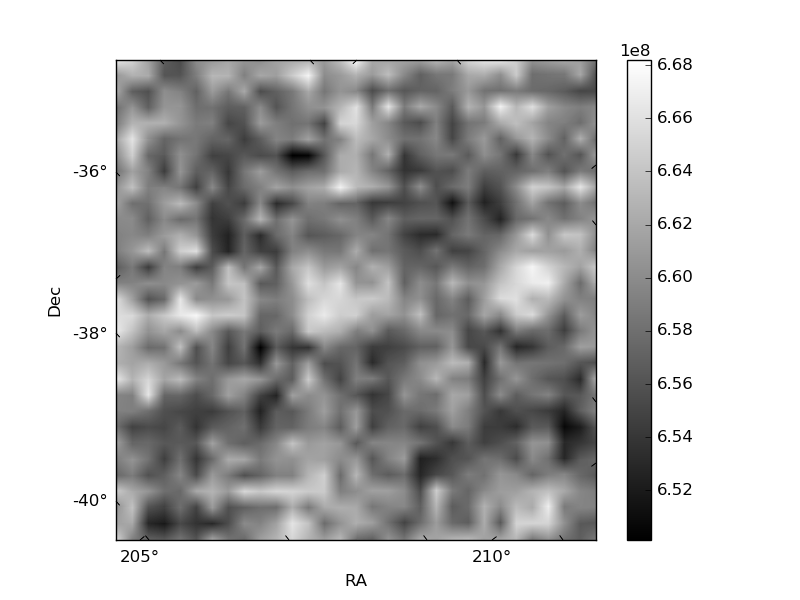
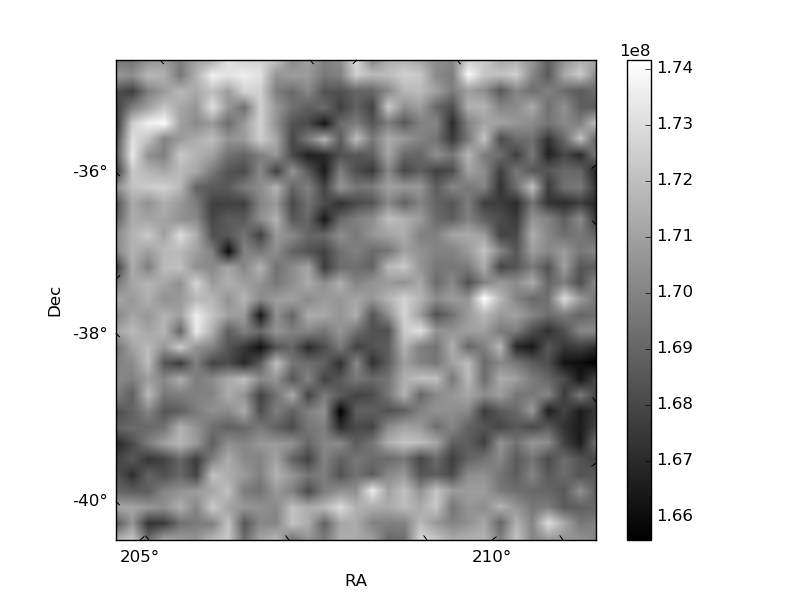
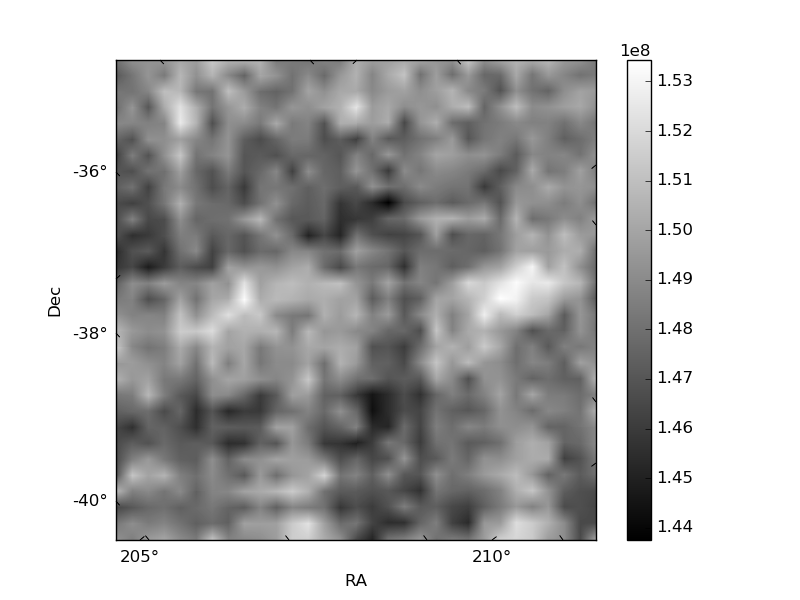
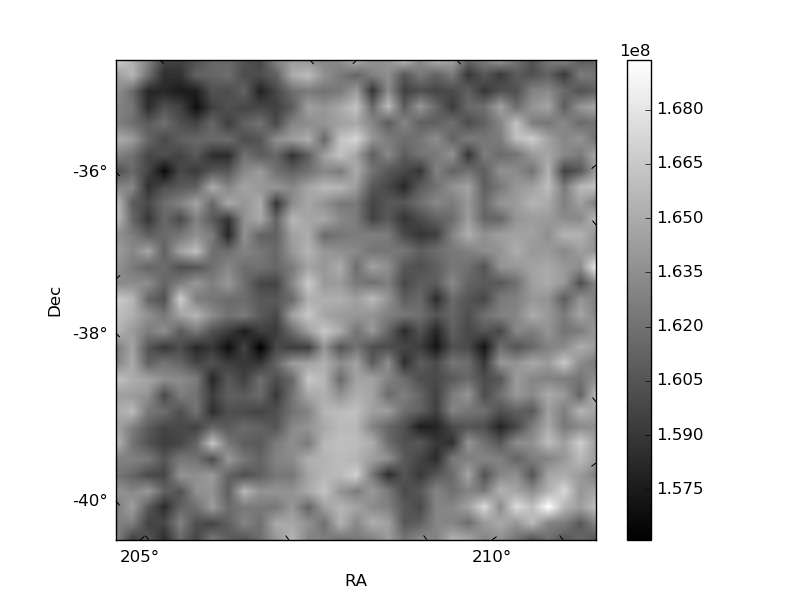
Histogram calculated using DETX and DETY for each event in the final _common_clean file
| Quadrant A | 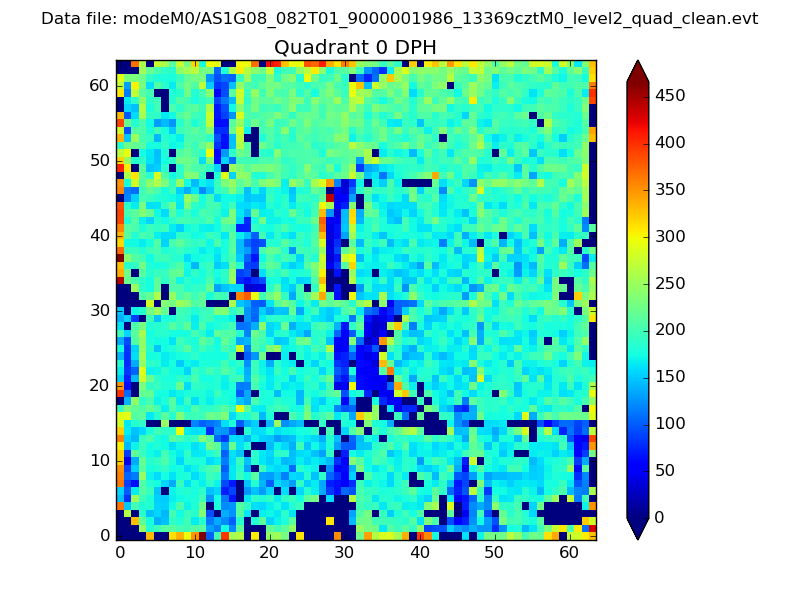 |
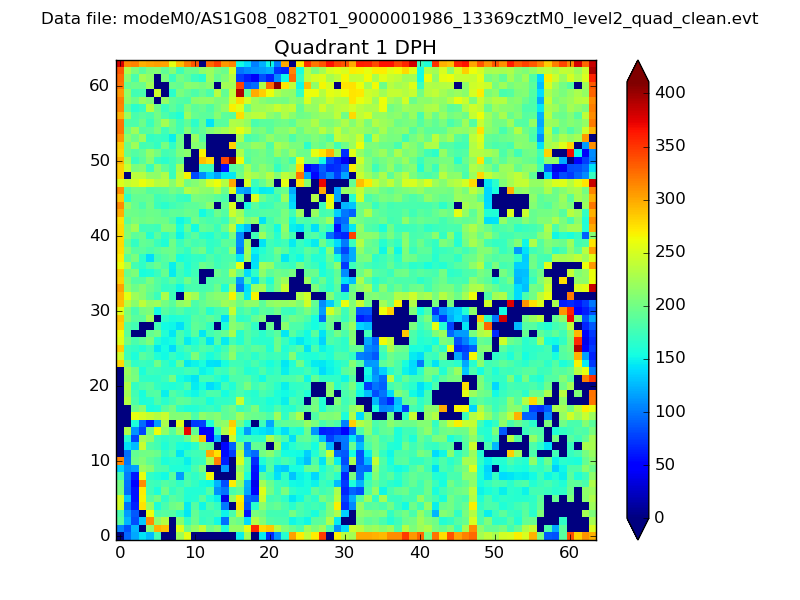 |
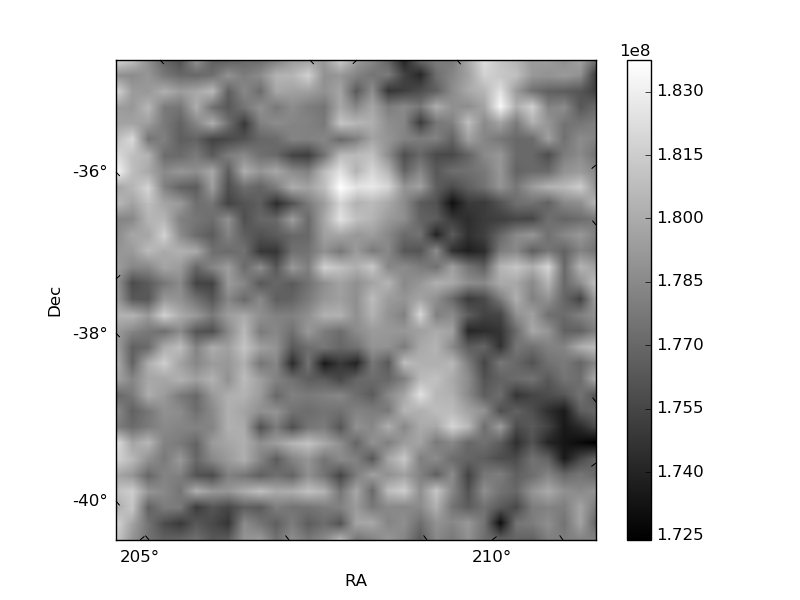
Quadrant B |
|---|---|---|---|
| Quadrant D | 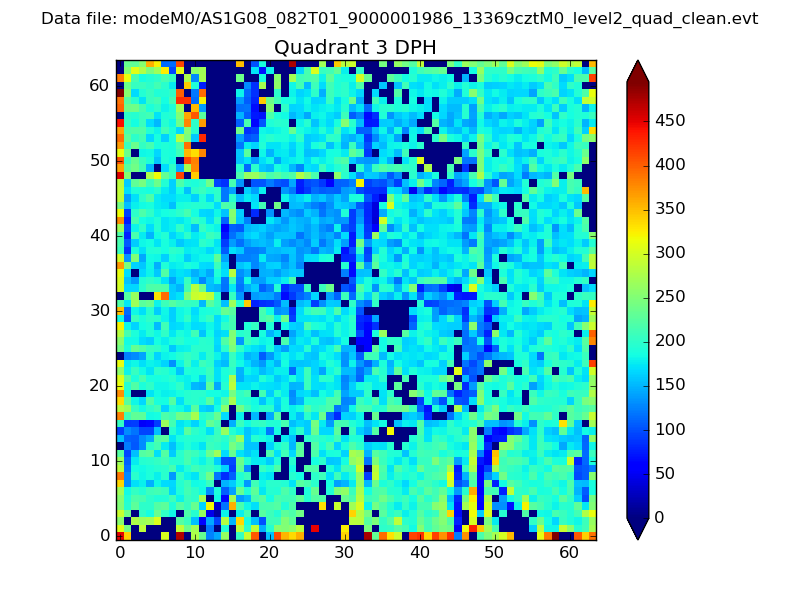 |
 |
Quadrant C |
| Plot type | Count rate plots | Images |
|---|---|---|
| Comparison with Poisson distribution Blue bars denote a histogram of data divided into 1 sec bins. Red curve is a Poisson curve with rate = median count rate of data. |
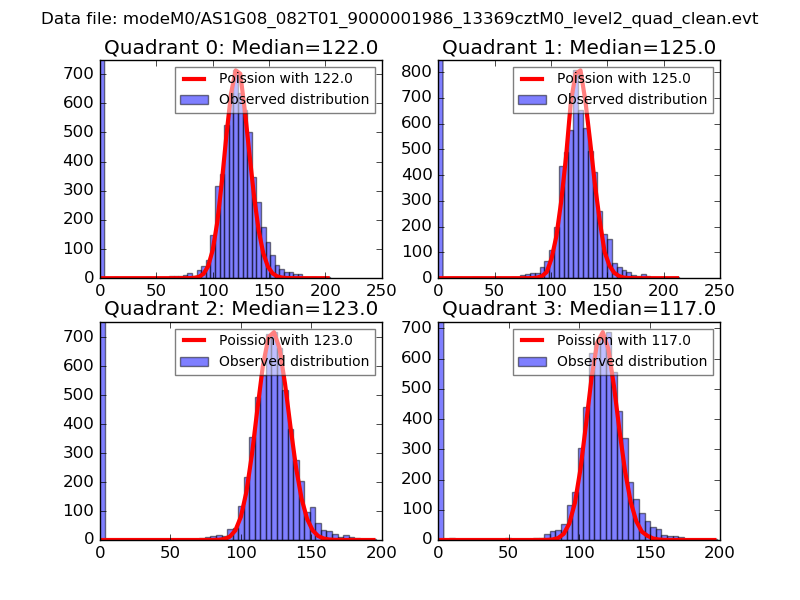 |
 |
| Quadrant-wise count rates Data is divided into 100 sec bins |
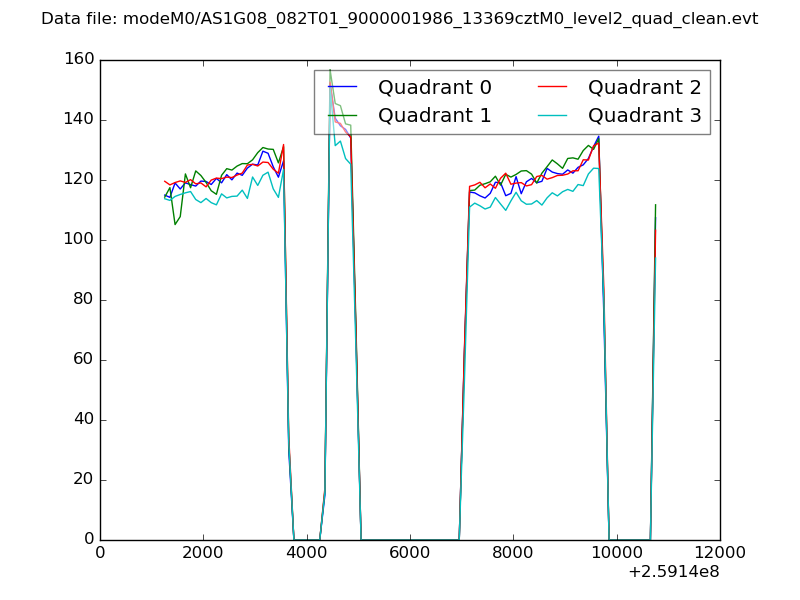 |
|
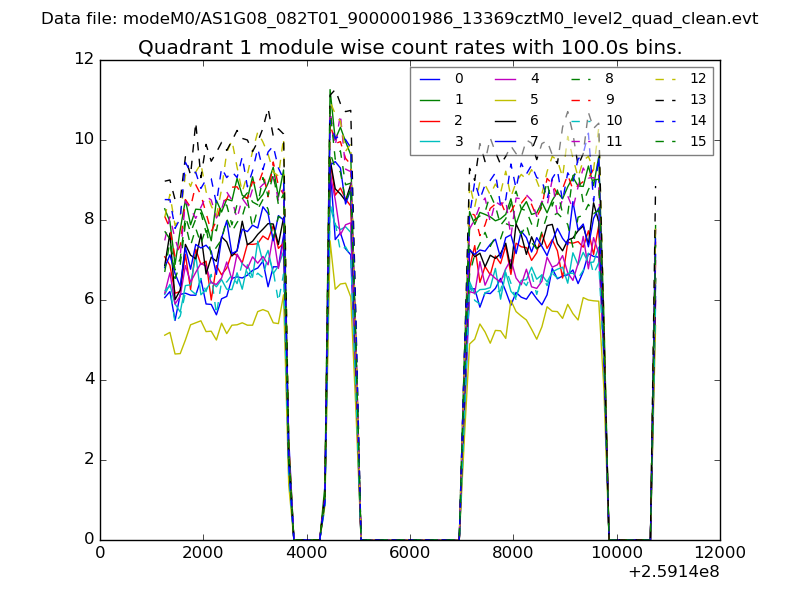
| Module-wise count rates for Quadrant A Data is divided into 100 sec bins |
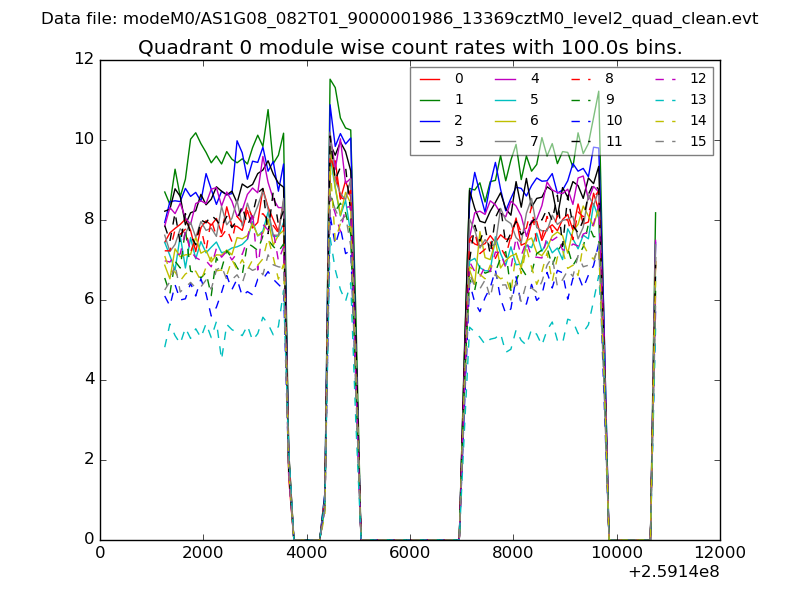 |
 |
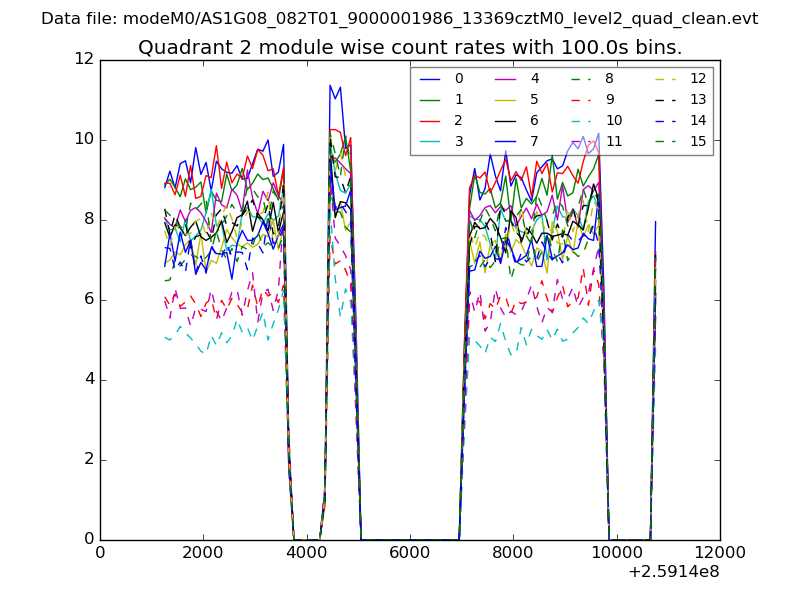
| Module-wise count rates for Quadrant B Data is divided into 100 sec bins |
 |
 |
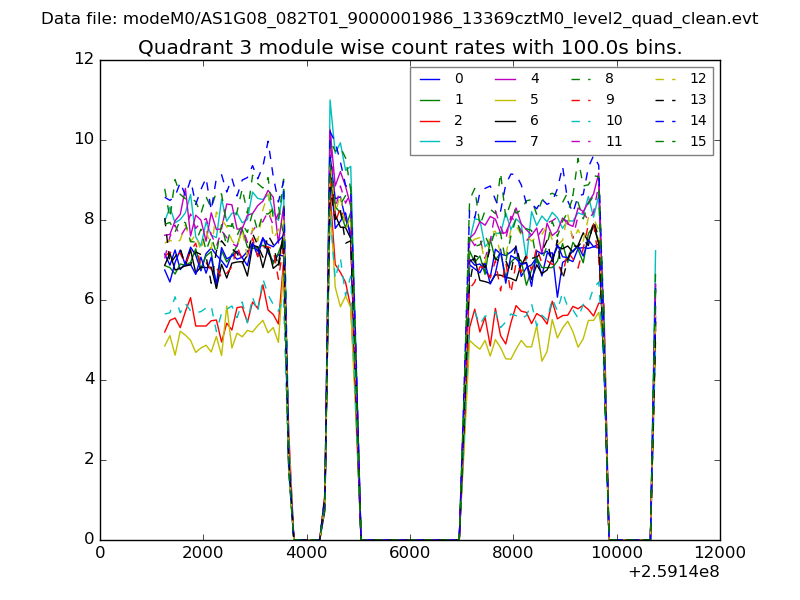
| Module-wise count rates for Quadrant C Data is divided into 100 sec bins |
 |
 |
| Module-wise count rates for Quadrant D Data is divided into 100 sec bins |
 |
 |
| Parameter | Plot |
|---|---|
| CZT HV Monitor | 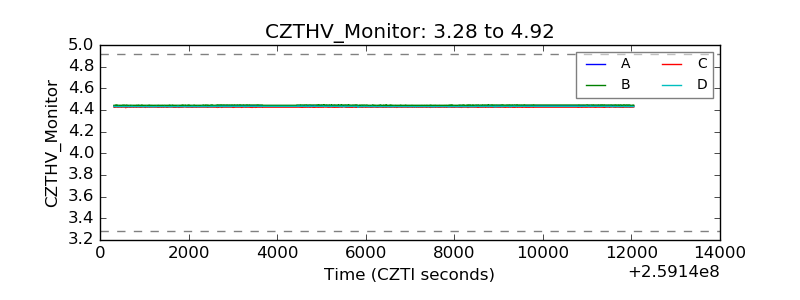 |
| D_VDD | 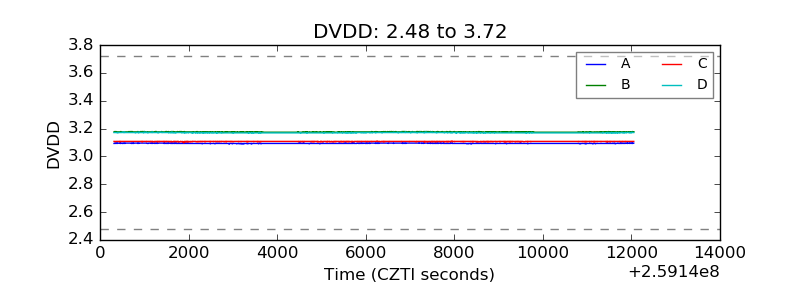 |
| Temperature 1 | 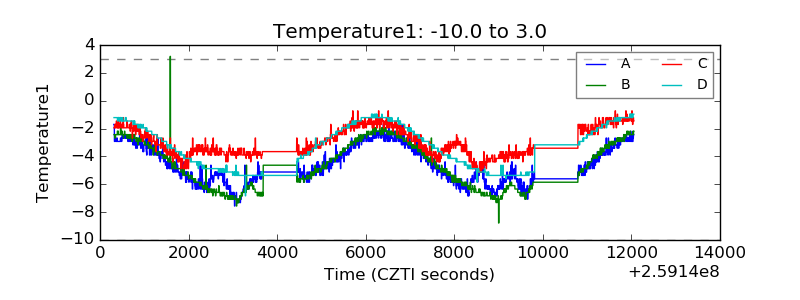 |
| Veto HV Monitor | 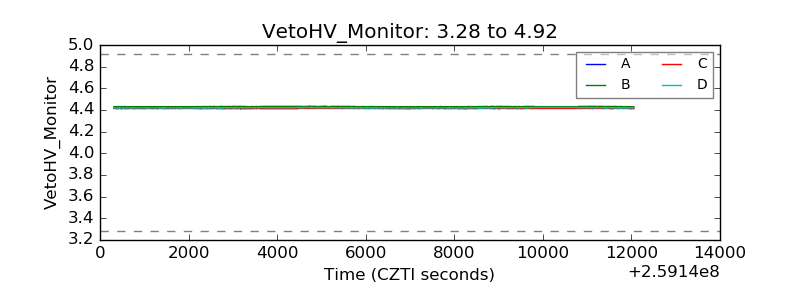 |
| Veto LLD | 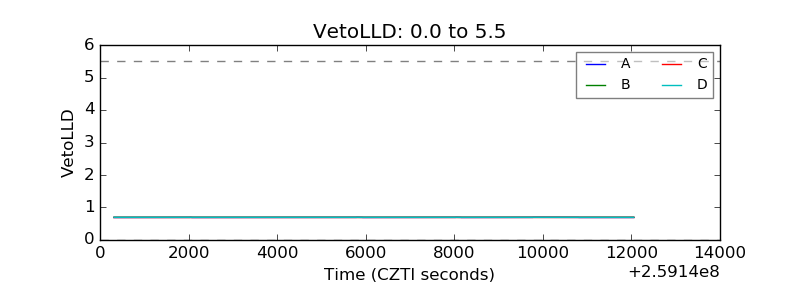 |
| Alpha Counter | 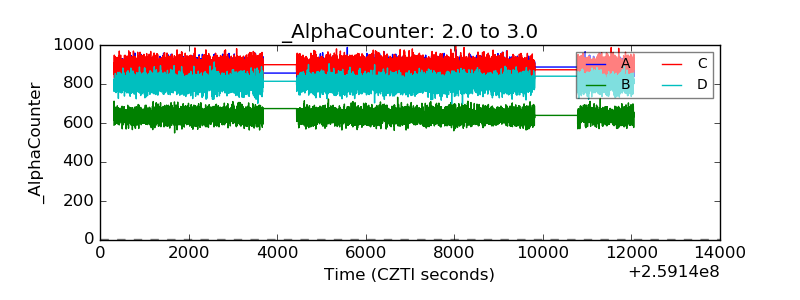 |
| _CPM_Rate | 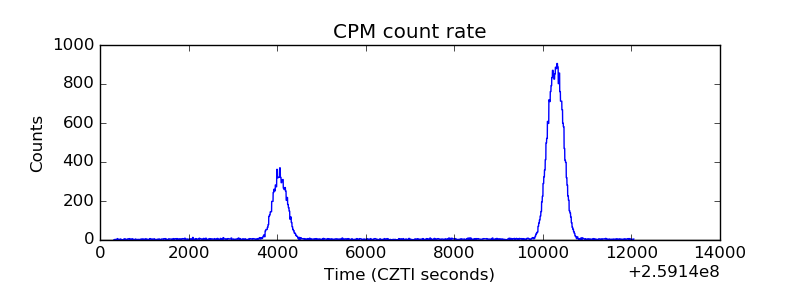 |
| CZT Counter | 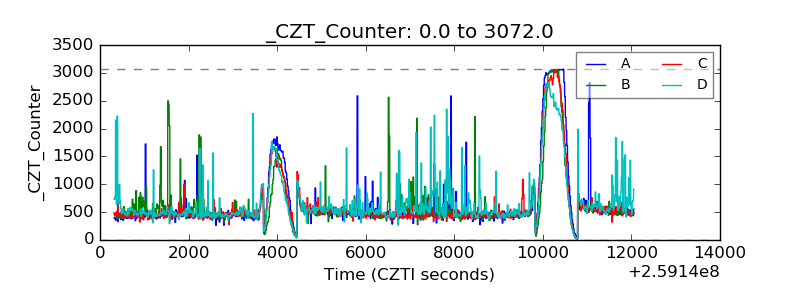 |
| +2.5 Volts monitor |  |
| +5 Volts monitor | 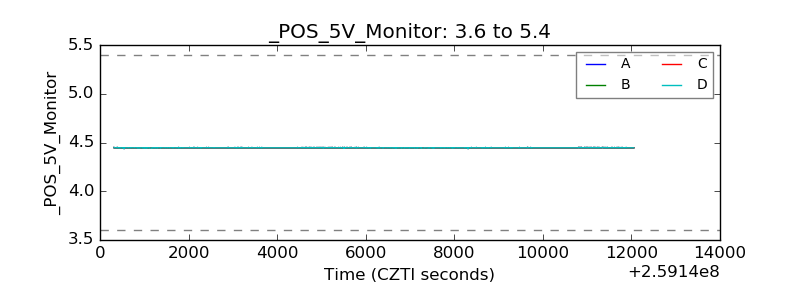 |
| _ROLL_ROT | 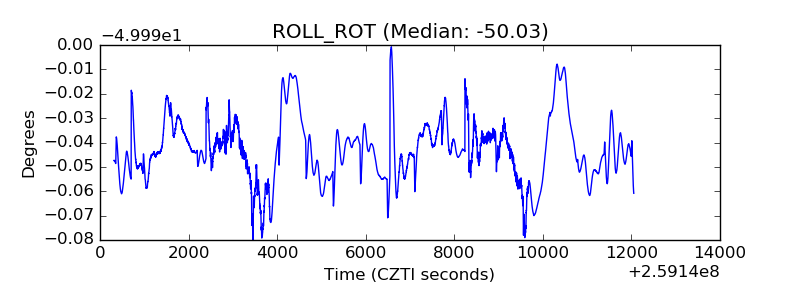 |
| _Roll_DEC | 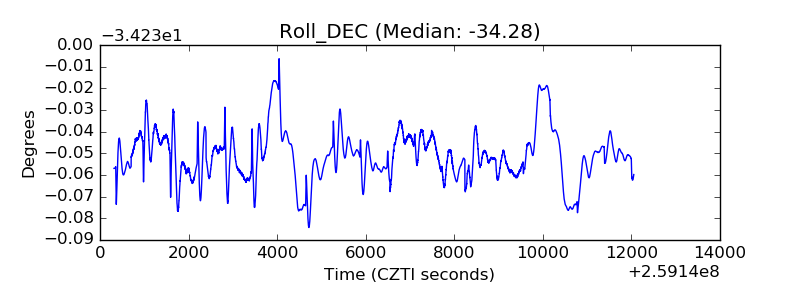 |
| _Roll_RA | 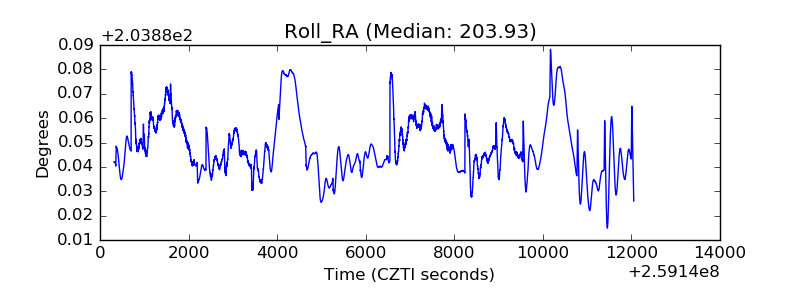 |
| Veto Counter | 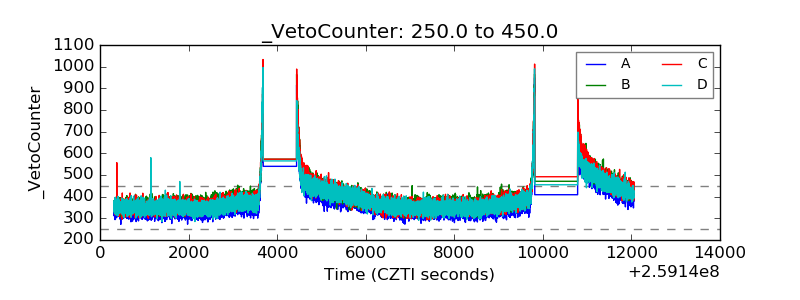 |