| Param | Original file | Final file |
|---|---|---|
| Filename | modeM0/AS1G08_082T01_9000001986_13371cztM0_level2.evt | modeM0/AS1G08_082T01_9000001986_13371cztM0_level2_quad_clean.evt |
| Size (bytes) | 1,311,828,480 | 213,016,320 |
| Size | 1.2 GB | 203.1 MB |
| Events in quadrant A | 8,372,369 | 1,339,813 |
| Events in quadrant B | 8,758,006 | 1,358,128 |
| Events in quadrant C | 8,755,853 | 1,311,487 |
| Events in quadrant D | 12,659,871 | 1,235,037 |
| Mode M9 | |||
|---|---|---|---|
| Quadrant | BADHDUFLAG | Total packets | Discarded packets |
| A | 0 | 7 | 0 |
| B | 0 | 7 | 0 |
| C | 0 | 7 | 0 |
| D | 0 | 7 | 0 |
| Mode M0 | |||
|---|---|---|---|
| Quadrant | BADHDUFLAG | Total packets | Discarded packets |
| A | 0 | 36567 | 4 |
| B | 0 | 37645 | 3 |
| C | 0 | 37474 | 3 |
| D | 0 | 49304 | 3 |
| Mode SS | |||
|---|---|---|---|
| Quadrant | BADHDUFLAG | Total packets | Discarded packets |
| A | 0 | 354 | 0 |
| B | 0 | 354 | 0 |
| C | 0 | 354 | 0 |
| D | 0 | 354 | 0 |
| Quadrant | Total seconds | Saturated seconds | Saturation percentage |
|---|---|---|---|
| A | 17506 | 193 | 1.102479% |
| B | 17506 | 314 | 1.793671% |
| C | 17506 | 230 | 1.313835% |
| D | 17506 | 944 | 5.392437% |
Noise dominated data is calculated using 1-second bins in cleaned event files. If a bin has >2000 counts, and if more than 50% of those come from <1% of pixels, then it is considered to be noise-dominated and hence unusable.
| Quadrant | # 1 sec bins | Bins with >0 counts | Bins with >2000 counts | High rate bins dominated by noise | Noise dominated (total time) | Noise dominated (detector-on time) | Marked lightcurve |
|---|---|---|---|---|---|---|---|
| A | 18157 | 17510 | 18 | 18 | 0.10% | 0.10% | 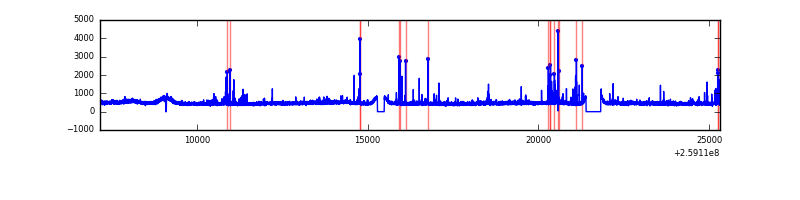 |
| B | 18157 | 17510 | 39 | 39 | 0.21% | 0.22% | 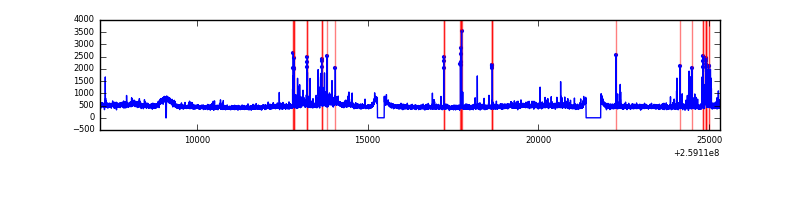 |
| C | 18157 | 17510 | 31 | 31 | 0.17% | 0.18% | 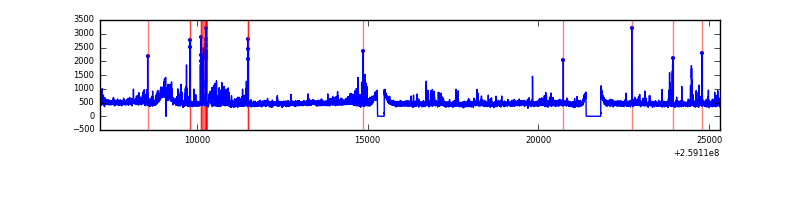 |
| D | 18157 | 17510 | 576 | 576 | 3.17% | 3.29% | 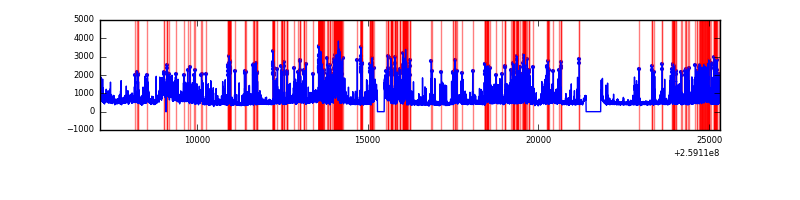 |
Top three noisy pixels from each quadrant. If the there are fewer than three noisy pixels in the level2.evt file, extra rows are filled as -1
| Pixel properties | Quadrant properties | ||||||
|---|---|---|---|---|---|---|---|
| Quadrant | DetID | PixID | Counts | Sigma | Mean | Median | Sigma |
| A | 9 | 143 | 250580 | 585.16 | 2088 | 2037 | 424.7 |
| A | 1 | 162 | 30342 | 66.64 | 2088 | 2037 | 424.7 |
| A | 15 | 69 | 24203 | 52.19 | 2088 | 2037 | 424.7 |
| B | 3 | 64 | 382252 | 956.23 | 2089 | 2034 | 397.6 |
| B | 0 | 189 | 72301 | 176.72 | 2089 | 2034 | 397.6 |
| B | 0 | 230 | 63100 | 153.58 | 2089 | 2034 | 397.6 |
| C | 14 | 220 | 627391 | 1320.75 | 2043 | 2052 | 473.5 |
| C | 3 | 233 | 150021 | 312.52 | 2043 | 2052 | 473.5 |
| C | 13 | 61 | 14999 | 27.34 | 2043 | 2052 | 473.5 |
| D | 1 | 52 | 3554581 | 7383.28 | 1992 | 1930 | 481.2 |
| D | 8 | 195 | 708910 | 1469.28 | 1992 | 1930 | 481.2 |
| D | 9 | 85 | 251240 | 518.13 | 1992 | 1930 | 481.2 |
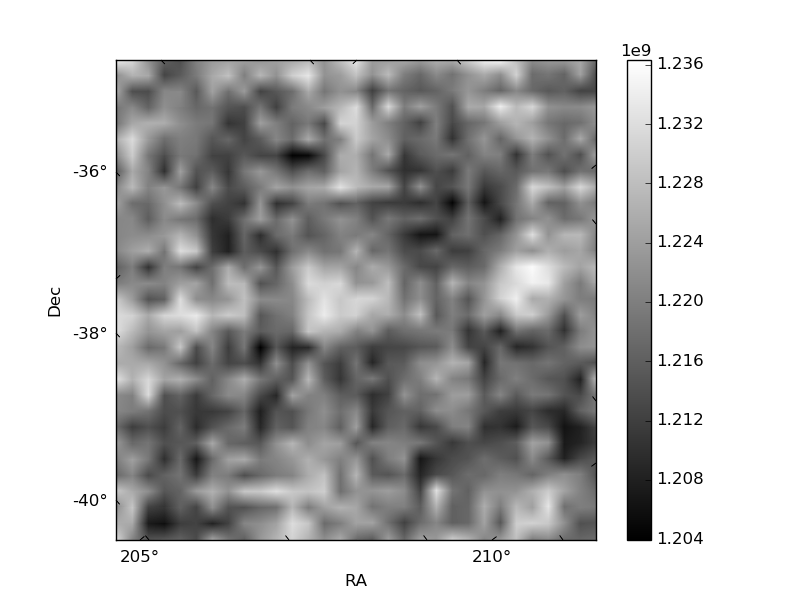
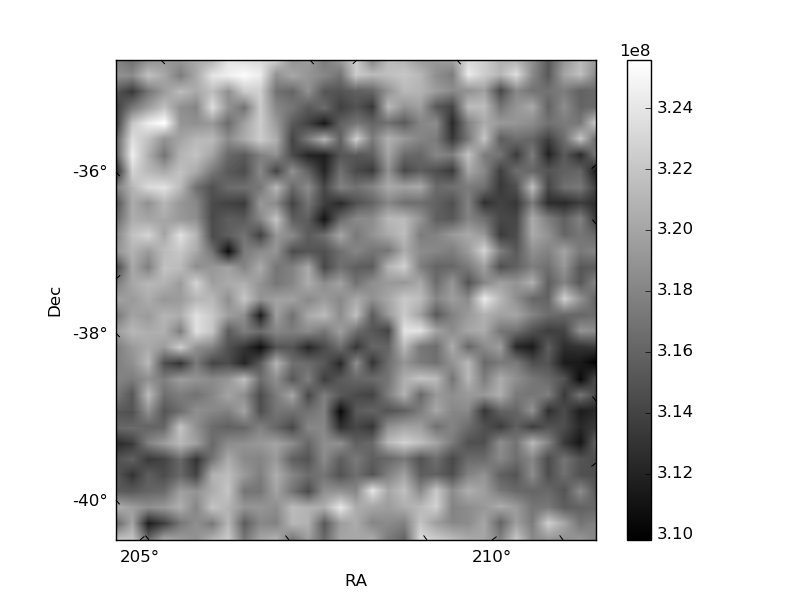
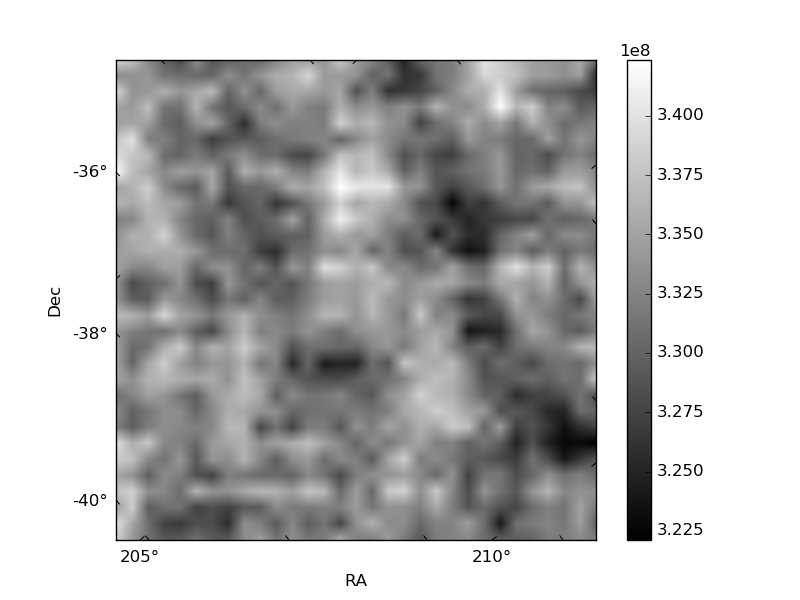
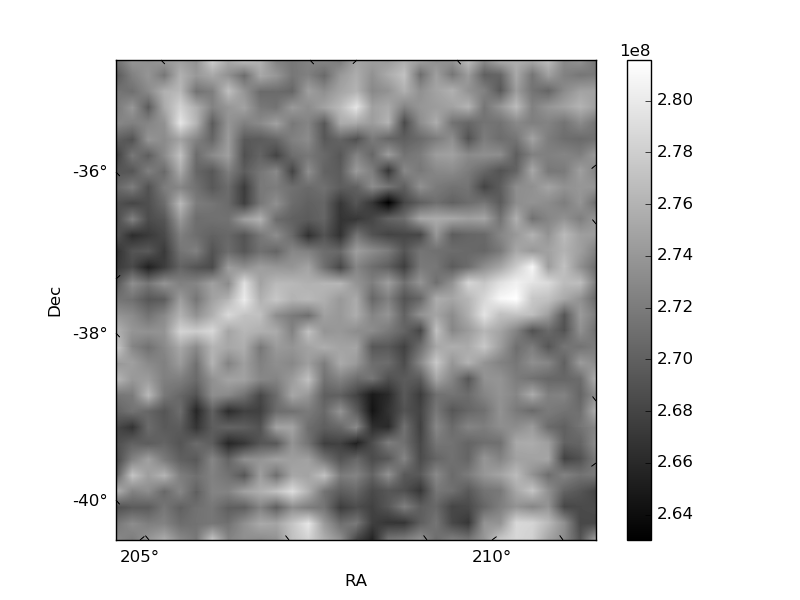
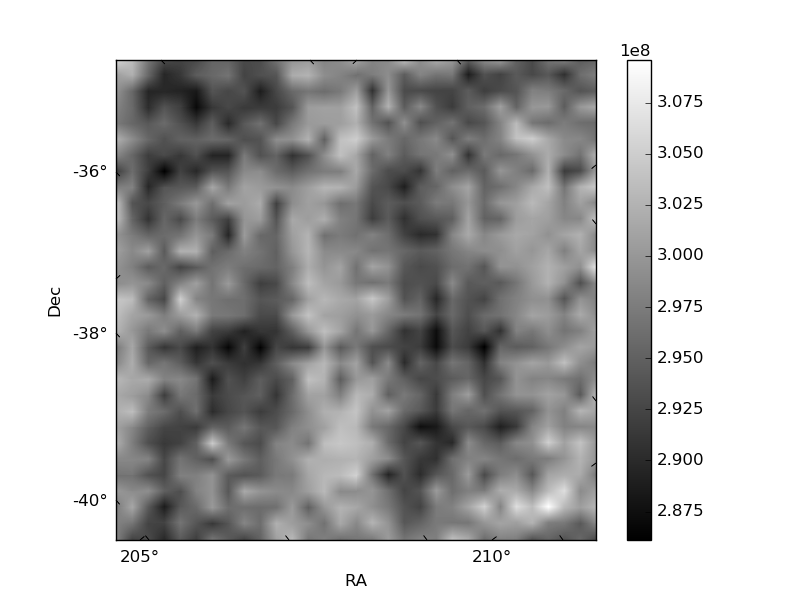
Histogram calculated using DETX and DETY for each event in the final _common_clean file
| Quadrant A | 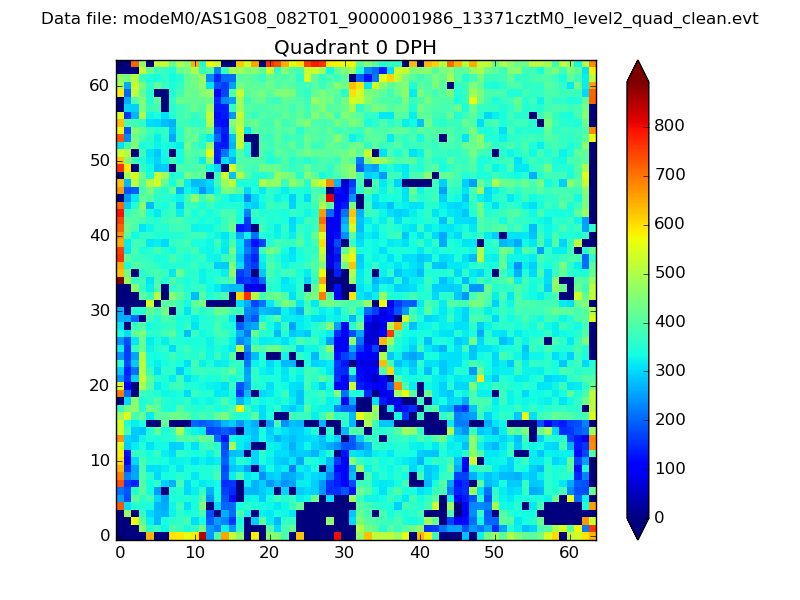 |
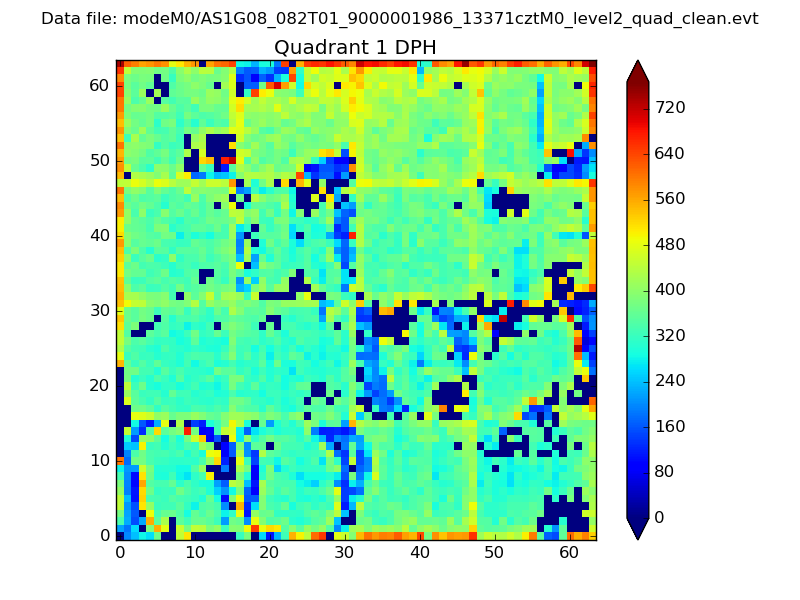 |
Quadrant B |
|---|---|---|---|
| Quadrant D | 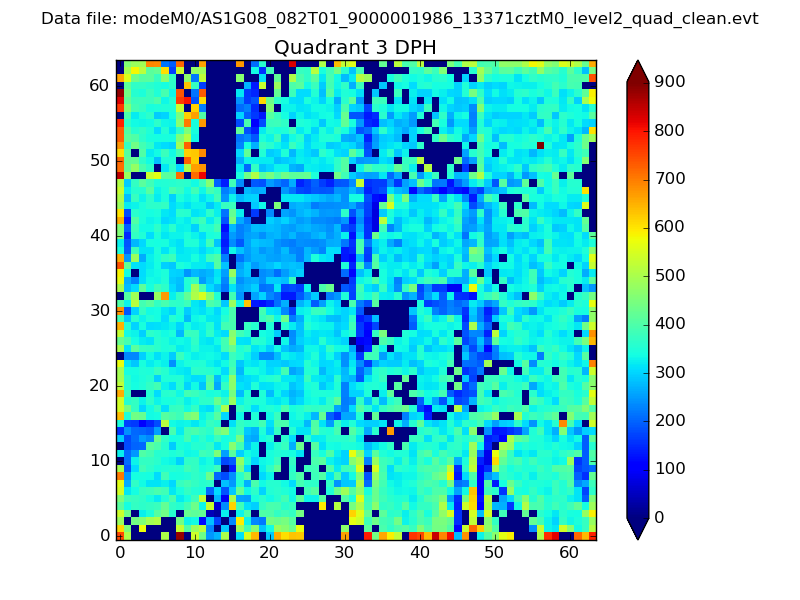 |
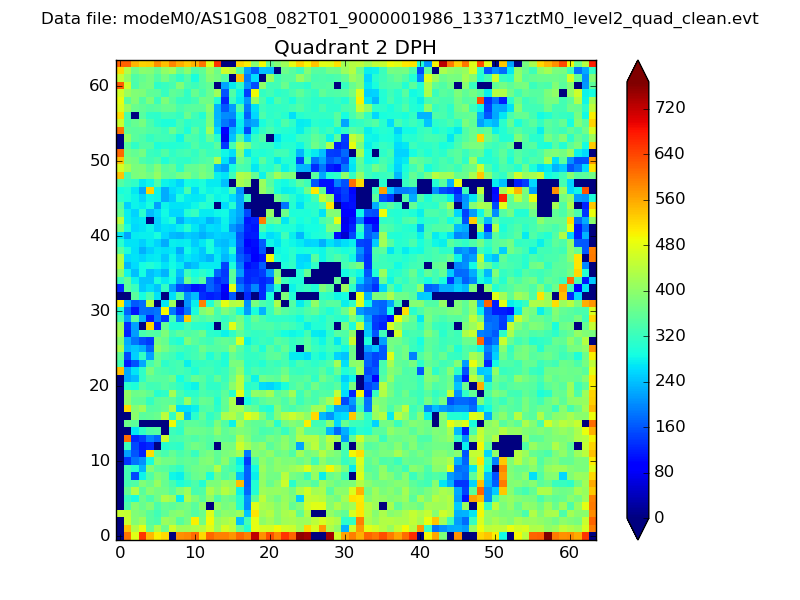 |
Quadrant C |
| Plot type | Count rate plots | Images |
|---|---|---|
| Comparison with Poisson distribution Blue bars denote a histogram of data divided into 1 sec bins. Red curve is a Poisson curve with rate = median count rate of data. |
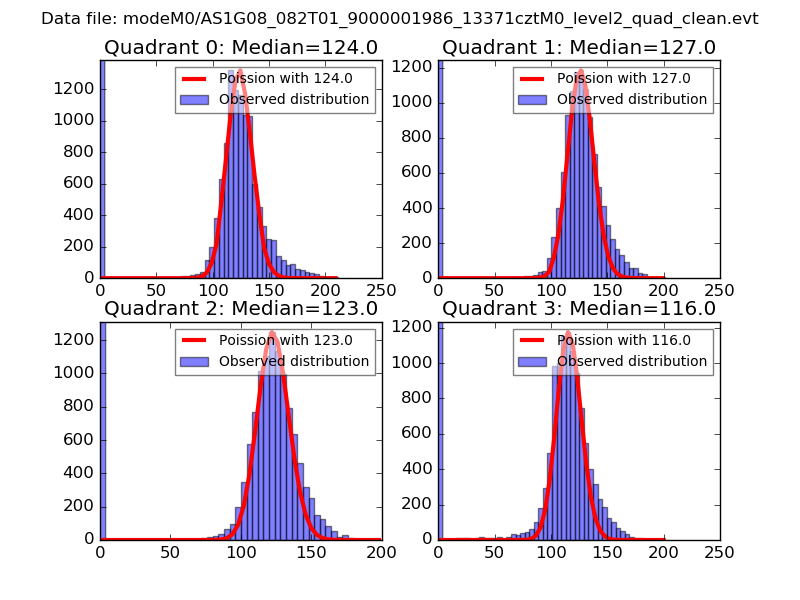 |
 |
| Quadrant-wise count rates Data is divided into 100 sec bins |
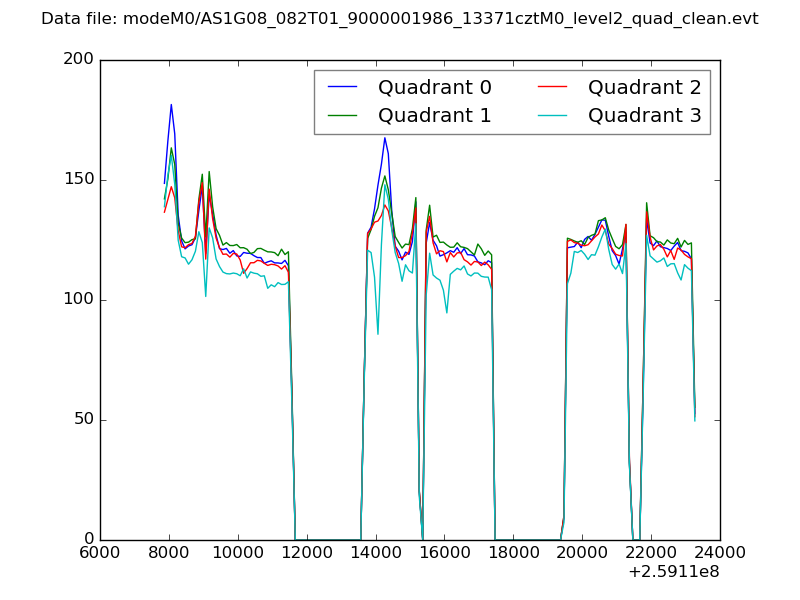 |
|
| Module-wise count rates for Quadrant A Data is divided into 100 sec bins |
 |
 |
| Module-wise count rates for Quadrant B Data is divided into 100 sec bins |
 |
 |
| Module-wise count rates for Quadrant C Data is divided into 100 sec bins |
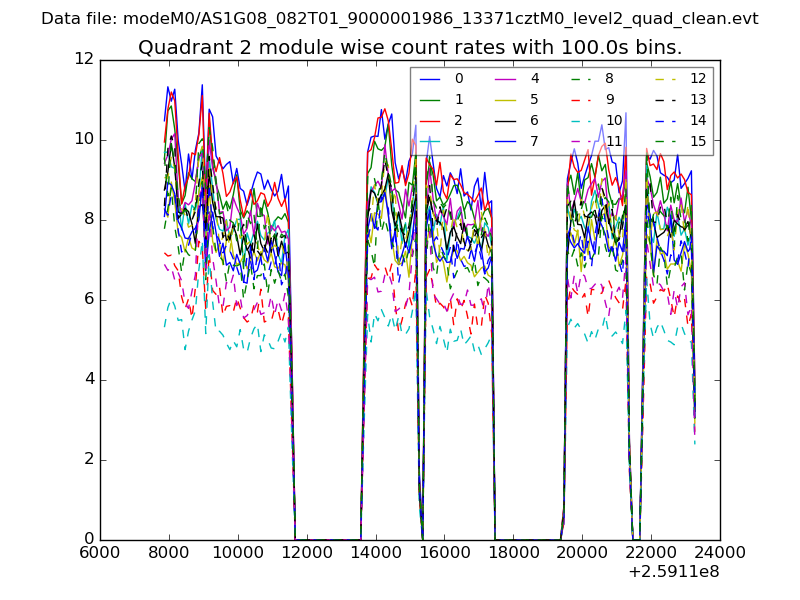 |
 |
| Module-wise count rates for Quadrant D Data is divided into 100 sec bins |
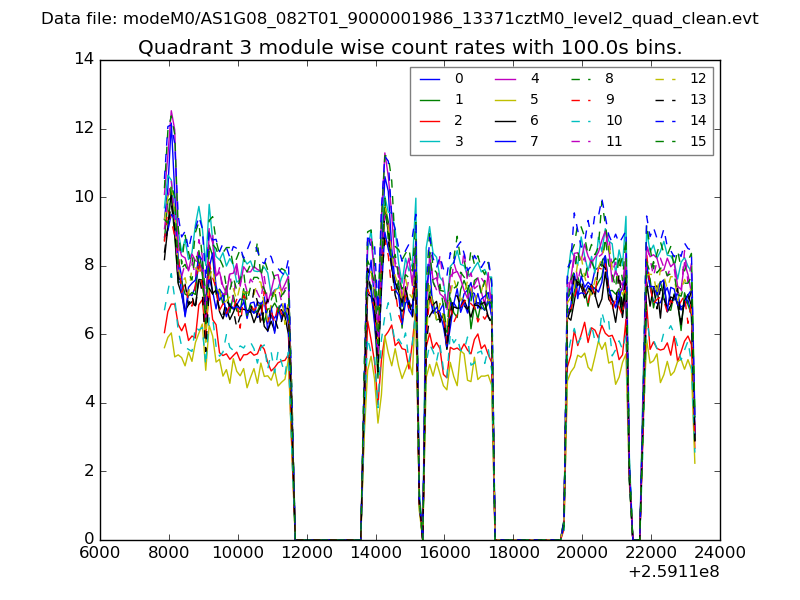 |
 |
| Parameter | Plot |
|---|---|
| CZT HV Monitor | 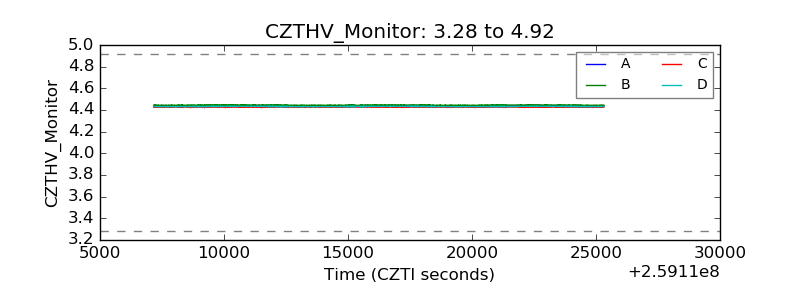 |
| D_VDD |  |
| Temperature 1 |  |
| Veto HV Monitor | 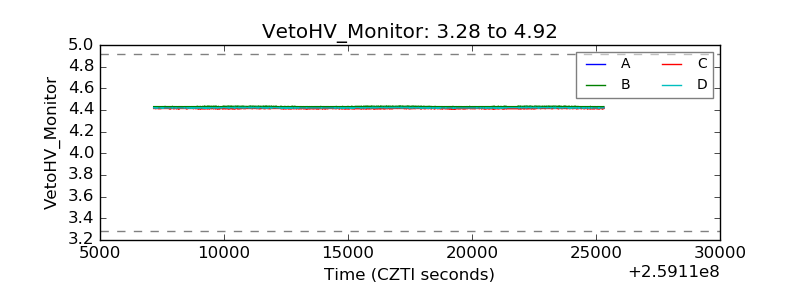 |
| Veto LLD |  |
| Alpha Counter | 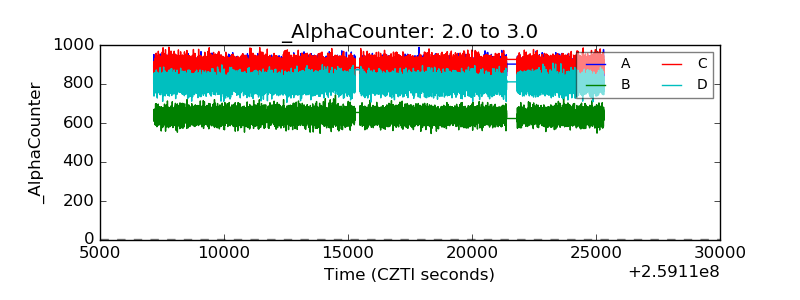 |
| _CPM_Rate | 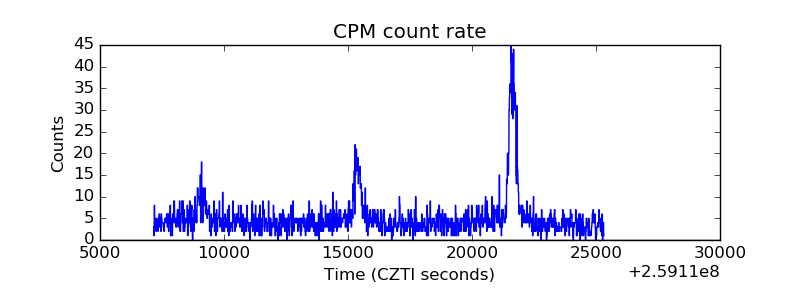 |
| CZT Counter | 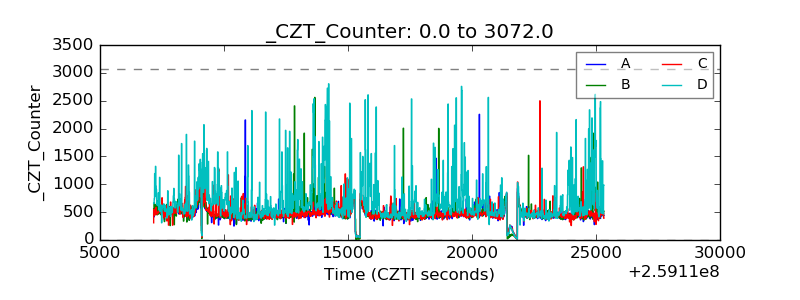 |
| +2.5 Volts monitor |  |
| +5 Volts monitor |  |
| _ROLL_ROT | 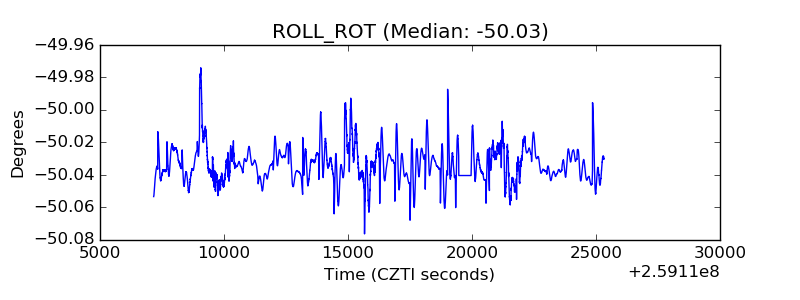 |
| _Roll_DEC | 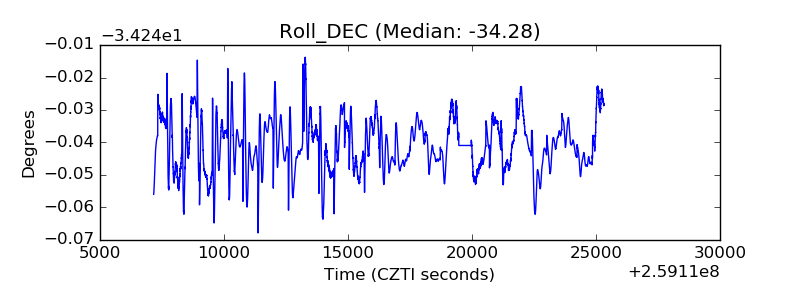 |
| _Roll_RA | 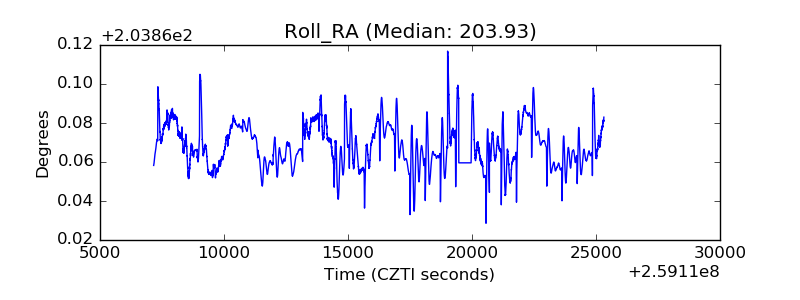 |
| Veto Counter | 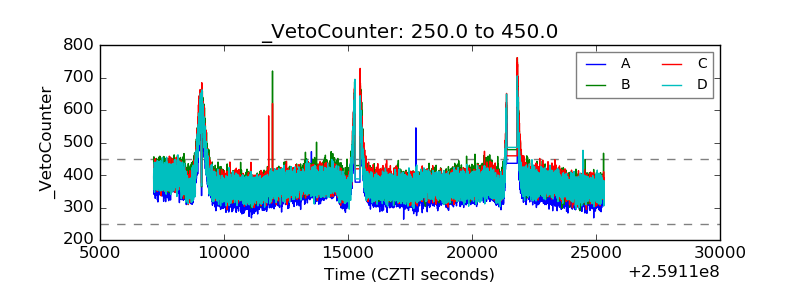 |