| Param | Original file | Final file |
|---|---|---|
| Filename | modeM0/AS1G08_082T01_9000001986_13373cztM0_level2.evt | modeM0/AS1G08_082T01_9000001986_13373cztM0_level2_quad_clean.evt |
| Size (bytes) | 142,090,560 | 20,188,800 |
| Size | 135.5 MB | 19.3 MB |
| Events in quadrant A | 993,834 | 120,727 |
| Events in quadrant B | 1,031,782 | 123,404 |
| Events in quadrant C | 937,064 | 118,886 |
| Events in quadrant D | 1,213,202 | 113,396 |
| Mode M0 | |||
|---|---|---|---|
| Quadrant | BADHDUFLAG | Total packets | Discarded packets |
| A | 0 | 4041 | 0 |
| B | 0 | 4218 | 0 |
| C | 0 | 3859 | 0 |
| D | 0 | 4756 | 0 |
| Mode SS | |||
|---|---|---|---|
| Quadrant | BADHDUFLAG | Total packets | Discarded packets |
| A | 0 | 38 | 0 |
| B | 0 | 38 | 0 |
| C | 0 | 38 | 0 |
| D | 0 | 38 | 0 |
| Quadrant | Total seconds | Saturated seconds | Saturation percentage |
|---|---|---|---|
| A | 1831 | 21 | 1.146914% |
| B | 1831 | 15 | 0.819224% |
| C | 1831 | 1 | 0.054615% |
| D | 1831 | 35 | 1.911524% |
Noise dominated data is calculated using 1-second bins in cleaned event files. If a bin has >2000 counts, and if more than 50% of those come from <1% of pixels, then it is considered to be noise-dominated and hence unusable.
| Quadrant | # 1 sec bins | Bins with >0 counts | Bins with >2000 counts | High rate bins dominated by noise | Noise dominated (total time) | Noise dominated (detector-on time) | Marked lightcurve |
|---|---|---|---|---|---|---|---|
| A | 1832 | 1832 | 11 | 11 | 0.60% | 0.60% | 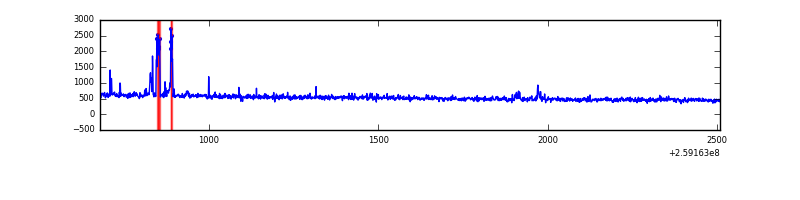 |
| B | 1832 | 1832 | 12 | 12 | 0.66% | 0.66% | 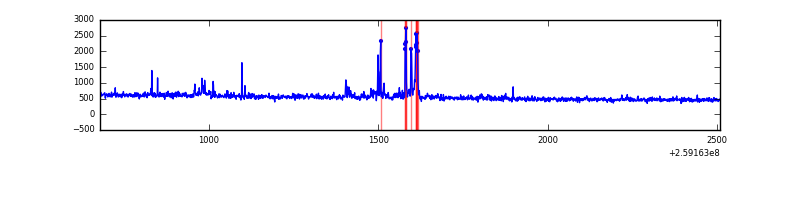 |
| C | 1832 | 1832 | 0 | 0 | 0.00% | 0.00% | 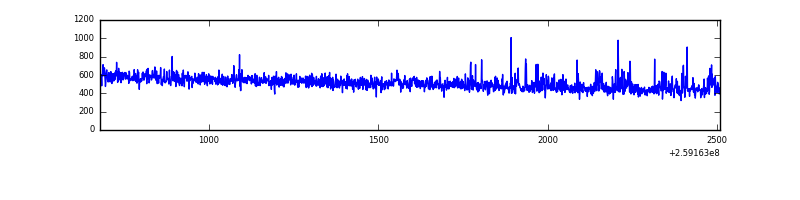 |
| D | 1832 | 1832 | 32 | 32 | 1.75% | 1.75% | 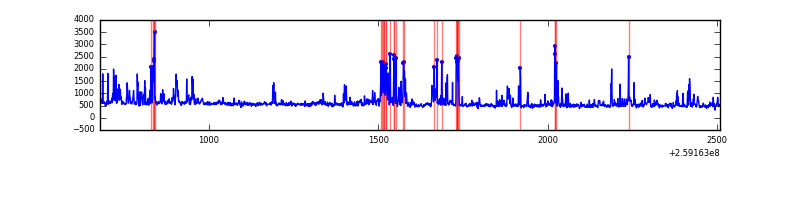 |
Top three noisy pixels from each quadrant. If the there are fewer than three noisy pixels in the level2.evt file, extra rows are filled as -1
| Pixel properties | Quadrant properties | ||||||
|---|---|---|---|---|---|---|---|
| Quadrant | DetID | PixID | Counts | Sigma | Mean | Median | Sigma |
| A | 9 | 143 | 50329 | 996.56 | 243 | 238 | 50.3 |
| A | 1 | 162 | 3859 | 72.04 | 243 | 238 | 50.3 |
| A | 15 | 69 | 2941 | 53.78 | 243 | 238 | 50.3 |
| B | 10 | 246 | 64786 | 1363.6 | 242 | 238 | 47.3 |
| B | 3 | 209 | 8881 | 182.59 | 242 | 238 | 47.3 |
| B | 4 | 142 | 6539 | 133.11 | 242 | 238 | 47.3 |
| C | 14 | 220 | 26258 | 481.67 | 229 | 230 | 54.0 |
| C | 3 | 233 | 16902 | 308.53 | 229 | 230 | 54.0 |
| C | 13 | 61 | 1607 | 25.48 | 229 | 230 | 54.0 |
| D | 14 | 34 | 160438 | 2845.39 | 228 | 222 | 56.3 |
| D | 8 | 195 | 85130 | 1507.94 | 228 | 222 | 56.3 |
| D | 1 | 52 | 76310 | 1351.3 | 228 | 222 | 56.3 |
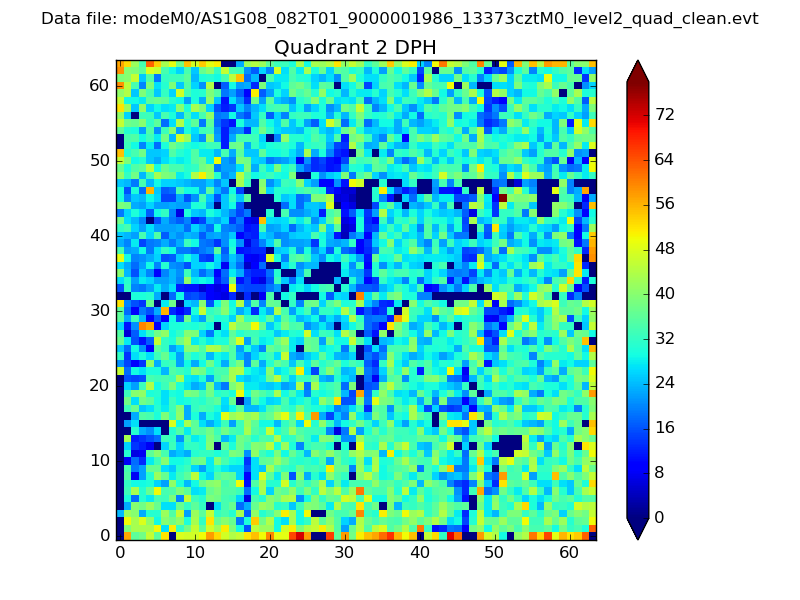
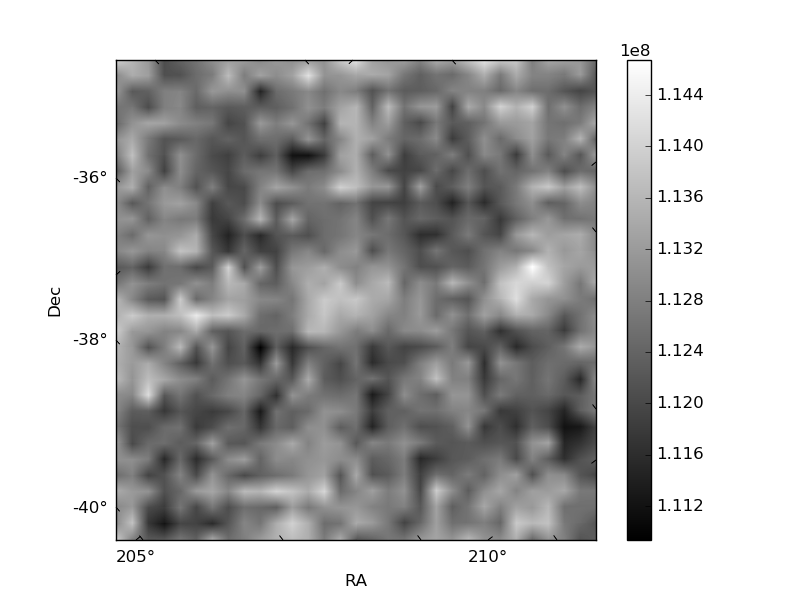
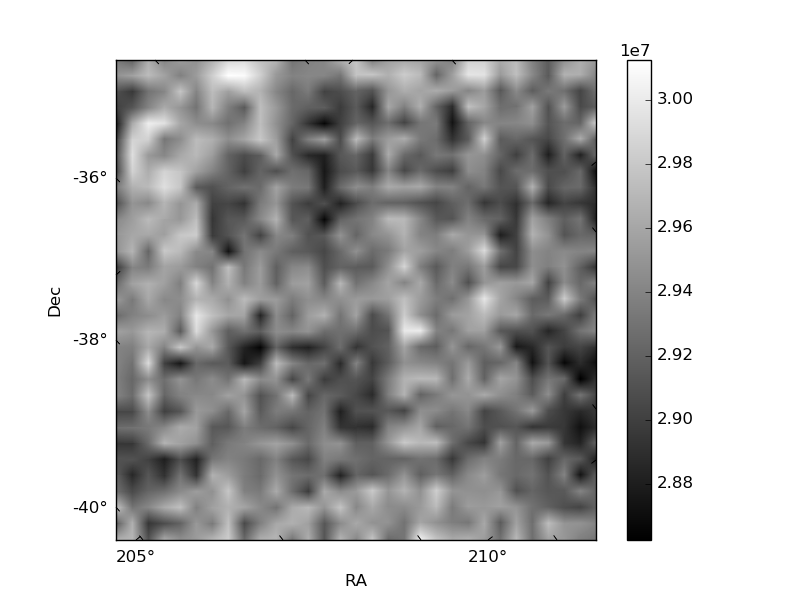
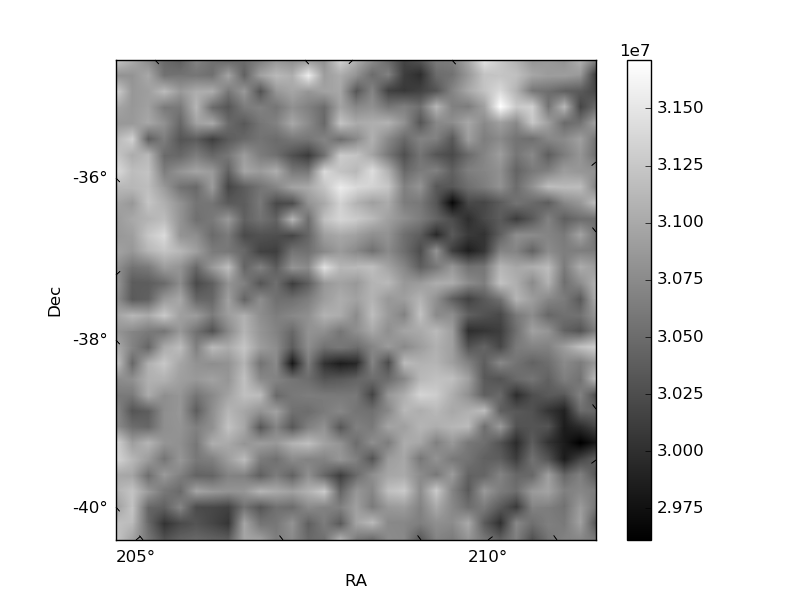
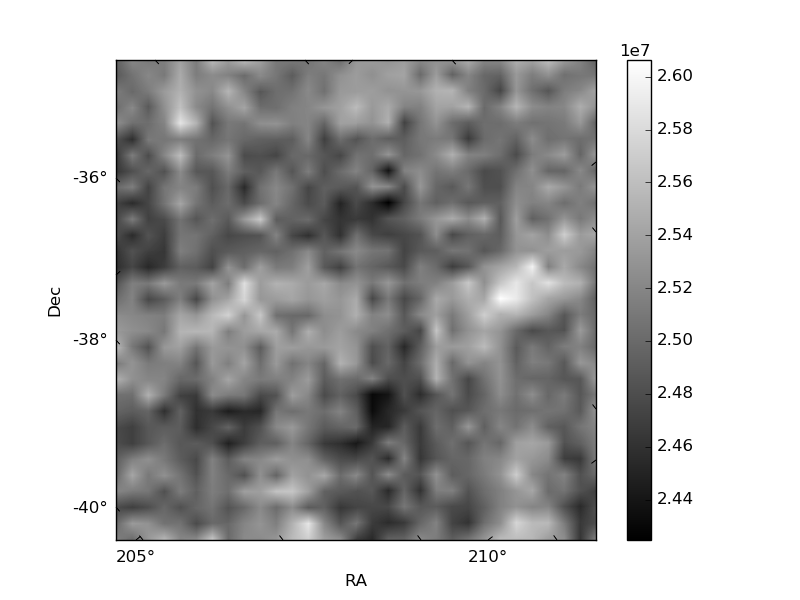
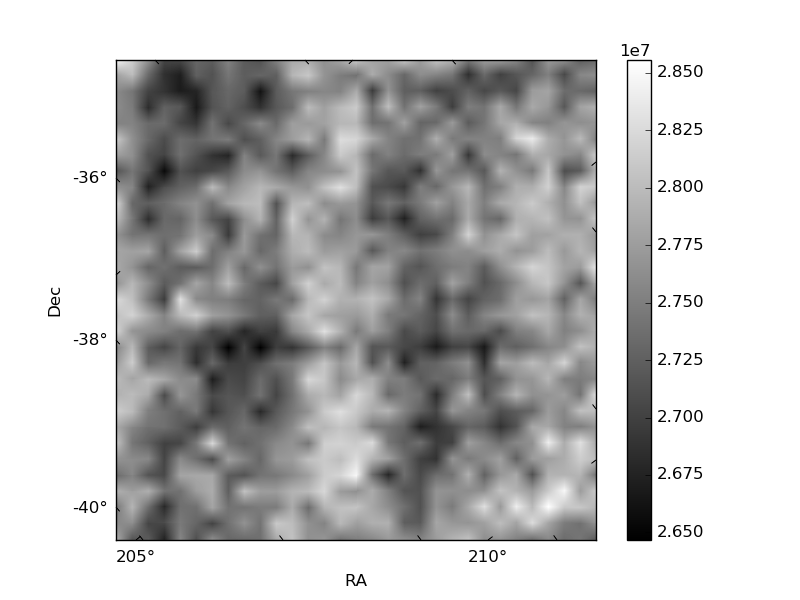
Histogram calculated using DETX and DETY for each event in the final _common_clean file
| Quadrant A | 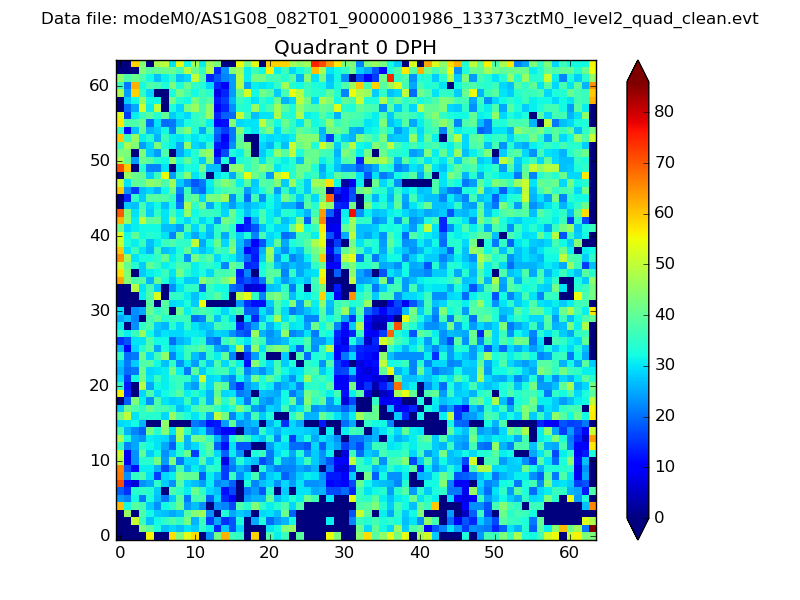 |
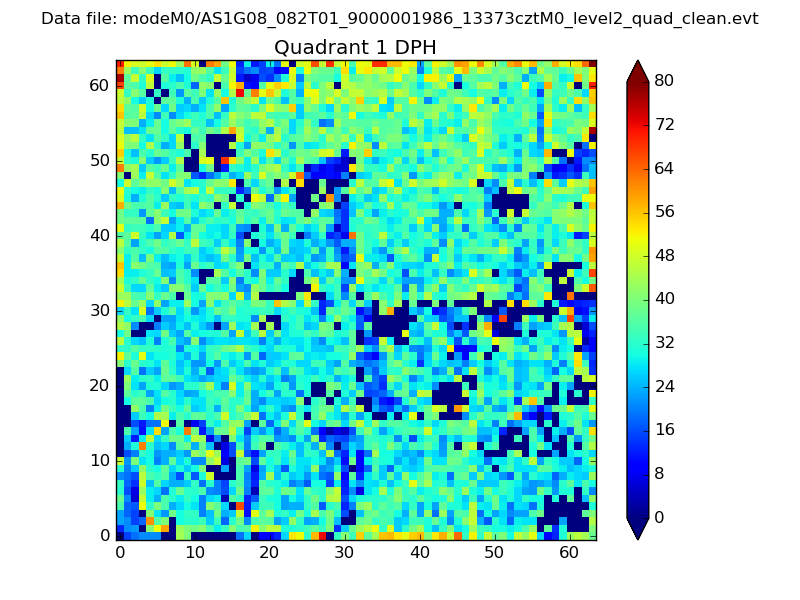 |
Quadrant B |
|---|---|---|---|
| Quadrant D | 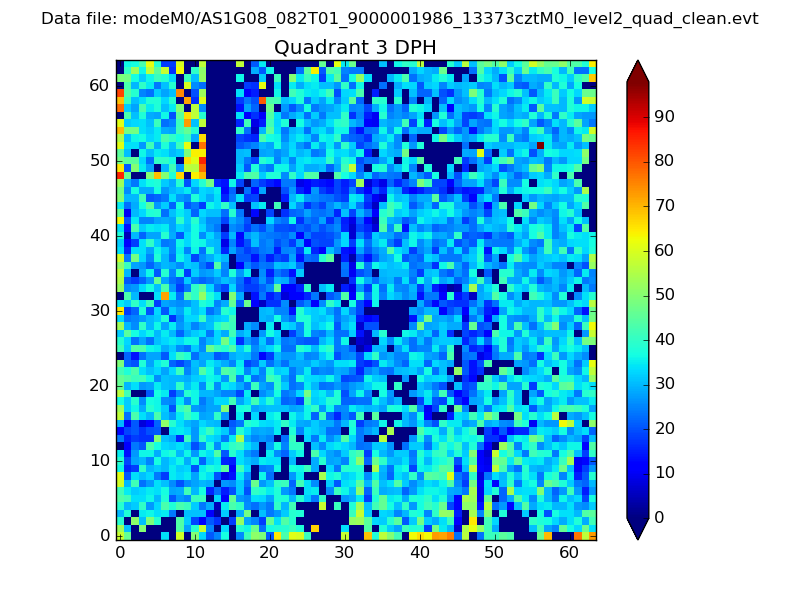 |
 |
Quadrant C |
| Plot type | Count rate plots | Images |
|---|---|---|
| Comparison with Poisson distribution Blue bars denote a histogram of data divided into 1 sec bins. Red curve is a Poisson curve with rate = median count rate of data. |
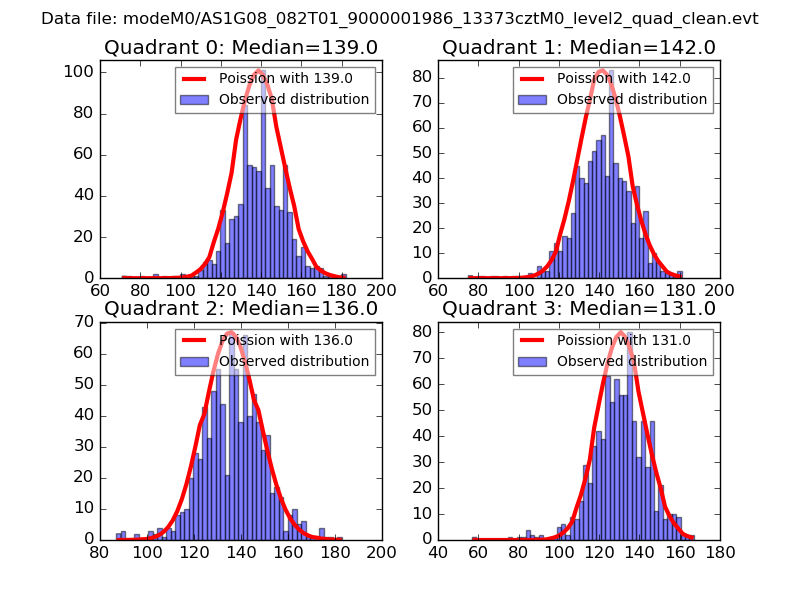 |
 |
| Quadrant-wise count rates Data is divided into 100 sec bins |
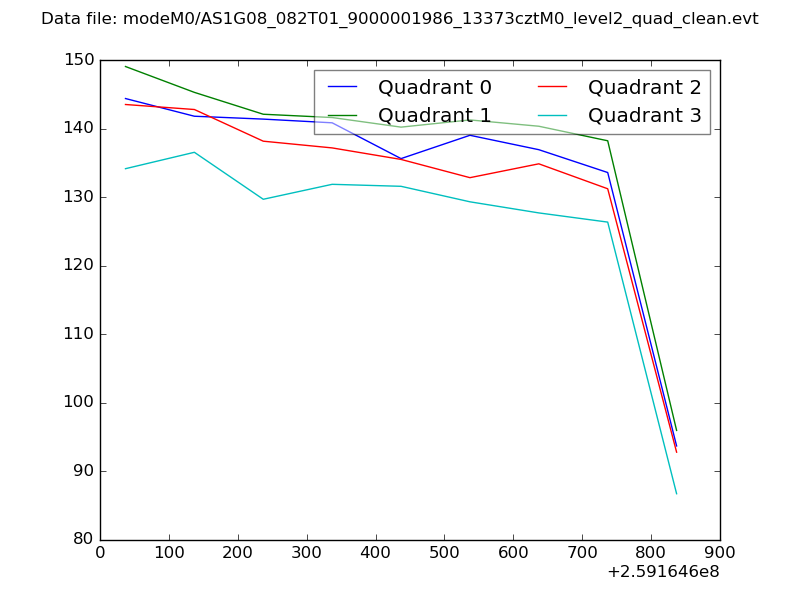 |
|
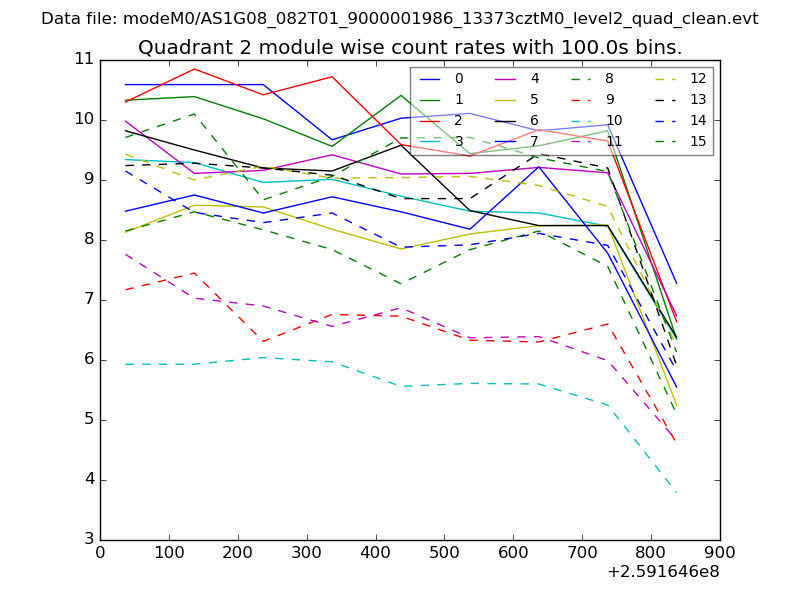
| Module-wise count rates for Quadrant A Data is divided into 100 sec bins |
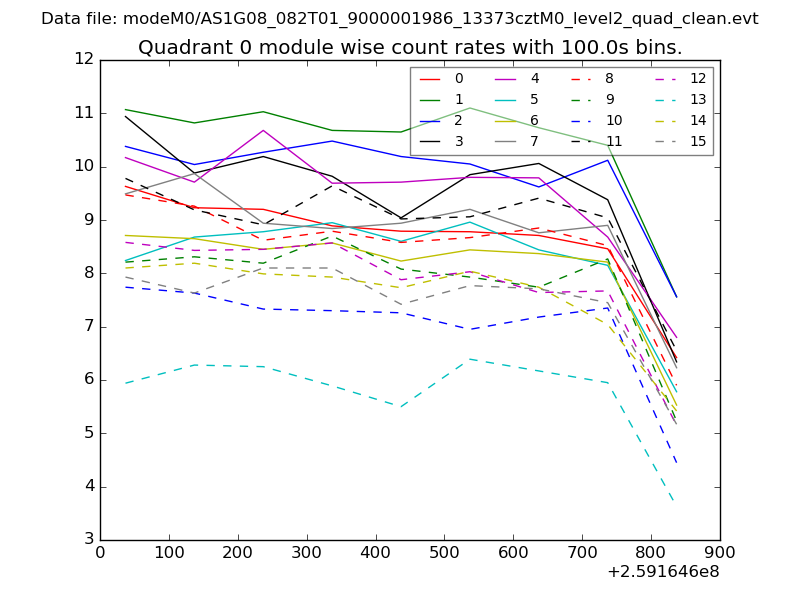 |
 |
| Module-wise count rates for Quadrant B Data is divided into 100 sec bins |
 |
 |
| Module-wise count rates for Quadrant C Data is divided into 100 sec bins |
 |
 |
| Module-wise count rates for Quadrant D Data is divided into 100 sec bins |
 |
 |
| Parameter | Plot |
|---|---|
| CZT HV Monitor | 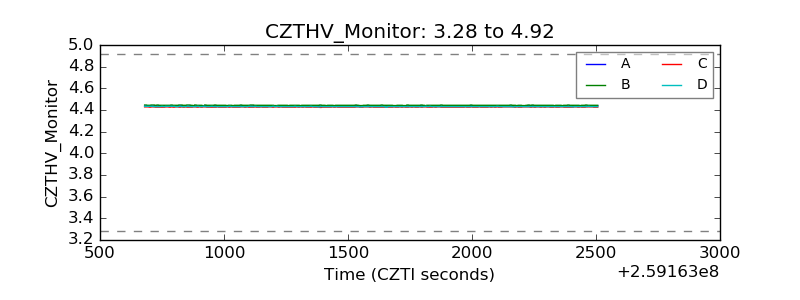 |
| D_VDD | 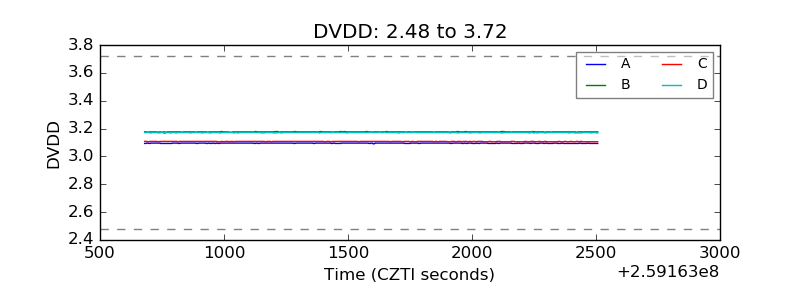 |
| Temperature 1 |  |
| Veto HV Monitor | 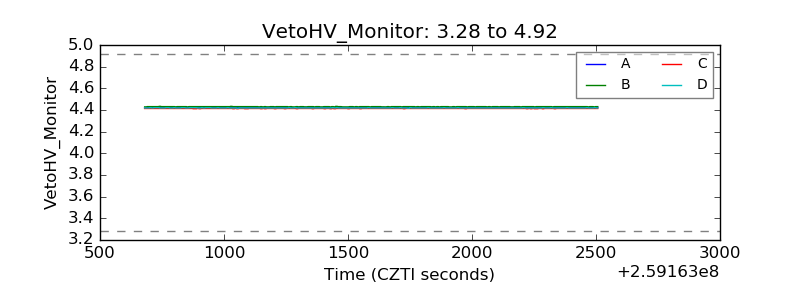 |
| Veto LLD | 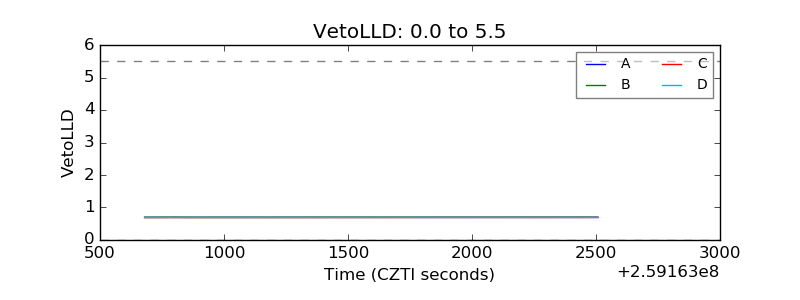 |
| Alpha Counter | 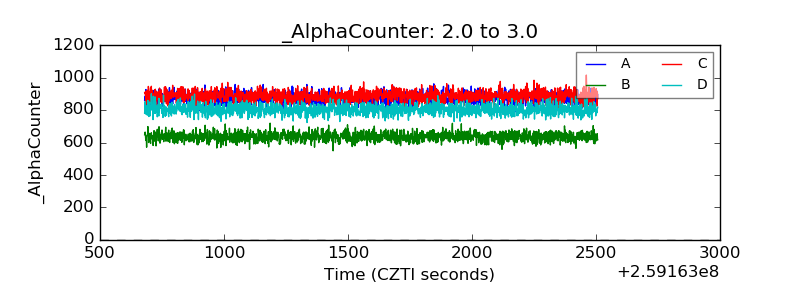 |
| _CPM_Rate | 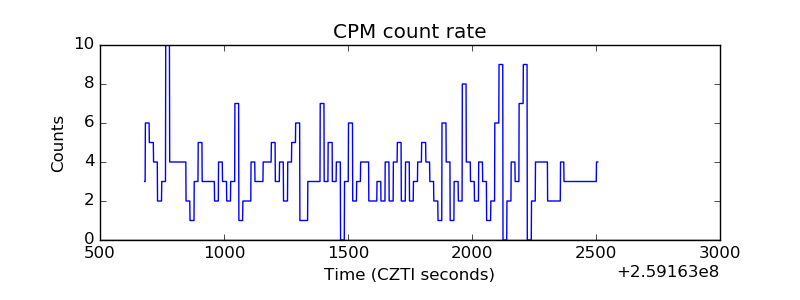 |
| CZT Counter | 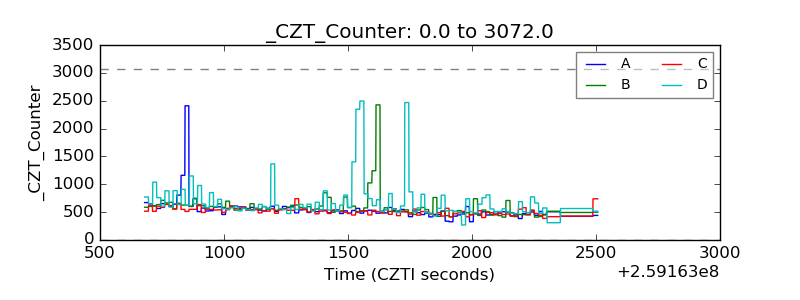 |
| +2.5 Volts monitor |  |
| +5 Volts monitor | 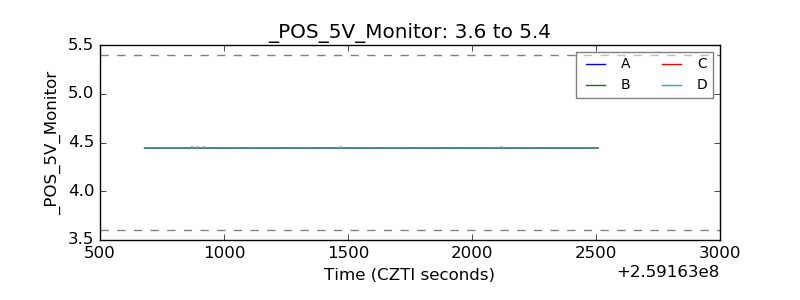 |
| _ROLL_ROT | 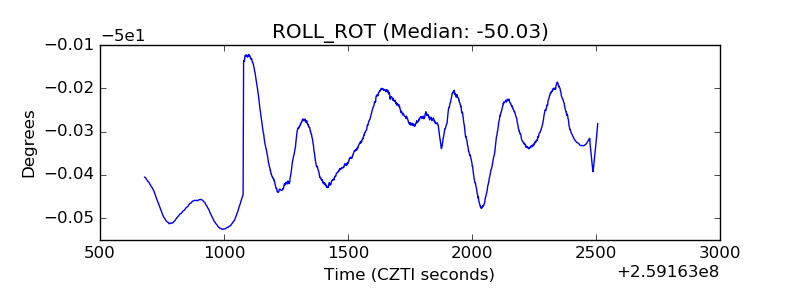 |
| _Roll_DEC | 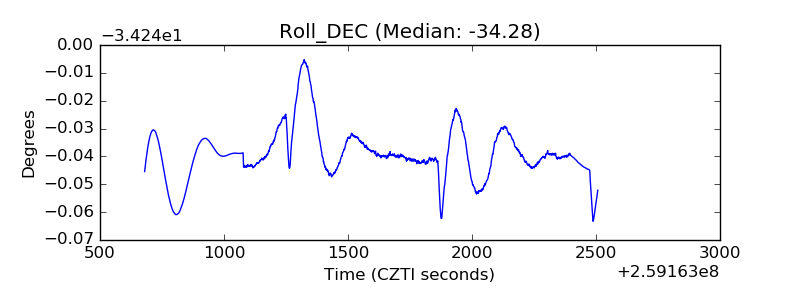 |
| _Roll_RA | 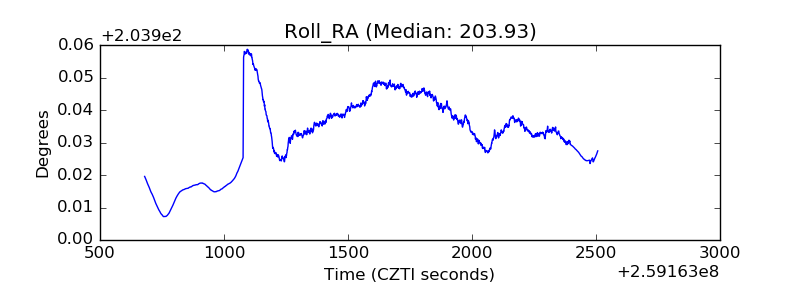 |
| Veto Counter | 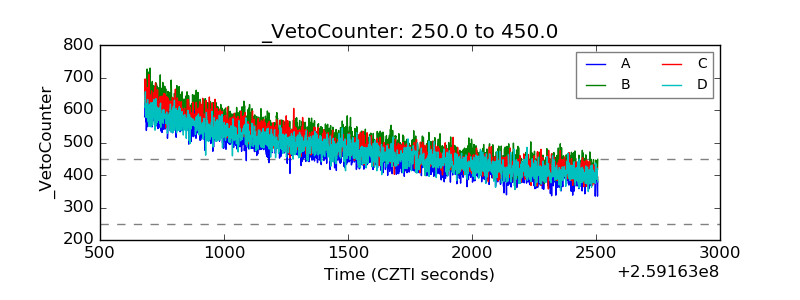 |