| Param | Original file | Final file |
|---|---|---|
| Filename | modeM0/AS1A04_103T01_9000001988cztM0_level2.fits | modeM0/AS1A04_103T01_9000001988cztM0_level2_quad_clean.evt |
| Size (bytes) | 6,582,816,000 | 6,744,297,600 |
| Size | 6.1 GB | 6.3 GB |
| Events in quadrant A | 40,509,356 | 41,361,294 |
| Events in quadrant B | 38,987,130 | 41,568,989 |
| Events in quadrant C | 39,559,347 | 39,328,872 |
| Events in quadrant D | 33,234,730 | 34,952,715 |
| Mode M0 | |||
|---|---|---|---|
| Quadrant | BADHDUFLAG | Total packets | Discarded packets |
| A | 0 | 1429484 | 0 |
| B | 0 | 1511673 | 0 |
| C | 0 | 1437309 | 0 |
| D | 0 | 1776066 | 0 |
| Mode SS | |||
|---|---|---|---|
| Quadrant | BADHDUFLAG | Total packets | Discarded packets |
| A | 0 | 14044 | 0 |
| B | 0 | 14024 | 0 |
| C | 0 | 14028 | 0 |
| D | 0 | 14036 | 0 |
| Mode M9 | |||
|---|---|---|---|
| Quadrant | BADHDUFLAG | Total packets | Discarded packets |
| A | 0 | 1091 | 0 |
| B | 0 | 1087 | 0 |
| C | 0 | 1089 | 0 |
| D | 0 | 1088 | 0 |
| Quadrant | Total seconds | Saturated seconds | Saturation percentage |
|---|---|---|---|
| A | 687182 | 6381 | 0.928575% |
| B | 687115 | 14647 | 2.131666% |
| C | 687206 | 5438 | 0.791320% |
| D | 687184 | 33204 | 4.831894% |
Noise dominated data is calculated using 1-second bins in cleaned event files. If a bin has >2000 counts, and if more than 50% of those come from <1% of pixels, then it is considered to be noise-dominated and hence unusable.
| Quadrant | # 1 sec bins | Bins with >0 counts | Bins with >2000 counts | High rate bins dominated by noise | Noise dominated (total time) | Noise dominated (detector-on time) | Marked lightcurve |
|---|---|---|---|---|---|---|---|
| A | 800542 | 687985 | 0 | 0 | 0.00% | 0.00% | 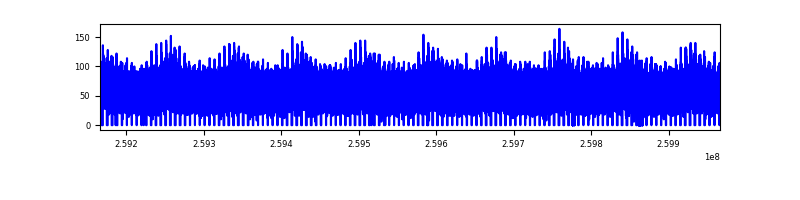 |
| B | 800542 | 687606 | 0 | 0 | 0.00% | 0.00% | 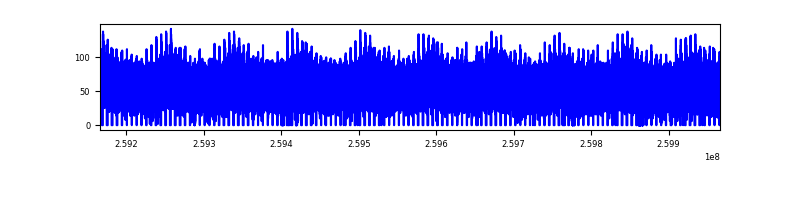 |
| C | 800542 | 688013 | 0 | 0 | 0.00% | 0.00% | 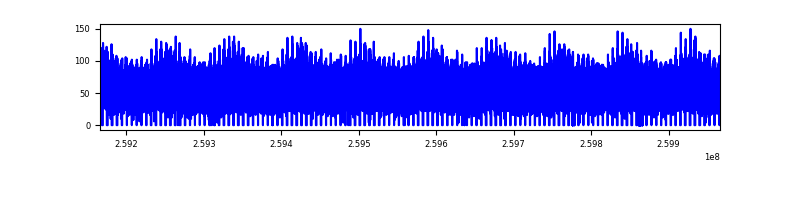 |
| D | 800542 | 686576 | 0 | 0 | 0.00% | 0.00% | 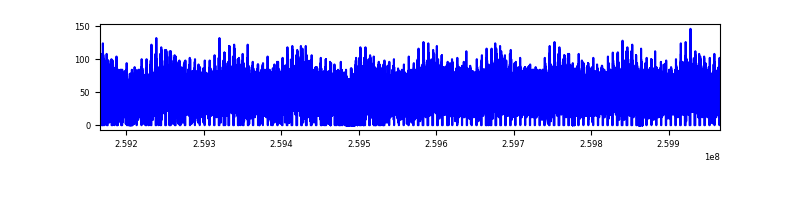 |
Top three noisy pixels from each quadrant. If the there are fewer than three noisy pixels in the level2.evt file, extra rows are filled as -1
| Pixel properties | Quadrant properties | ||||||
|---|---|---|---|---|---|---|---|
| Quadrant | DetID | PixID | Counts | Sigma | Mean | Median | Sigma |
| A | 0 | 29 | 38776 | 11.14 | 10543 | 9877 | 2594.0 |
| A | 7 | 110 | 32612 | 8.76 | 10543 | 9877 | 2594.0 |
| A | 9 | 19 | 29505 | 7.57 | 10543 | 9877 | 2594.0 |
| B | 2 | 9 | 32816 | 11.58 | 10286 | 9799 | 1987.2 |
| B | 3 | 17 | 26311 | 8.31 | 10286 | 9799 | 1987.2 |
| B | 14 | 254 | 25581 | 7.94 | 10286 | 9799 | 1987.2 |
| C | 1 | 80 | 29906 | 7.52 | 10450 | 9719 | 2685.1 |
| C | 1 | 81 | 29525 | 7.38 | 10450 | 9719 | 2685.1 |
| C | 12 | 241 | 27546 | 6.64 | 10450 | 9719 | 2685.1 |
| D | 6 | 231 | 24448 | 6.32 | 9499 | 8637 | 2503.4 |
| D | 7 | 3 | 23092 | 5.77 | 9499 | 8637 | 2503.4 |
| D | 7 | 5 | 23008 | 5.74 | 9499 | 8637 | 2503.4 |
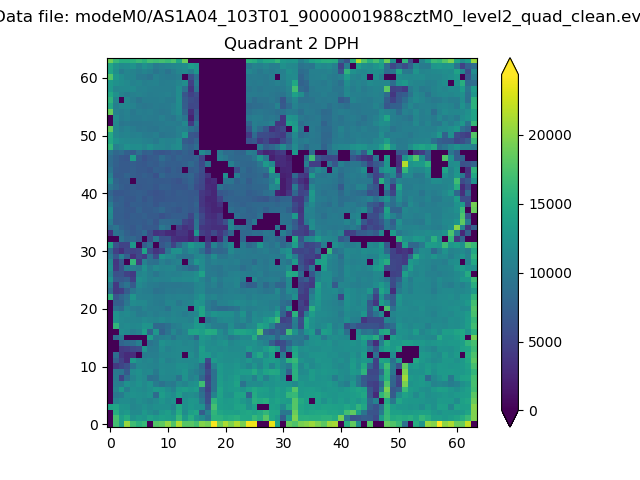
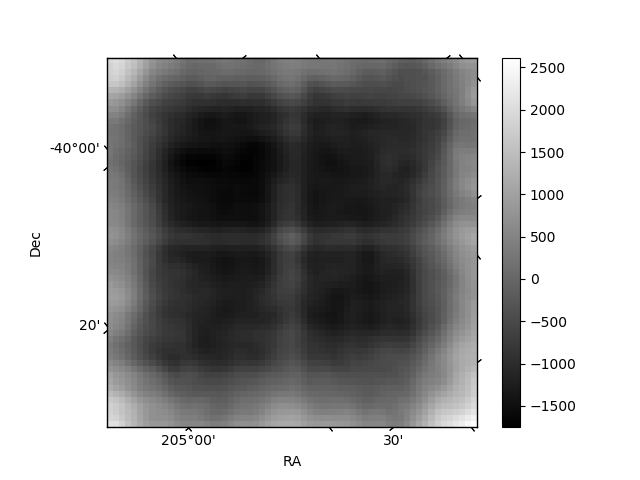
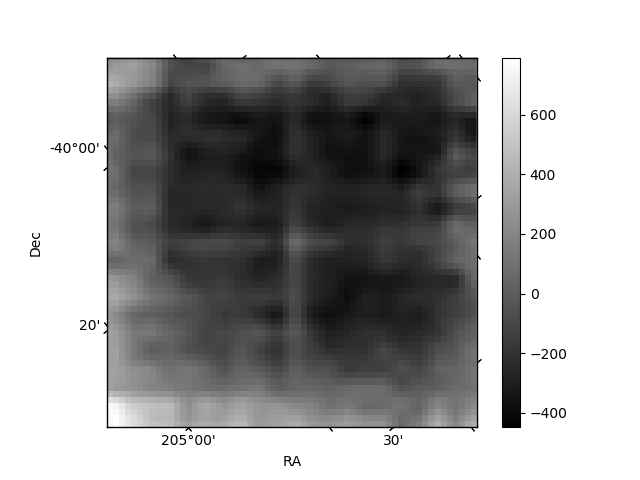
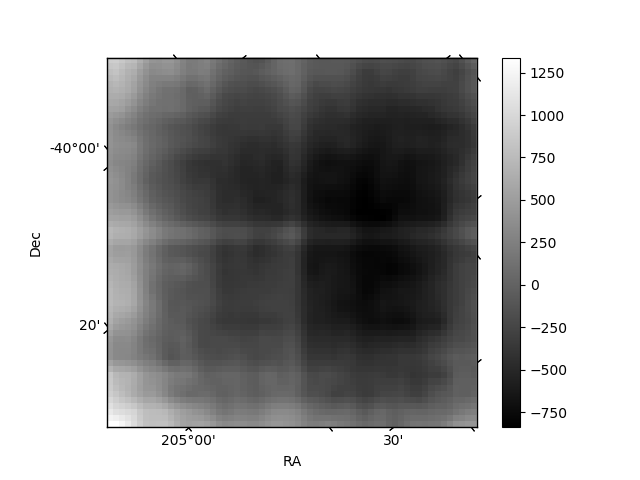
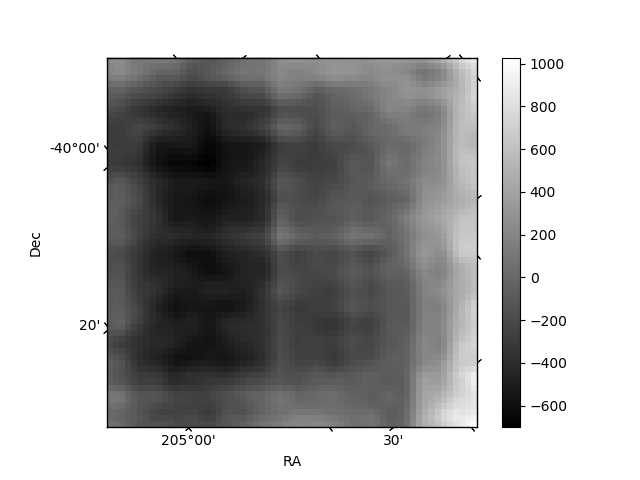
Histogram calculated using DETX and DETY for each event in the final _common_clean file
| Quadrant A | 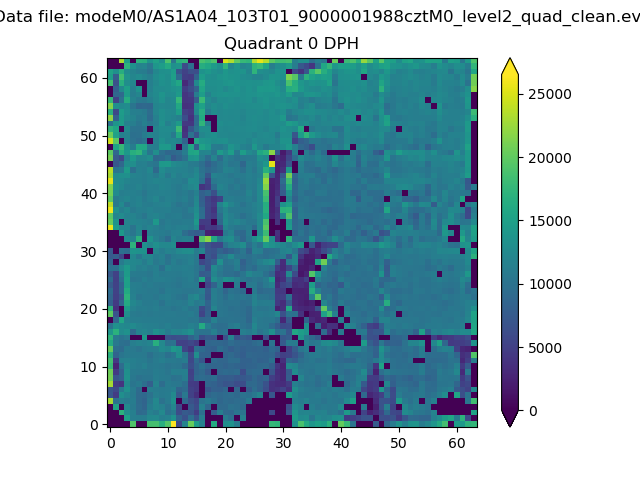 |
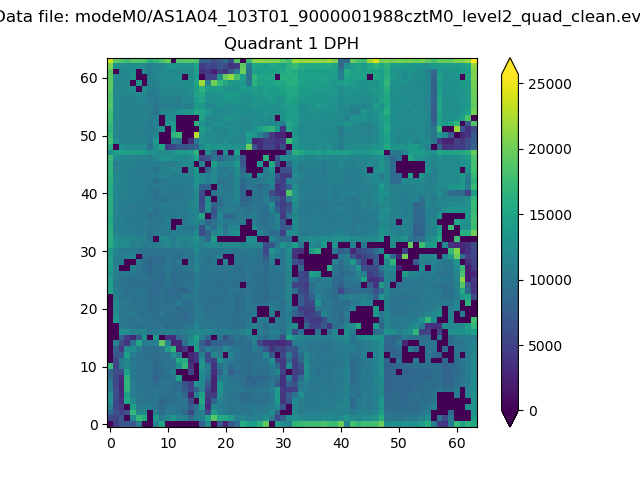 |
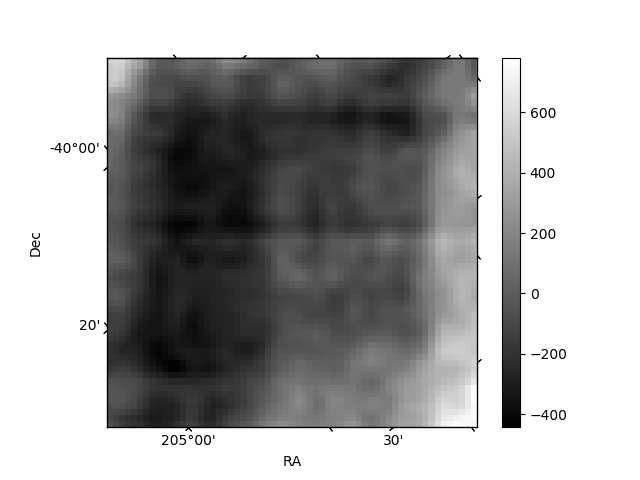
Quadrant B |
|---|---|---|---|
| Quadrant D | 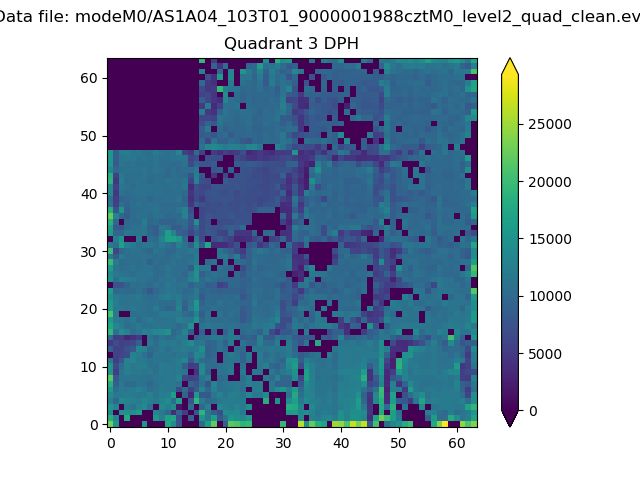 |
 |
Quadrant C |
| Plot type | Count rate plots | Images |
|---|---|---|
| Comparison with Poisson distribution Blue bars denote a histogram of data divided into 1 sec bins. Red curve is a Poisson curve with rate = median count rate of data. |
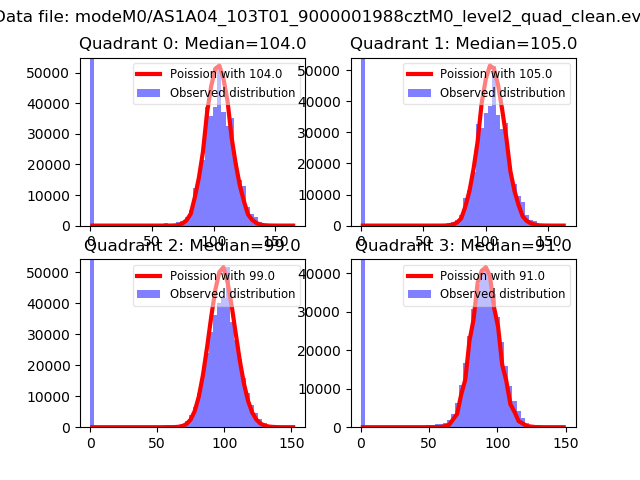 |
 |
| Quadrant-wise count rates Data is divided into 100 sec bins |
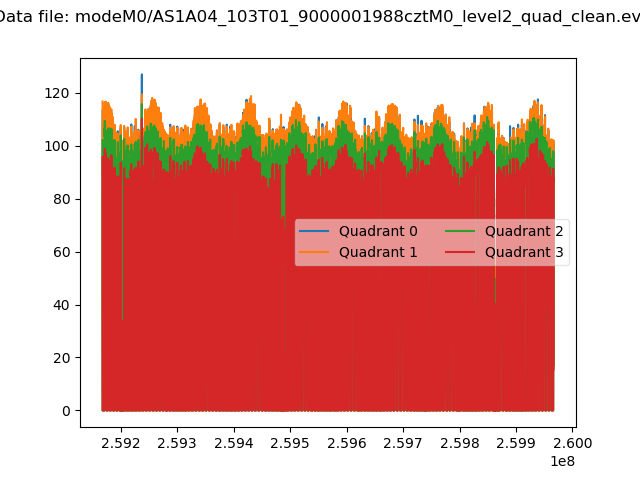 |
|
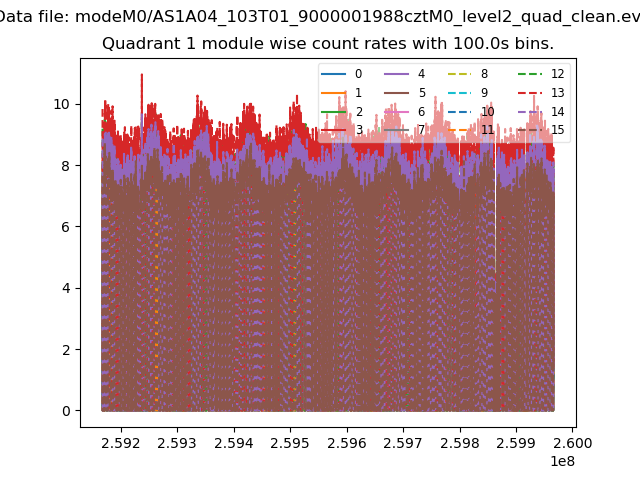
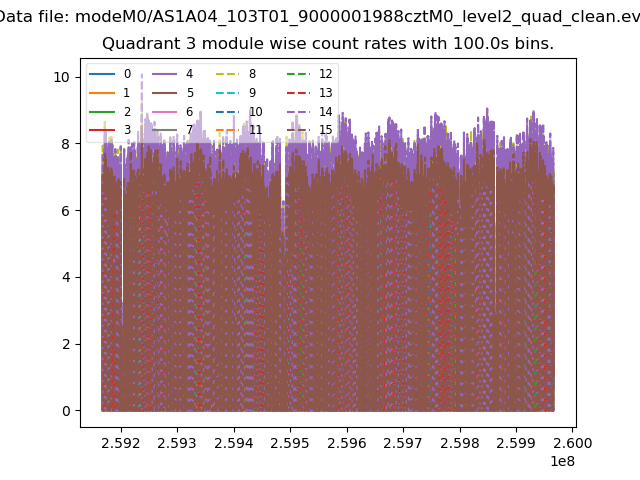
| Module-wise count rates for Quadrant A Data is divided into 100 sec bins |
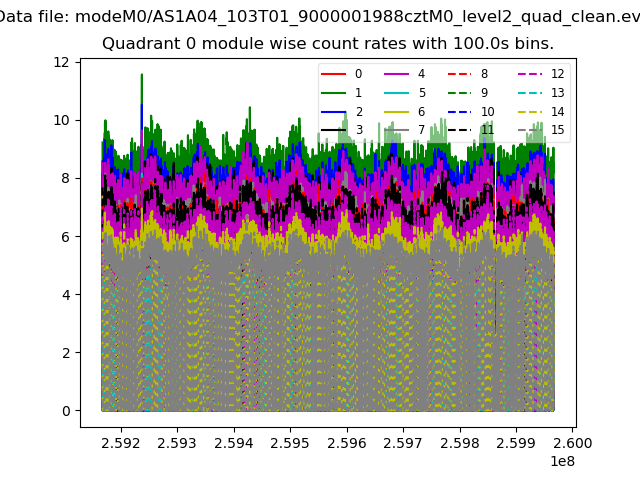 |
 |
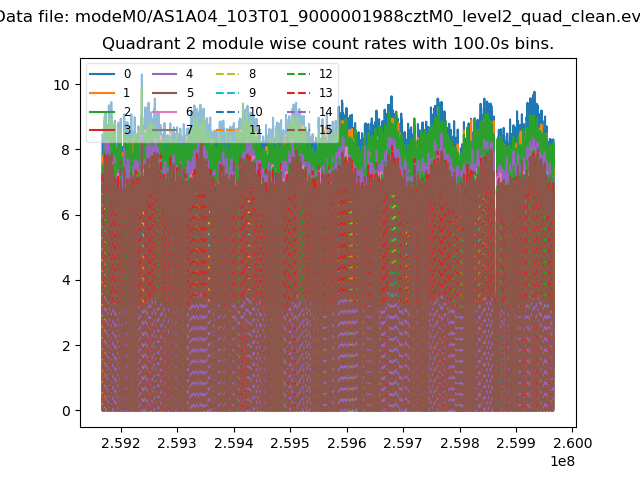
| Module-wise count rates for Quadrant B Data is divided into 100 sec bins |
 |
 |
| Module-wise count rates for Quadrant C Data is divided into 100 sec bins |
 |
 |
| Module-wise count rates for Quadrant D Data is divided into 100 sec bins |
 |
 |
| Parameter | Plot |
|---|---|
| CZT HV Monitor | 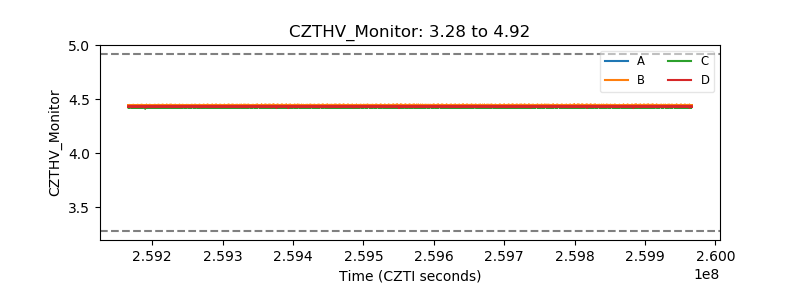 |
| D_VDD | 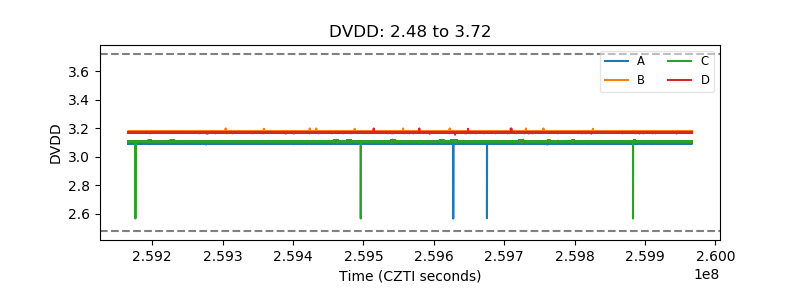 |
| Temperature 1 | 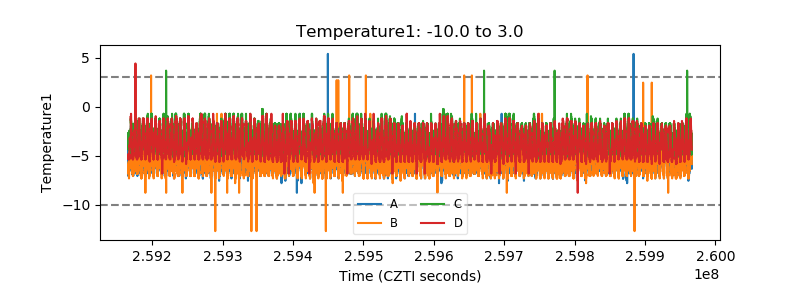 |
| Veto HV Monitor | 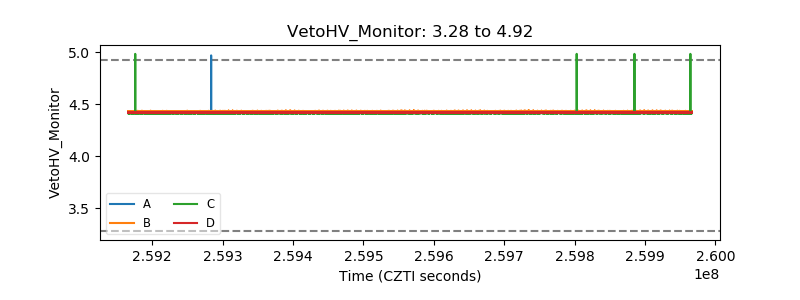 |
| Veto LLD | 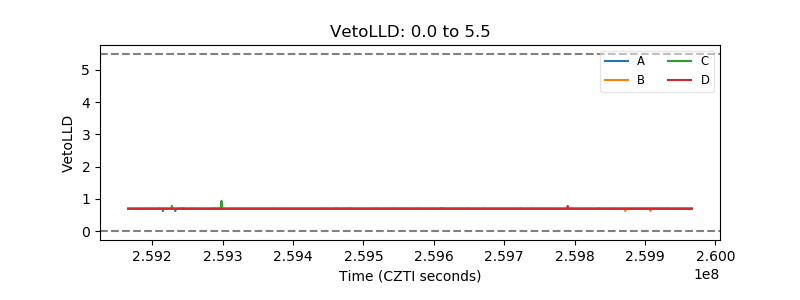 |
| Alpha Counter | 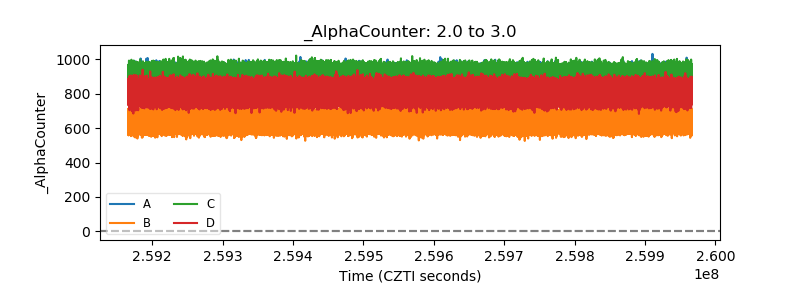 |
| _CPM_Rate | 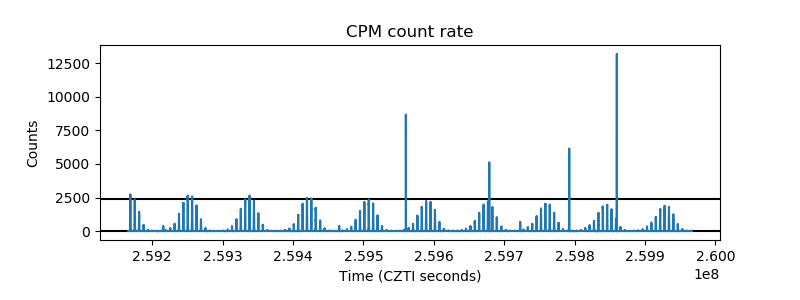 |
| CZT Counter | 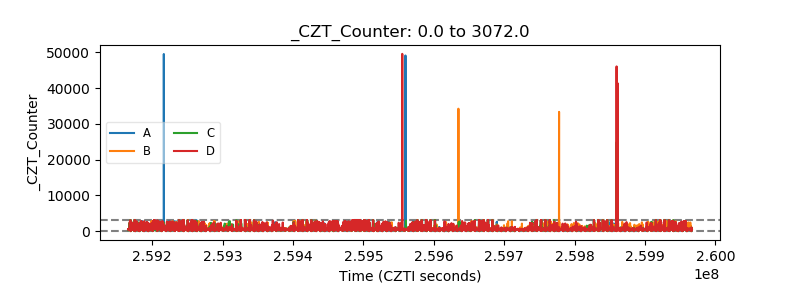 |
| +2.5 Volts monitor | 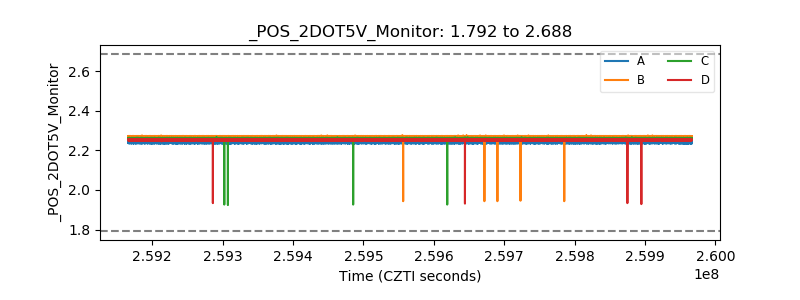 |
| +5 Volts monitor | 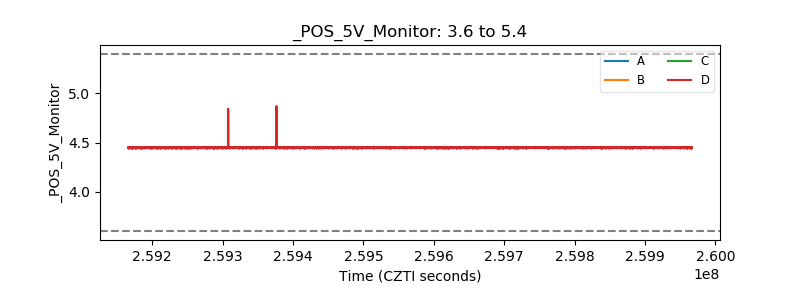 |
| _ROLL_ROT | 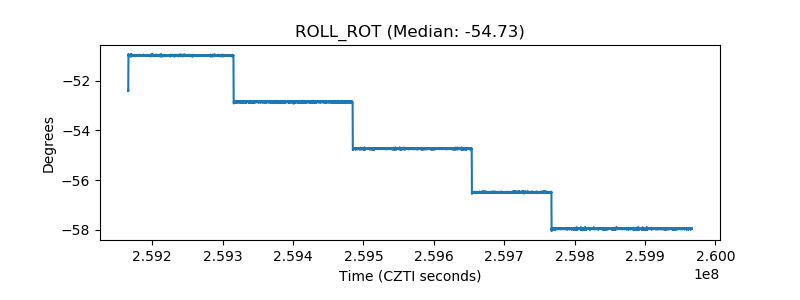 |
| _Roll_DEC | 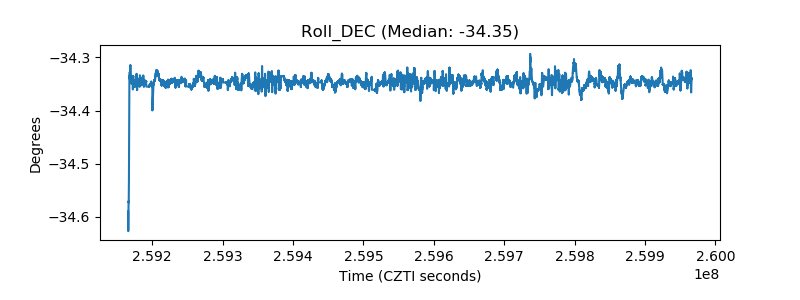 |
| _Roll_RA | 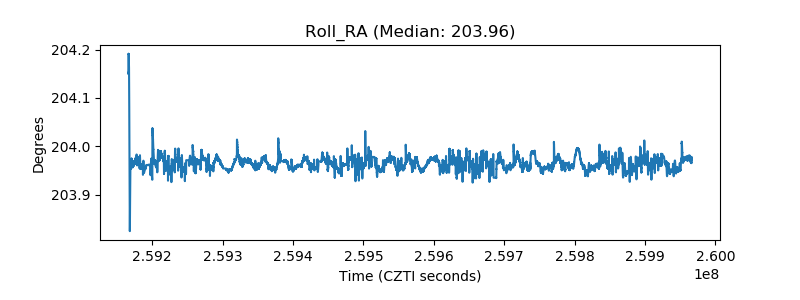 |
| Veto Counter | 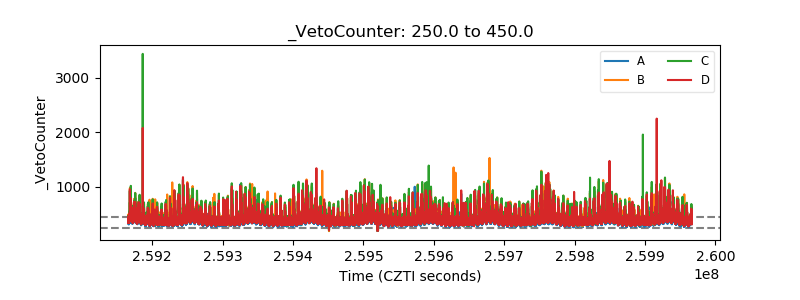 |