| Param | Original file | Final file |
|---|---|---|
| Filename | modeM0/AS1A04_103T01_9000001988_13373cztM0_level2.evt | modeM0/AS1A04_103T01_9000001988_13373cztM0_level2_quad_clean.evt |
| Size (bytes) | 310,095,360 | 63,800,640 |
| Size | 295.7 MB | 60.8 MB |
| Events in quadrant A | 2,104,662 | 421,119 |
| Events in quadrant B | 2,086,797 | 432,620 |
| Events in quadrant C | 2,152,484 | 412,611 |
| Events in quadrant D | 2,776,990 | 385,721 |
| Mode M0 | |||
|---|---|---|---|
| Quadrant | BADHDUFLAG | Total packets | Discarded packets |
| A | 0 | 8804 | 3 |
| B | 0 | 8711 | 2 |
| C | 0 | 8976 | 2 |
| D | 0 | 10883 | 2 |
| Mode SS | |||
|---|---|---|---|
| Quadrant | BADHDUFLAG | Total packets | Discarded packets |
| A | 0 | 84 | 0 |
| B | 0 | 84 | 0 |
| C | 0 | 84 | 0 |
| D | 0 | 84 | 0 |
| Mode M9 | |||
|---|---|---|---|
| Quadrant | BADHDUFLAG | Total packets | Discarded packets |
| A | 0 | 12 | 0 |
| B | 0 | 12 | 0 |
| C | 0 | 12 | 0 |
| D | 0 | 12 | 0 |
| Quadrant | Total seconds | Saturated seconds | Saturation percentage |
|---|---|---|---|
| A | 3954 | 67 | 1.694487% |
| B | 3954 | 76 | 1.922104% |
| C | 3954 | 55 | 1.390996% |
| D | 3954 | 184 | 4.653515% |
Noise dominated data is calculated using 1-second bins in cleaned event files. If a bin has >2000 counts, and if more than 50% of those come from <1% of pixels, then it is considered to be noise-dominated and hence unusable.
| Quadrant | # 1 sec bins | Bins with >0 counts | Bins with >2000 counts | High rate bins dominated by noise | Noise dominated (total time) | Noise dominated (detector-on time) | Marked lightcurve |
|---|---|---|---|---|---|---|---|
| A | 5255 | 3957 | 7 | 7 | 0.13% | 0.18% | 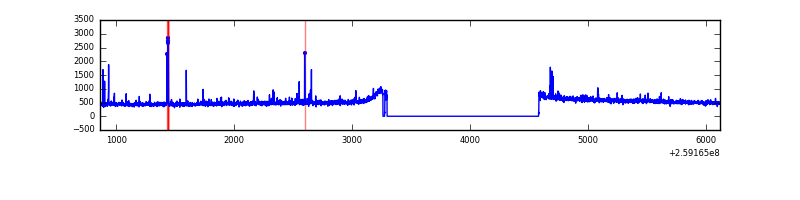 |
| B | 5255 | 3957 | 3 | 3 | 0.06% | 0.08% | 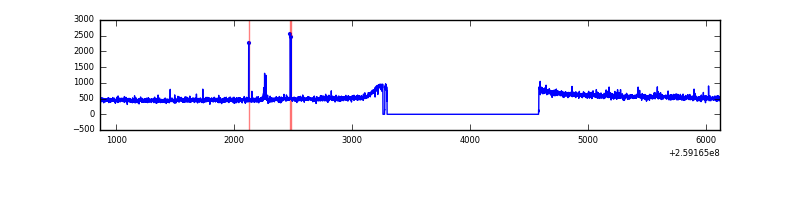 |
| C | 5255 | 3957 | 8 | 8 | 0.15% | 0.20% | 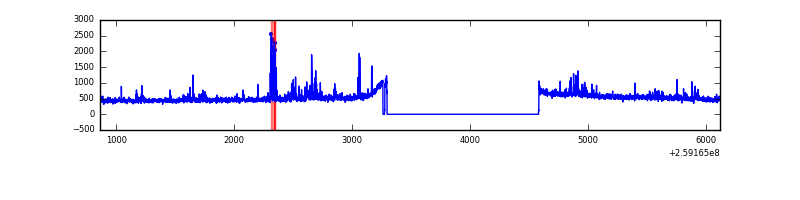 |
| D | 5255 | 3957 | 122 | 122 | 2.32% | 3.08% | 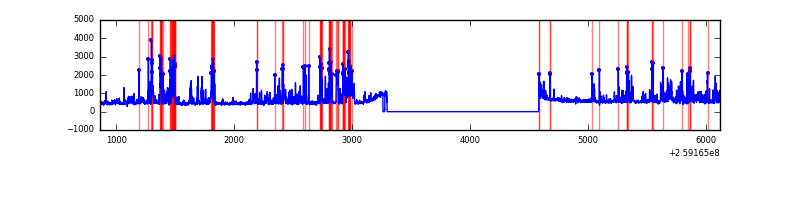 |
Top three noisy pixels from each quadrant. If the there are fewer than three noisy pixels in the level2.evt file, extra rows are filled as -1
| Pixel properties | Quadrant properties | ||||||
|---|---|---|---|---|---|---|---|
| Quadrant | DetID | PixID | Counts | Sigma | Mean | Median | Sigma |
| A | 9 | 143 | 71154 | 677.37 | 521 | 512 | 104.3 |
| A | 1 | 162 | 12250 | 112.55 | 521 | 512 | 104.3 |
| A | 0 | 226 | 4599 | 39.19 | 521 | 512 | 104.3 |
| B | 3 | 64 | 19034 | 186.11 | 526 | 514 | 99.5 |
| B | 12 | 111 | 11134 | 106.72 | 526 | 514 | 99.5 |
| B | 11 | 111 | 9144 | 86.72 | 526 | 514 | 99.5 |
| C | 14 | 220 | 154000 | 1316.7 | 505 | 509 | 116.6 |
| C | 3 | 233 | 30201 | 254.71 | 505 | 509 | 116.6 |
| C | 13 | 61 | 3711 | 27.47 | 505 | 509 | 116.6 |
| D | 1 | 52 | 679215 | 5817.43 | 490 | 476 | 116.7 |
| D | 5 | 222 | 167447 | 1431.1 | 490 | 476 | 116.7 |
| D | 8 | 195 | 71990 | 612.94 | 490 | 476 | 116.7 |
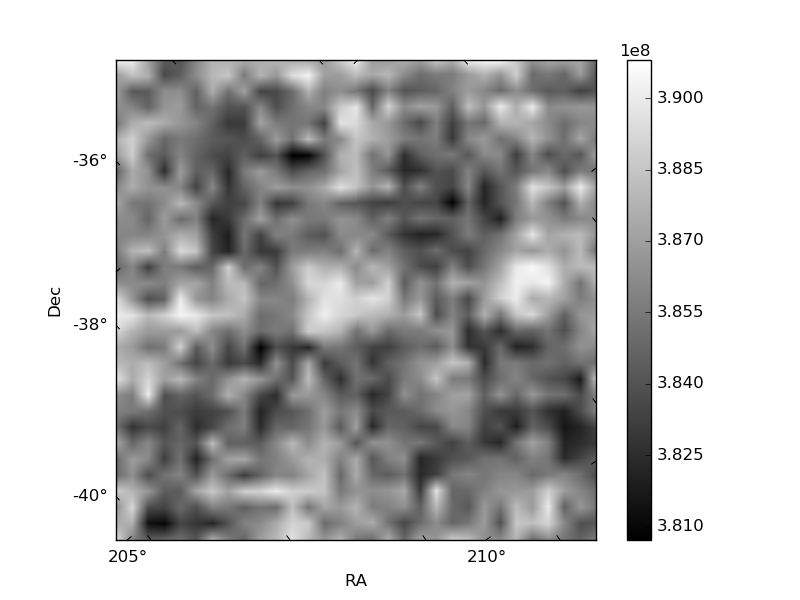
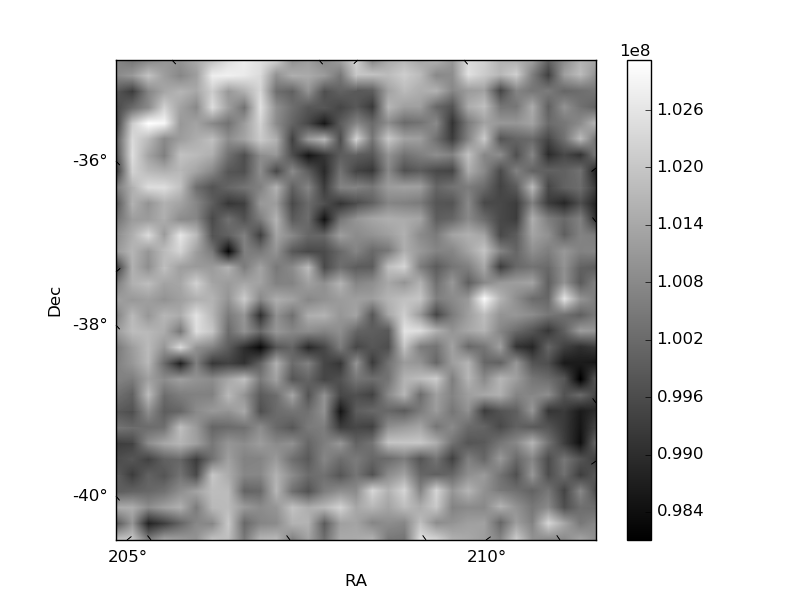
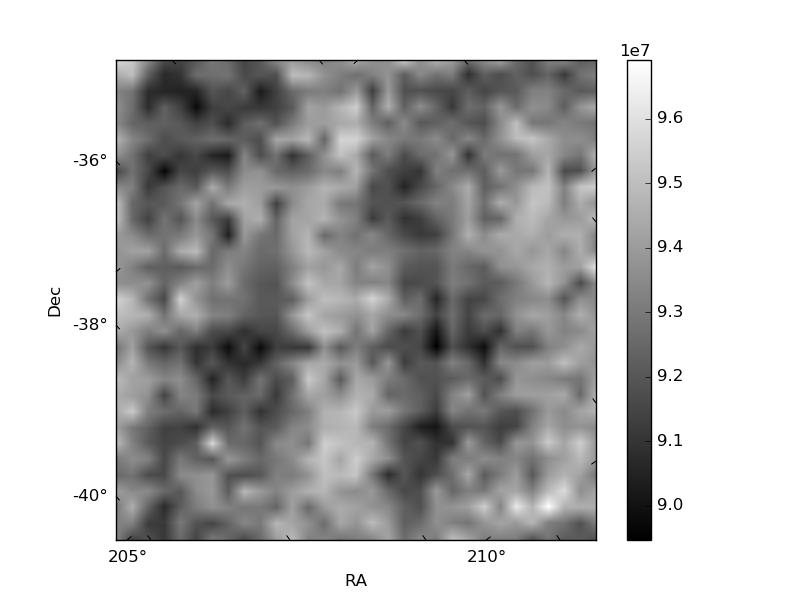
Histogram calculated using DETX and DETY for each event in the final _common_clean file
| Quadrant A | 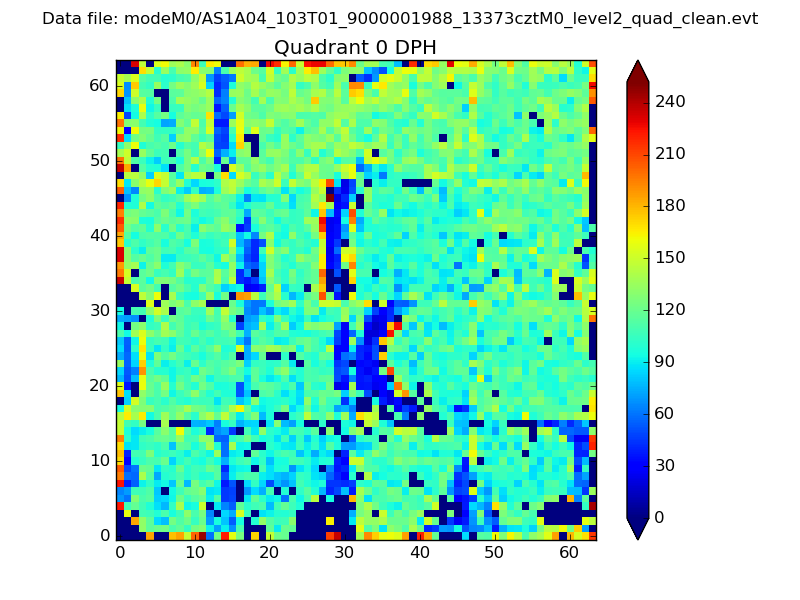 |
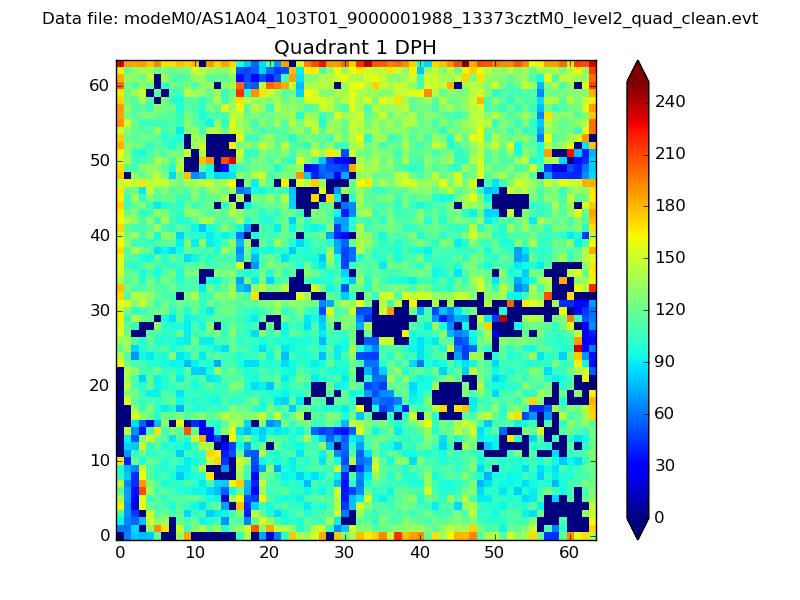 |
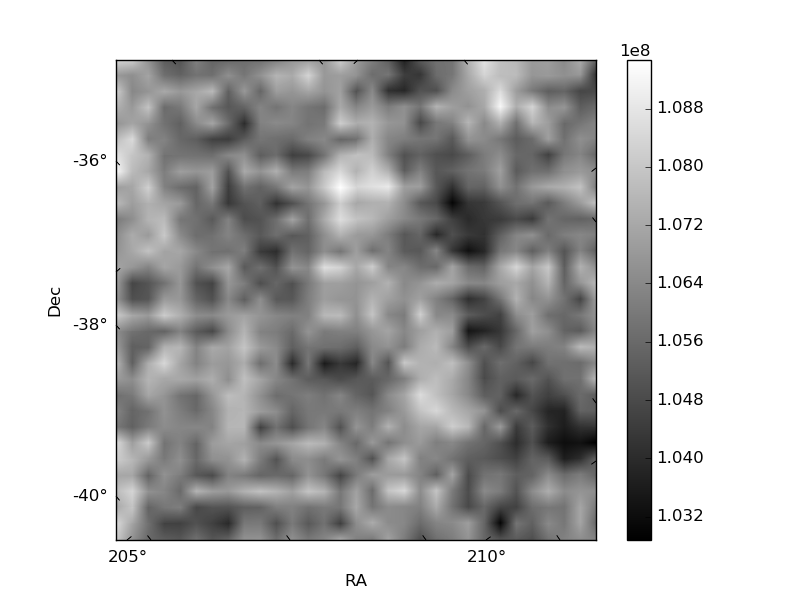
Quadrant B |
|---|---|---|---|
| Quadrant D | 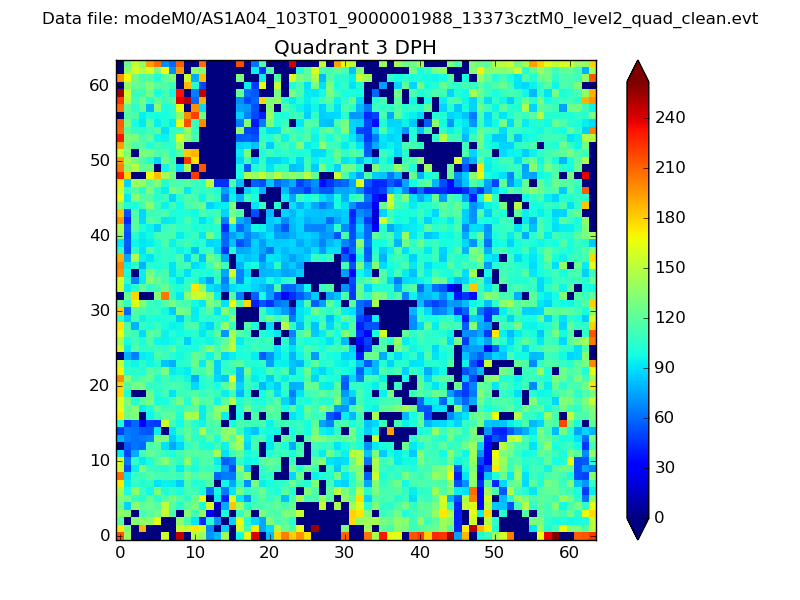 |
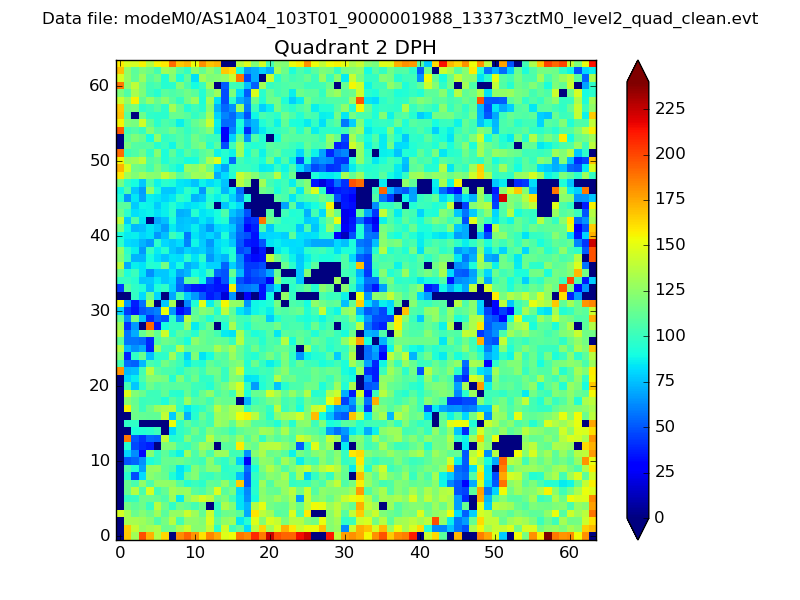 |
Quadrant C |
| Plot type | Count rate plots | Images |
|---|---|---|
| Comparison with Poisson distribution Blue bars denote a histogram of data divided into 1 sec bins. Red curve is a Poisson curve with rate = median count rate of data. |
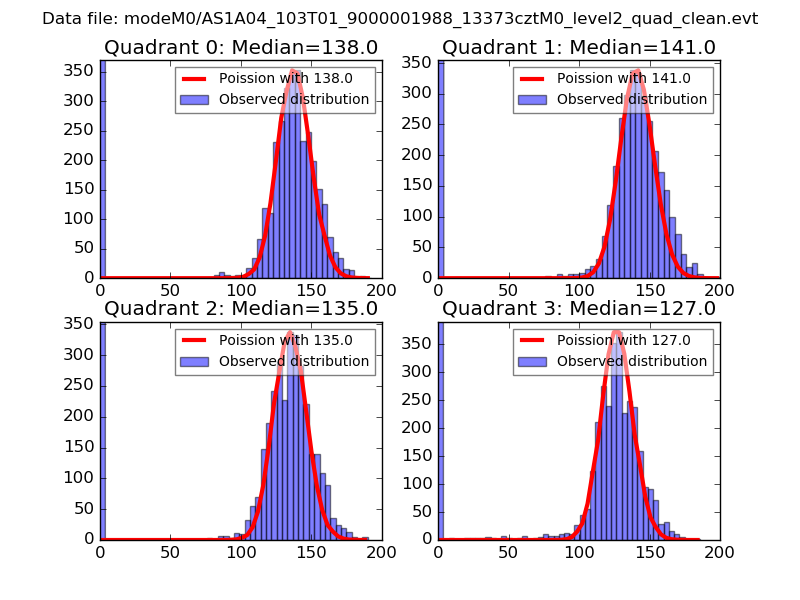 |
 |
| Quadrant-wise count rates Data is divided into 100 sec bins |
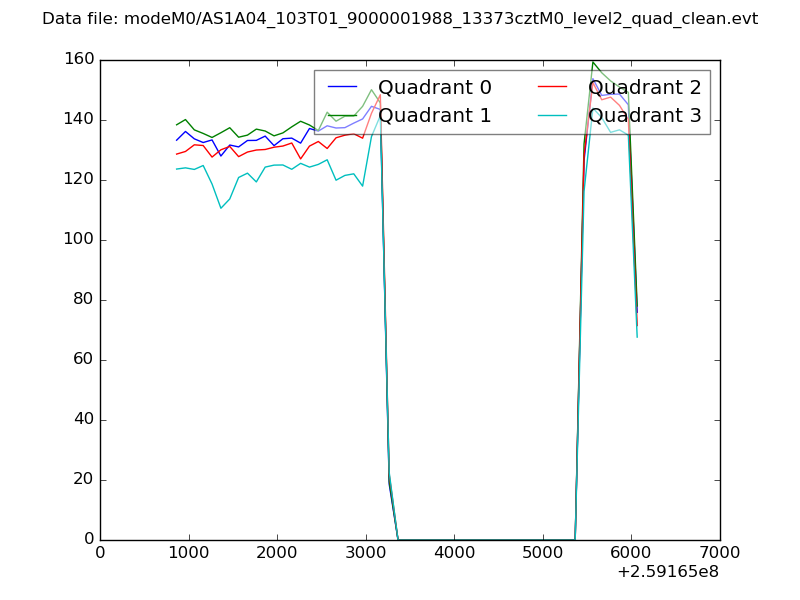 |
|
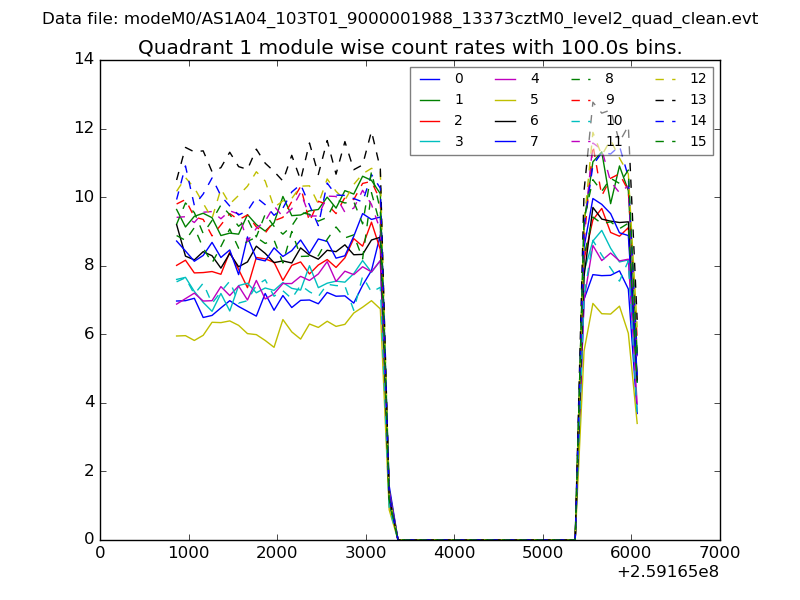
| Module-wise count rates for Quadrant A Data is divided into 100 sec bins |
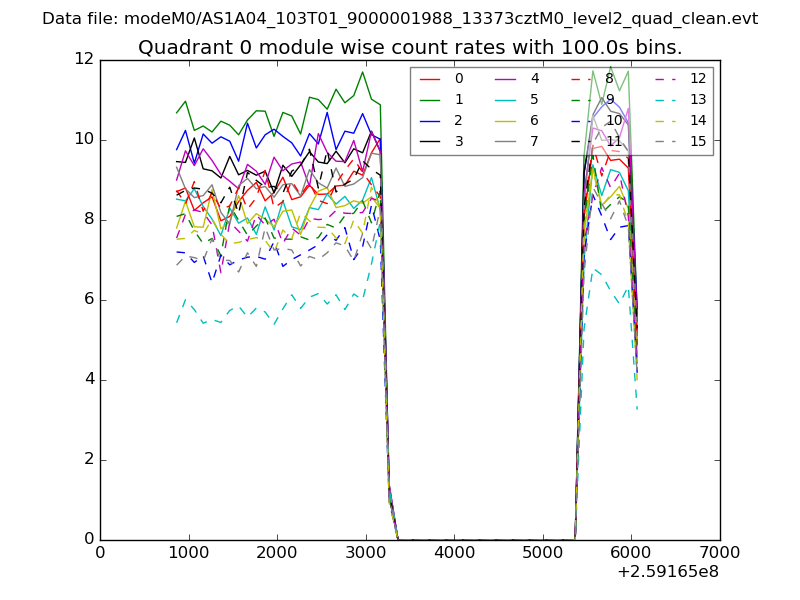 |
 |
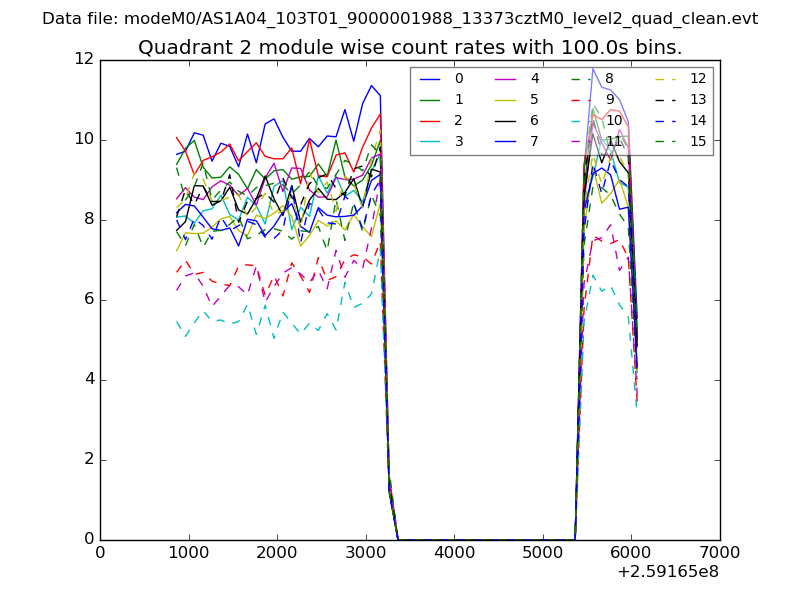
| Module-wise count rates for Quadrant B Data is divided into 100 sec bins |
 |
 |
| Module-wise count rates for Quadrant C Data is divided into 100 sec bins |
 |
 |
| Module-wise count rates for Quadrant D Data is divided into 100 sec bins |
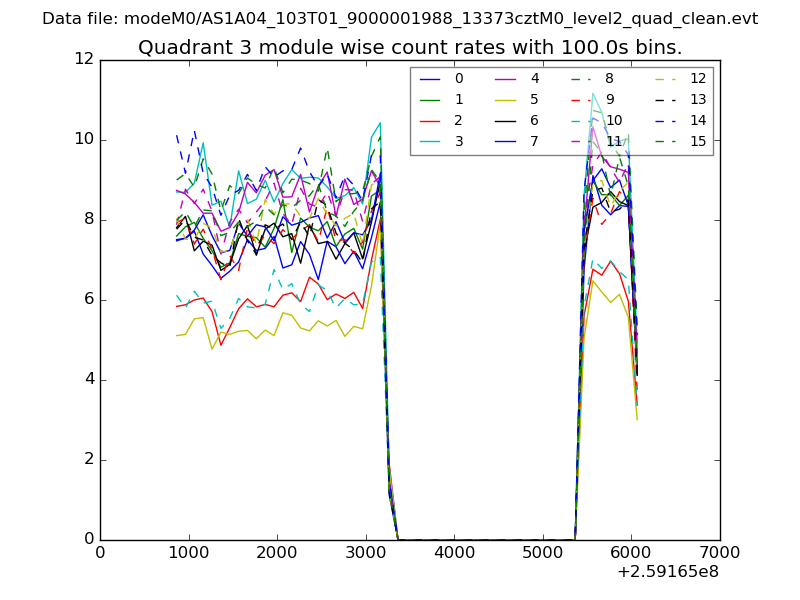 |
 |
| Parameter | Plot |
|---|---|
| CZT HV Monitor | 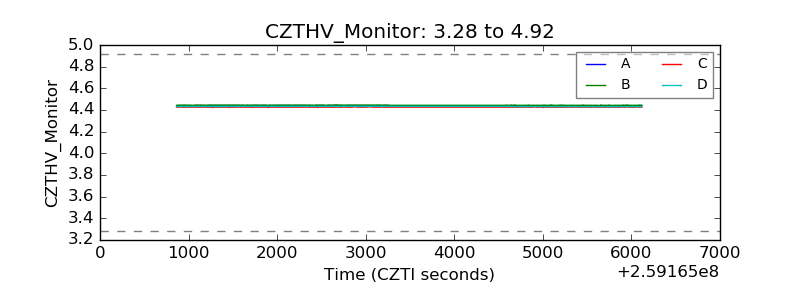 |
| D_VDD | 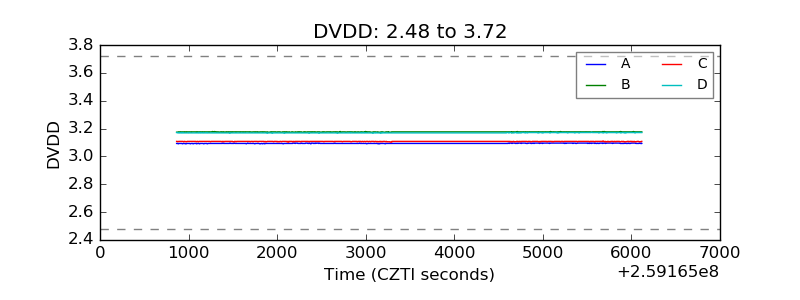 |
| Temperature 1 | 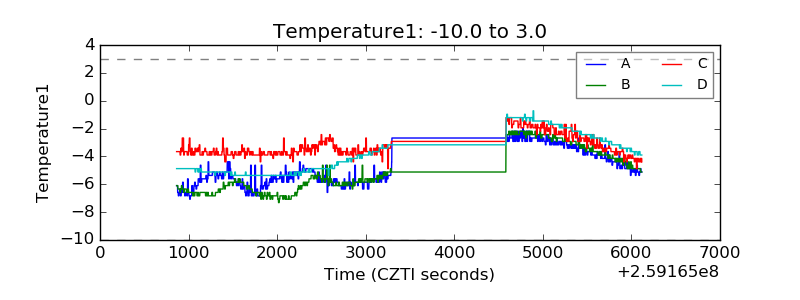 |
| Veto HV Monitor | 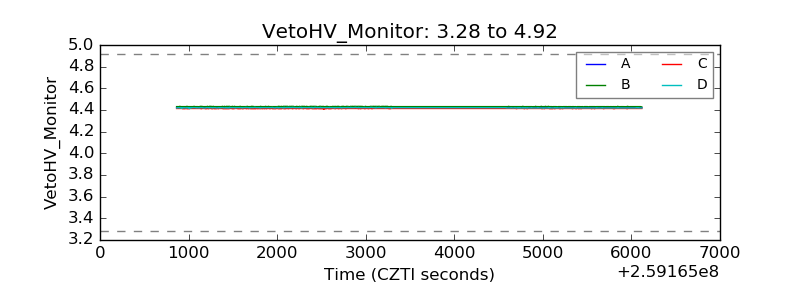 |
| Veto LLD | 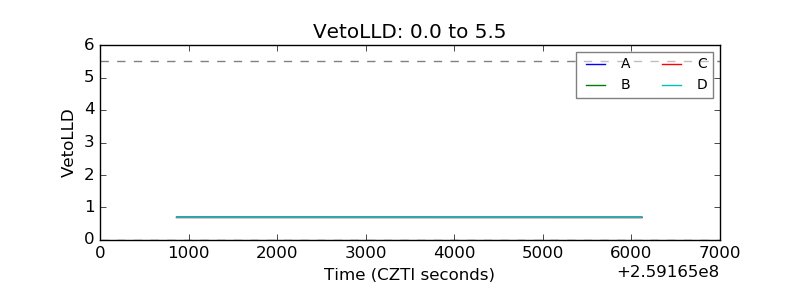 |
| Alpha Counter | 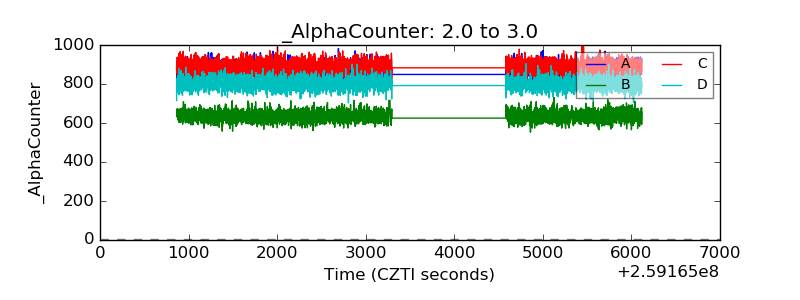 |
| _CPM_Rate | 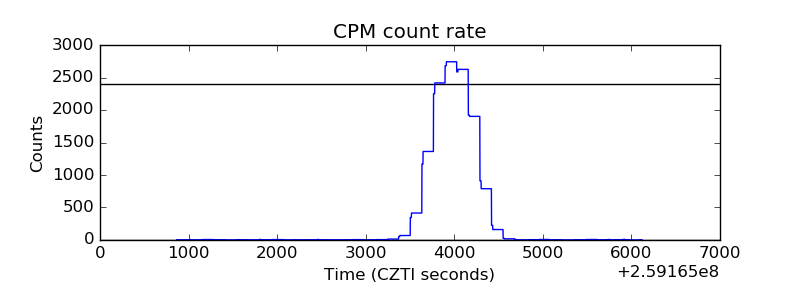 |
| CZT Counter | 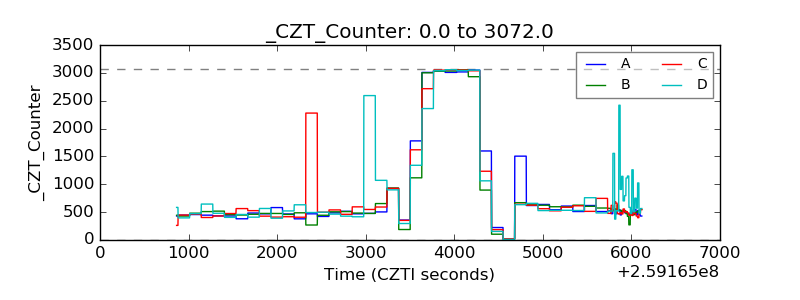 |
| +2.5 Volts monitor |  |
| +5 Volts monitor |  |
| _ROLL_ROT |  |
| _Roll_DEC | 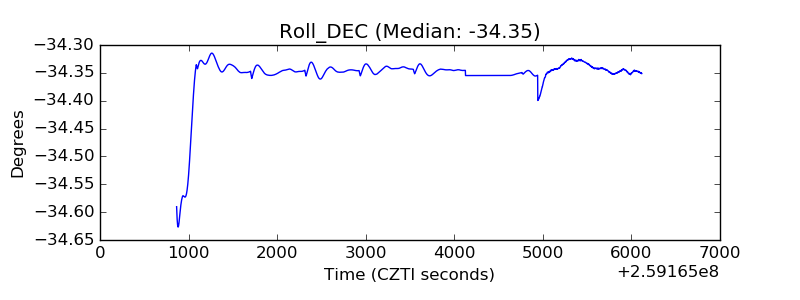 |
| _Roll_RA | 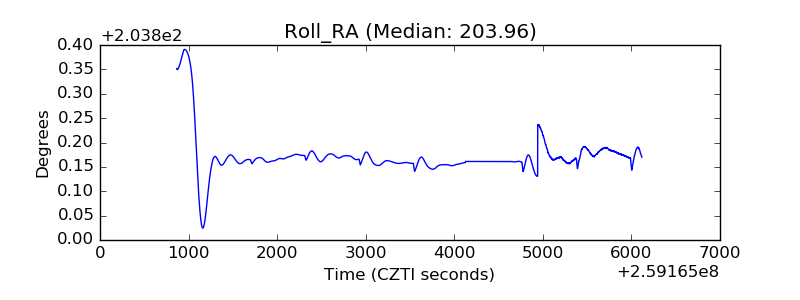 |
| Veto Counter | 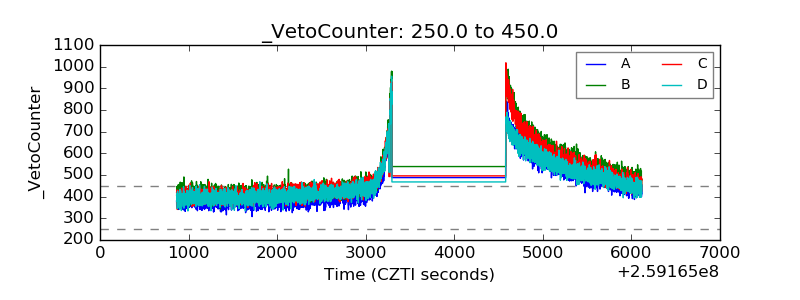 |