| Param | Original file | Final file |
|---|---|---|
| Filename | modeM0/AS1A04_103T01_9000001988_13375cztM0_level2.evt | modeM0/AS1A04_103T01_9000001988_13375cztM0_level2_quad_clean.evt |
| Size (bytes) | 527,100,480 | 100,272,960 |
| Size | 502.7 MB | 95.6 MB |
| Events in quadrant A | 3,126,464 | 665,885 |
| Events in quadrant B | 3,129,392 | 687,127 |
| Events in quadrant C | 3,179,484 | 655,555 |
| Events in quadrant D | 6,111,949 | 599,514 |
| Mode M0 | |||
|---|---|---|---|
| Quadrant | BADHDUFLAG | Total packets | Discarded packets |
| A | 0 | 13174 | 3 |
| B | 0 | 13129 | 2 |
| C | 0 | 13363 | 2 |
| D | 0 | 22412 | 2 |
| Mode SS | |||
|---|---|---|---|
| Quadrant | BADHDUFLAG | Total packets | Discarded packets |
| A | 0 | 124 | 0 |
| B | 0 | 124 | 0 |
| C | 0 | 124 | 0 |
| D | 0 | 124 | 0 |
| Mode M9 | |||
|---|---|---|---|
| Quadrant | BADHDUFLAG | Total packets | Discarded packets |
| A | 0 | 16 | 0 |
| B | 0 | 16 | 0 |
| C | 0 | 16 | 0 |
| D | 0 | 17 | 0 |
| Quadrant | Total seconds | Saturated seconds | Saturation percentage |
|---|---|---|---|
| A | 6143 | 84 | 1.367410% |
| B | 6143 | 83 | 1.351131% |
| C | 6143 | 61 | 0.993000% |
| D | 6143 | 418 | 6.804493% |
Noise dominated data is calculated using 1-second bins in cleaned event files. If a bin has >2000 counts, and if more than 50% of those come from <1% of pixels, then it is considered to be noise-dominated and hence unusable.
| Quadrant | # 1 sec bins | Bins with >0 counts | Bins with >2000 counts | High rate bins dominated by noise | Noise dominated (total time) | Noise dominated (detector-on time) | Marked lightcurve |
|---|---|---|---|---|---|---|---|
| A | 7444 | 6145 | 8 | 8 | 0.11% | 0.13% | 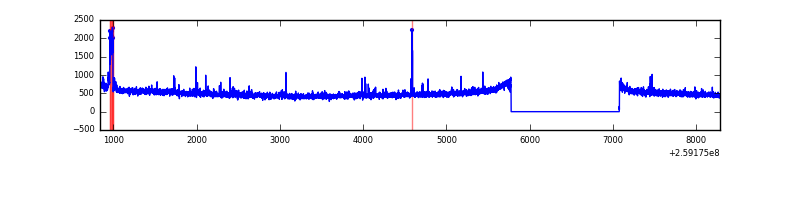 |
| B | 7444 | 6145 | 3 | 3 | 0.04% | 0.05% | 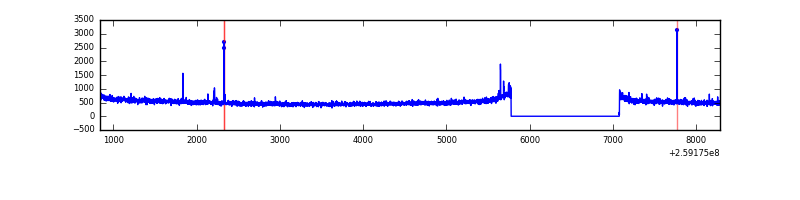 |
| C | 7444 | 6145 | 23 | 23 | 0.31% | 0.37% | 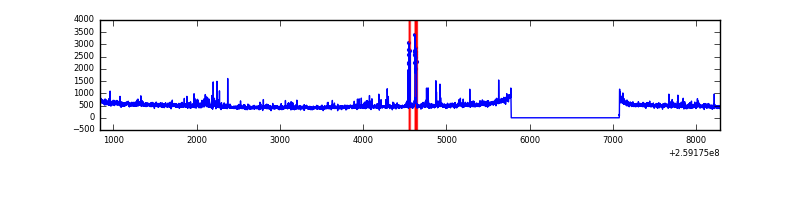 |
| D | 7444 | 6145 | 424 | 424 | 5.70% | 6.90% | 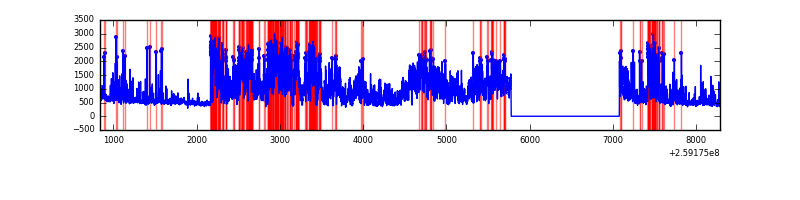 |
Top three noisy pixels from each quadrant. If the there are fewer than three noisy pixels in the level2.evt file, extra rows are filled as -1
| Pixel properties | Quadrant properties | ||||||
|---|---|---|---|---|---|---|---|
| Quadrant | DetID | PixID | Counts | Sigma | Mean | Median | Sigma |
| A | 9 | 143 | 102859 | 647.93 | 779 | 766 | 157.6 |
| A | 1 | 162 | 14260 | 85.64 | 779 | 766 | 157.6 |
| A | 0 | 226 | 7077 | 40.05 | 779 | 766 | 157.6 |
| B | 3 | 64 | 19025 | 124.22 | 788 | 770 | 147.0 |
| B | 12 | 111 | 16298 | 105.66 | 788 | 770 | 147.0 |
| B | 11 | 111 | 14057 | 90.41 | 788 | 770 | 147.0 |
| C | 14 | 220 | 188159 | 1084.74 | 753 | 758 | 172.8 |
| C | 3 | 233 | 54051 | 308.48 | 753 | 758 | 172.8 |
| C | 13 | 61 | 5525 | 27.59 | 753 | 758 | 172.8 |
| D | 1 | 52 | 2755365 | 16033.91 | 727 | 708 | 171.8 |
| D | 14 | 34 | 258162 | 1498.55 | 727 | 708 | 171.8 |
| D | 13 | 249 | 217651 | 1262.75 | 727 | 708 | 171.8 |
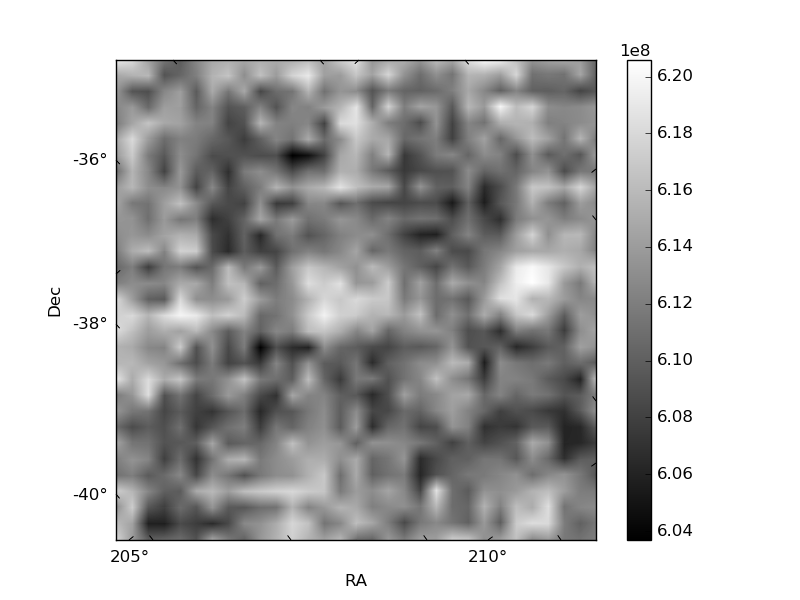
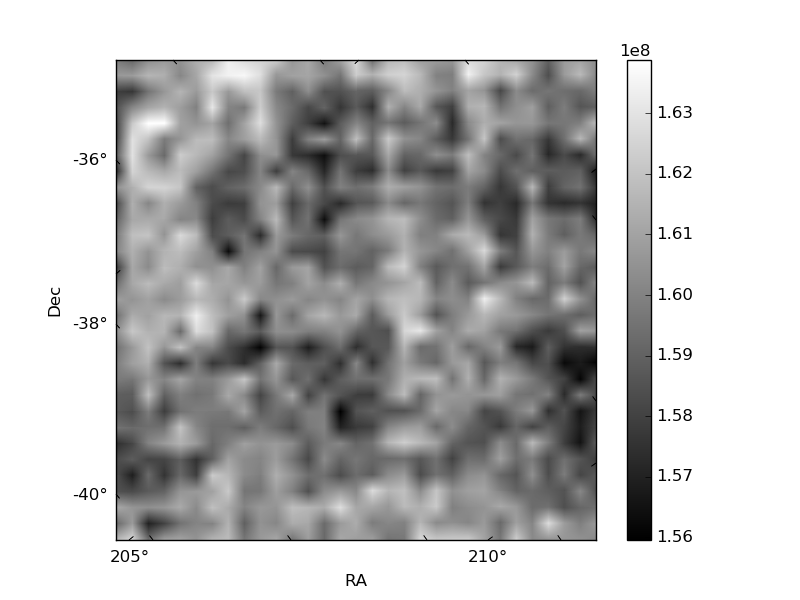
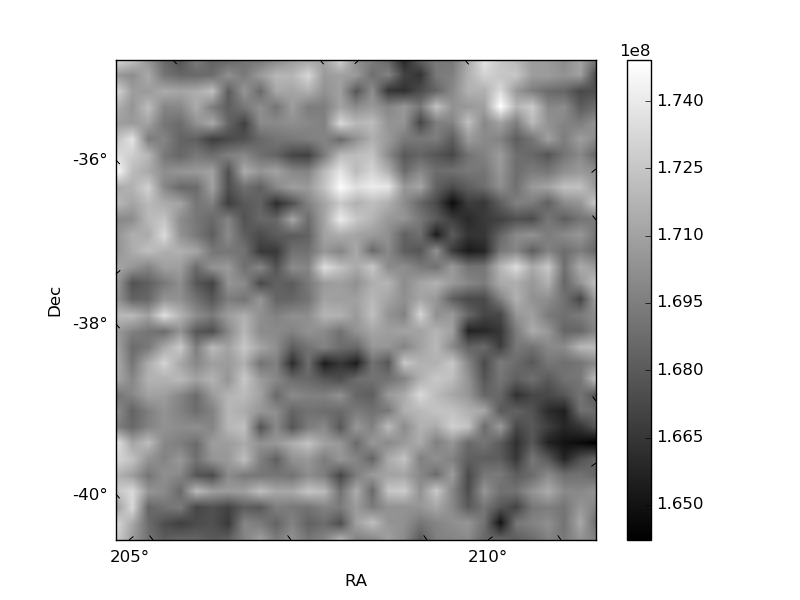
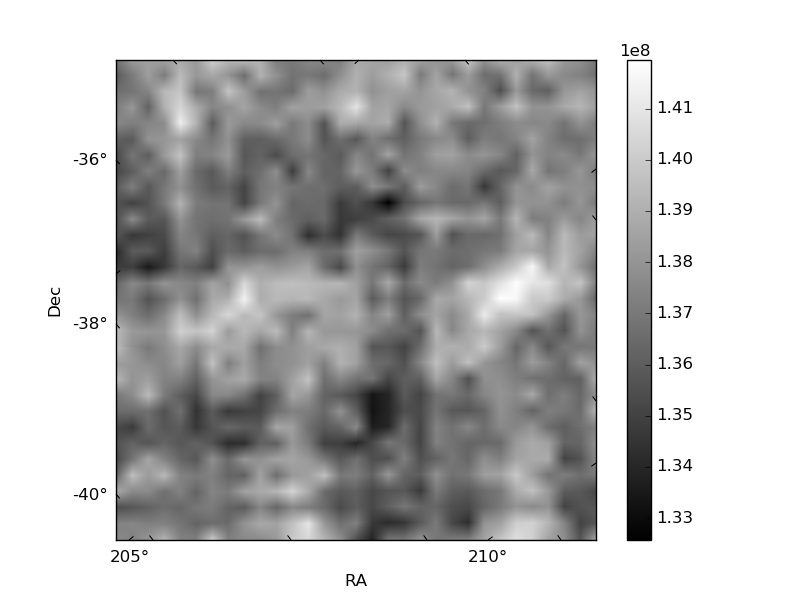
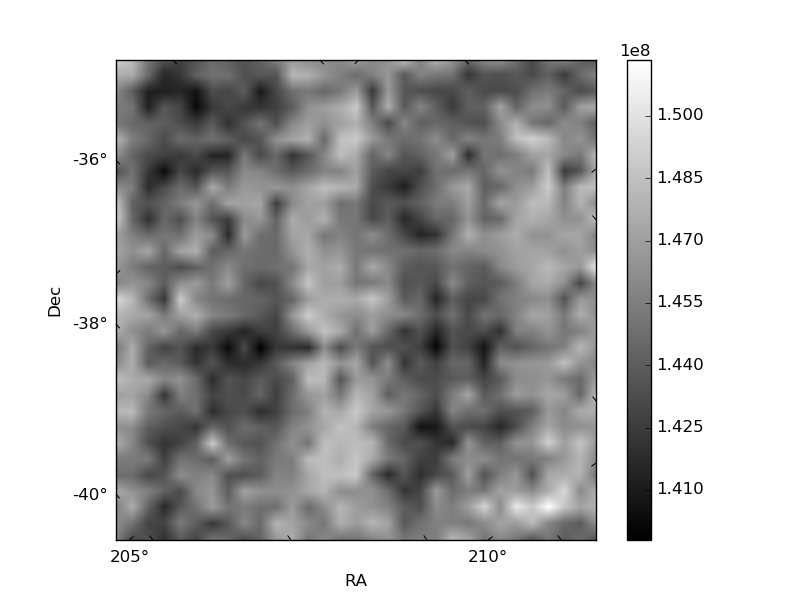
Histogram calculated using DETX and DETY for each event in the final _common_clean file
| Quadrant A | 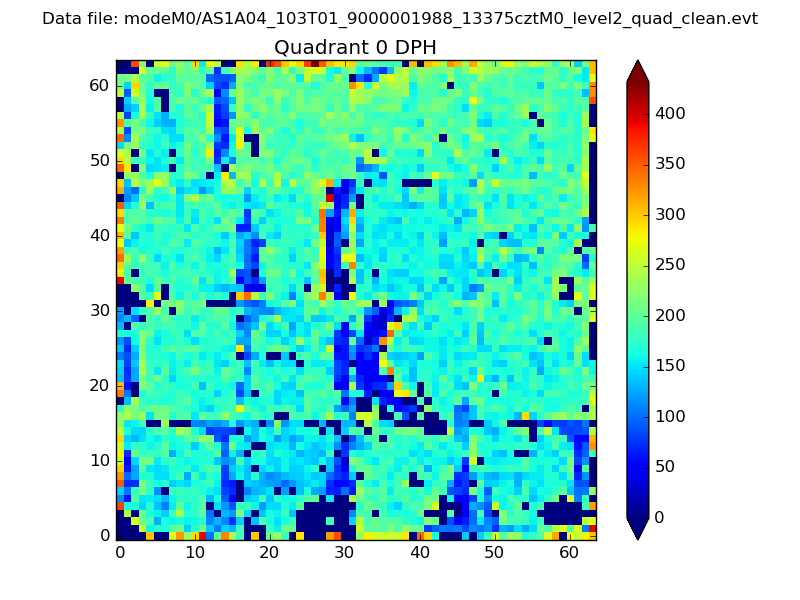 |
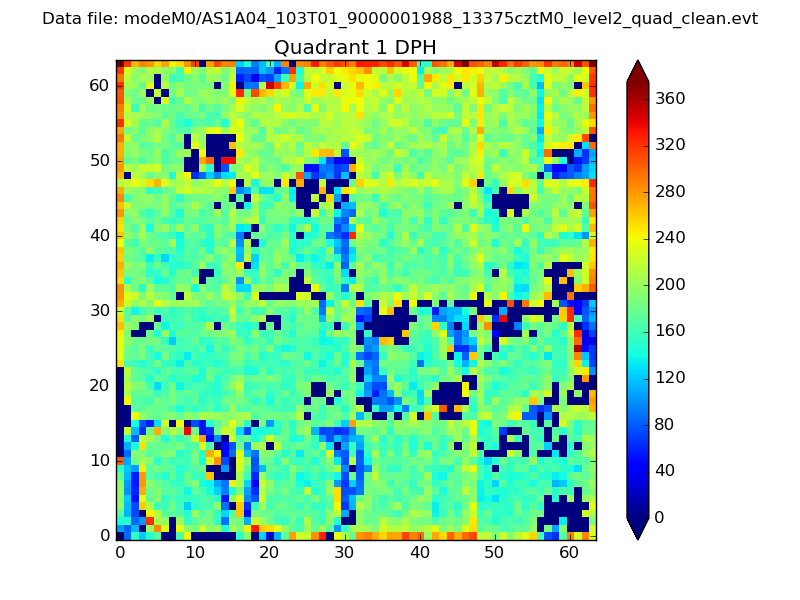 |
Quadrant B |
|---|---|---|---|
| Quadrant D |  |
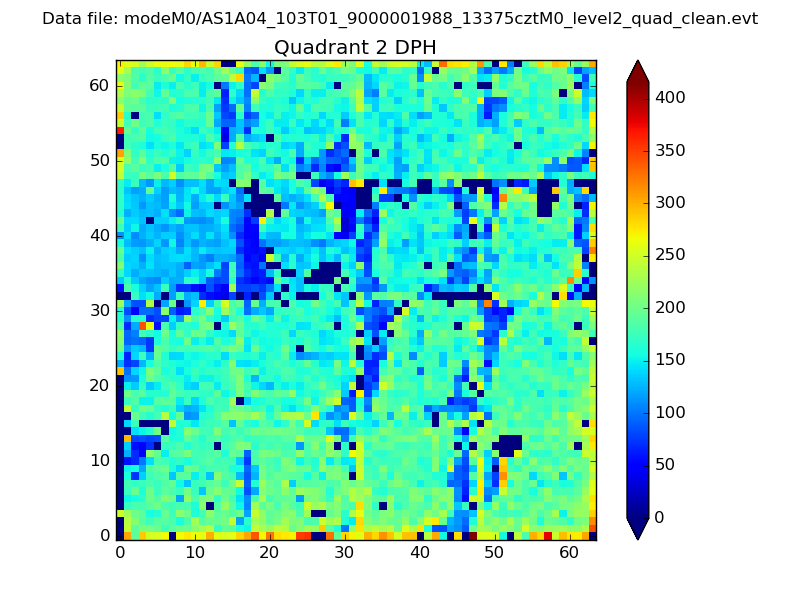 |
Quadrant C |
| Plot type | Count rate plots | Images |
|---|---|---|
| Comparison with Poisson distribution Blue bars denote a histogram of data divided into 1 sec bins. Red curve is a Poisson curve with rate = median count rate of data. |
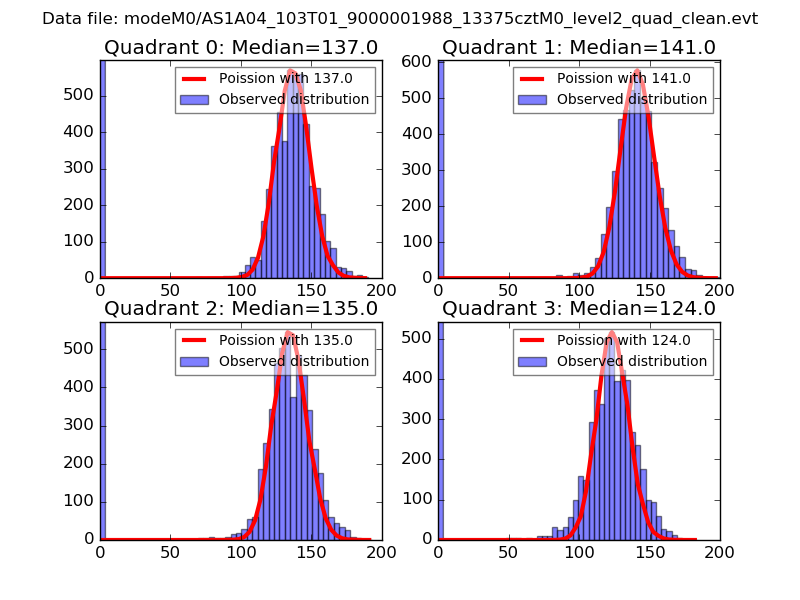 |
 |
| Quadrant-wise count rates Data is divided into 100 sec bins |
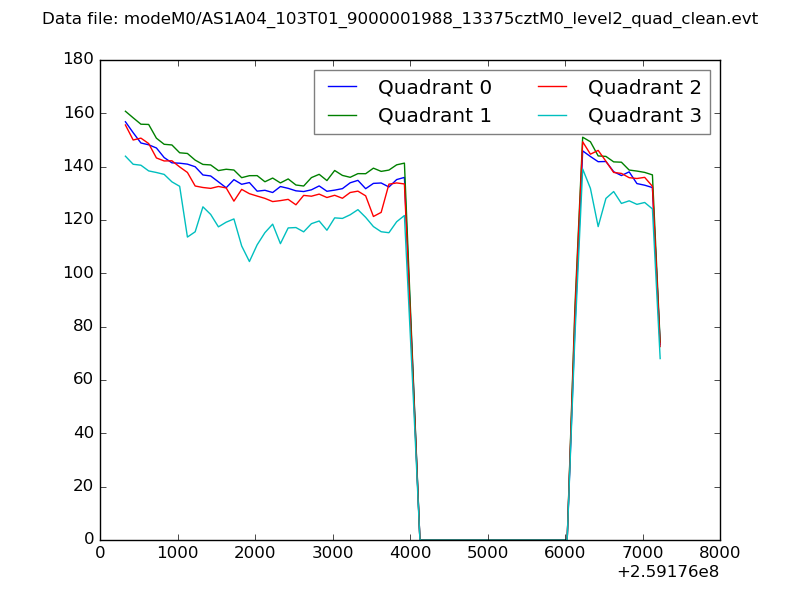 |
|
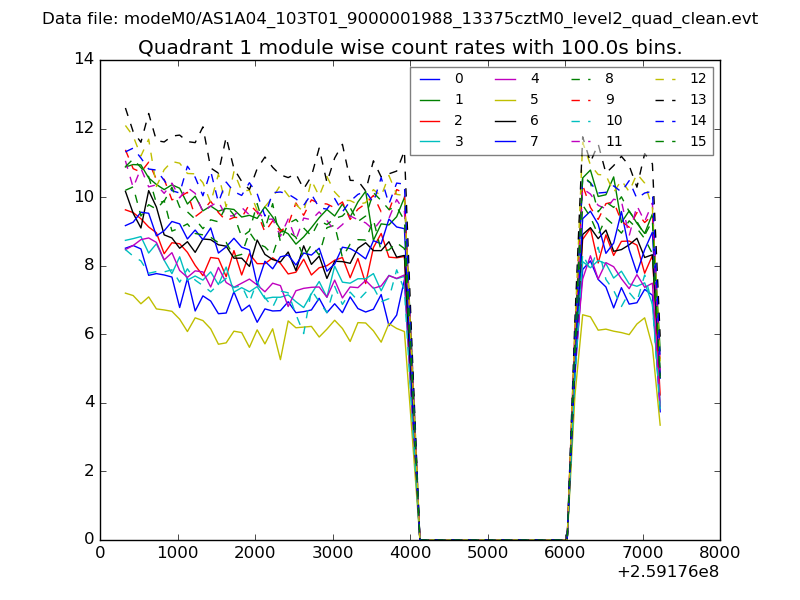
| Module-wise count rates for Quadrant A Data is divided into 100 sec bins |
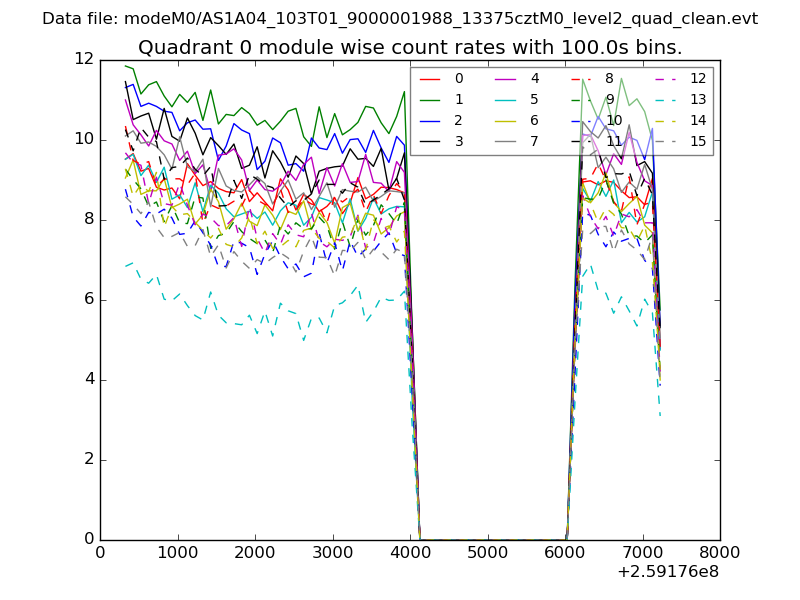 |
 |
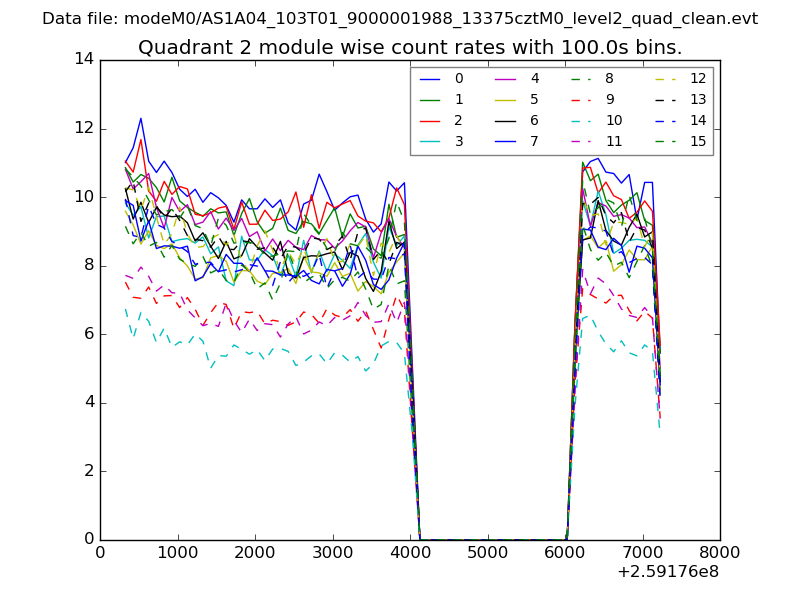
| Module-wise count rates for Quadrant B Data is divided into 100 sec bins |
 |
 |
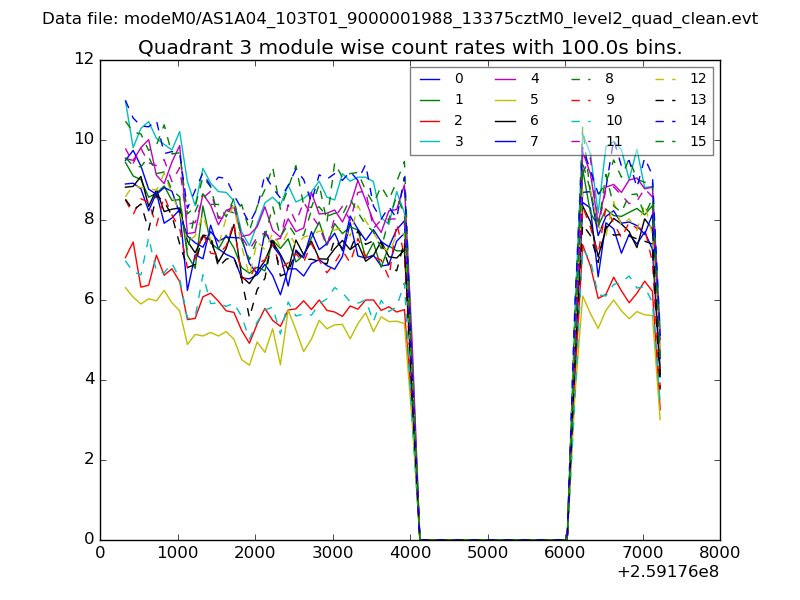
| Module-wise count rates for Quadrant C Data is divided into 100 sec bins |
 |
 |
| Module-wise count rates for Quadrant D Data is divided into 100 sec bins |
 |
 |
| Parameter | Plot |
|---|---|
| CZT HV Monitor | 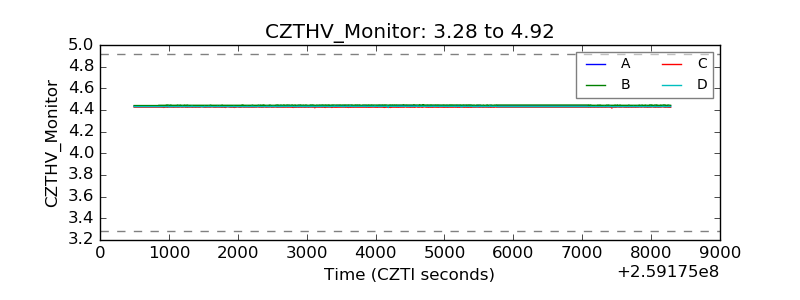 |
| D_VDD | 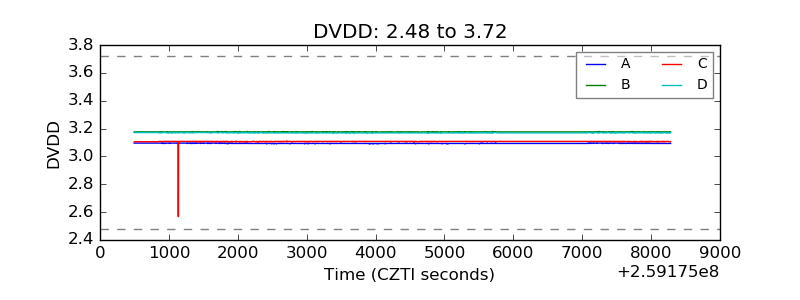 |
| Temperature 1 | 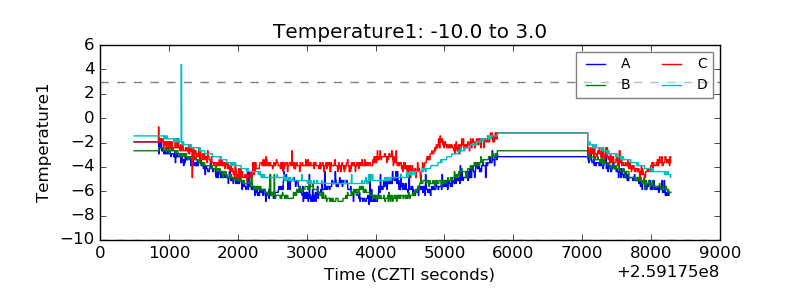 |
| Veto HV Monitor | 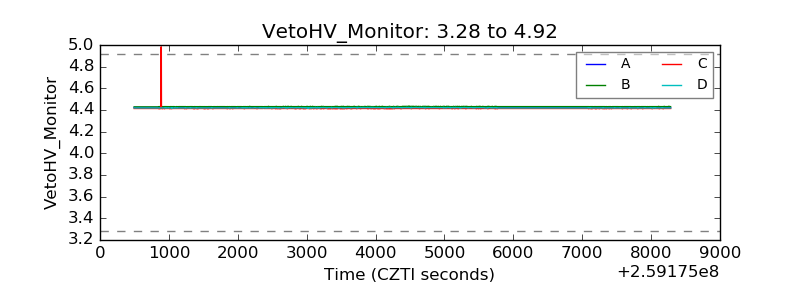 |
| Veto LLD | 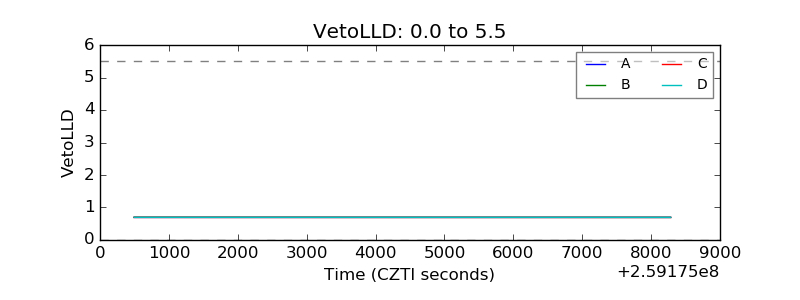 |
| Alpha Counter | 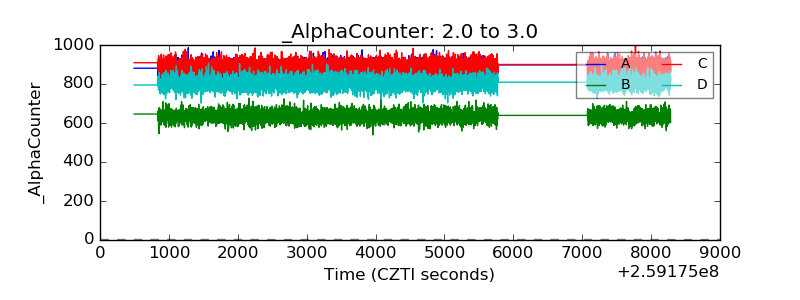 |
| _CPM_Rate | 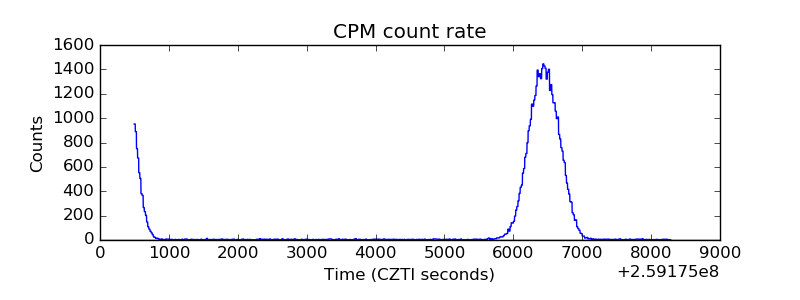 |
| CZT Counter | 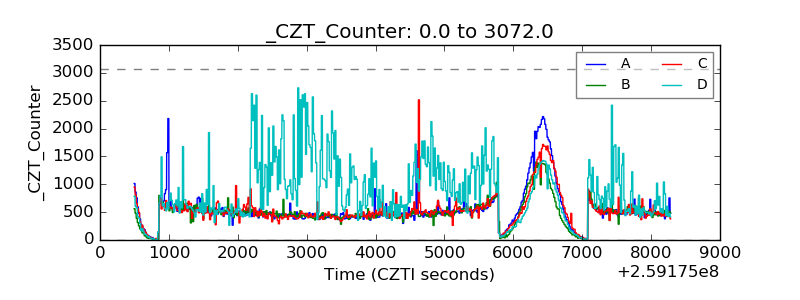 |
| +2.5 Volts monitor |  |
| +5 Volts monitor |  |
| _ROLL_ROT | 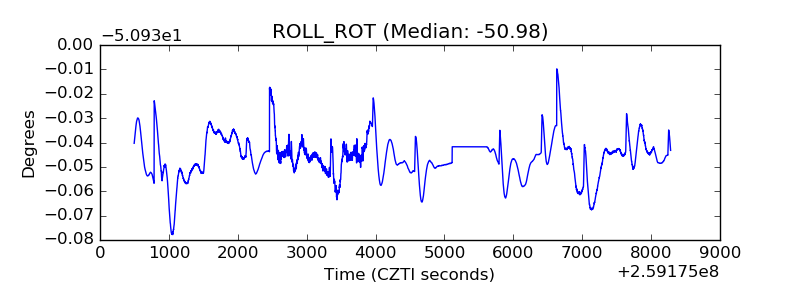 |
| _Roll_DEC | 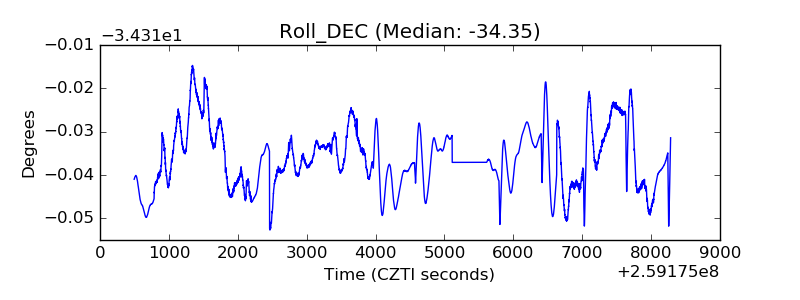 |
| _Roll_RA | 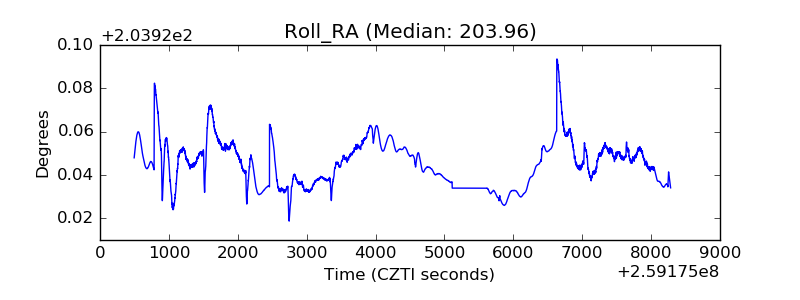 |
| Veto Counter | 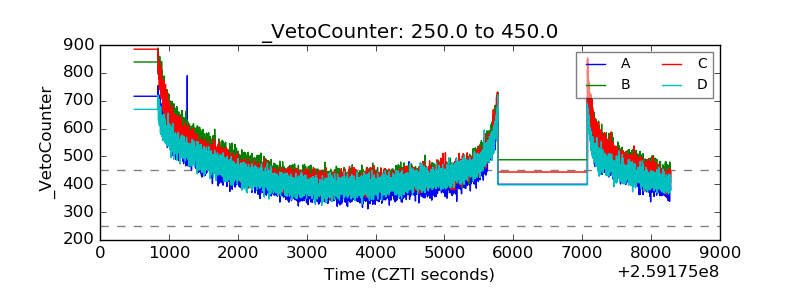 |