| Param | Original file | Final file |
|---|---|---|
| Filename | modeM0/AS1A04_103T01_9000001988_13376cztM0_level2.evt | modeM0/AS1A04_103T01_9000001988_13376cztM0_level2_quad_clean.evt |
| Size (bytes) | 578,113,920 | 106,787,520 |
| Size | 551.3 MB | 101.8 MB |
| Events in quadrant A | 3,440,885 | 701,967 |
| Events in quadrant B | 3,555,285 | 721,990 |
| Events in quadrant C | 3,497,603 | 697,522 |
| Events in quadrant D | 6,542,343 | 627,084 |
| Mode M0 | |||
|---|---|---|---|
| Quadrant | BADHDUFLAG | Total packets | Discarded packets |
| A | 0 | 14941 | 3 |
| B | 0 | 15129 | 2 |
| C | 0 | 15021 | 2 |
| D | 0 | 24392 | 2 |
| Mode SS | |||
|---|---|---|---|
| Quadrant | BADHDUFLAG | Total packets | Discarded packets |
| A | 0 | 144 | 0 |
| B | 0 | 144 | 0 |
| C | 0 | 144 | 0 |
| D | 0 | 144 | 0 |
| Mode M9 | |||
|---|---|---|---|
| Quadrant | BADHDUFLAG | Total packets | Discarded packets |
| A | 0 | 24 | 0 |
| B | 0 | 24 | 0 |
| C | 0 | 24 | 0 |
| D | 0 | 24 | 0 |
| Quadrant | Total seconds | Saturated seconds | Saturation percentage |
|---|---|---|---|
| A | 6967 | 98 | 1.406631% |
| B | 6967 | 116 | 1.664992% |
| C | 6967 | 40 | 0.574135% |
| D | 6967 | 595 | 8.540261% |
Noise dominated data is calculated using 1-second bins in cleaned event files. If a bin has >2000 counts, and if more than 50% of those come from <1% of pixels, then it is considered to be noise-dominated and hence unusable.
| Quadrant | # 1 sec bins | Bins with >0 counts | Bins with >2000 counts | High rate bins dominated by noise | Noise dominated (total time) | Noise dominated (detector-on time) | Marked lightcurve |
|---|---|---|---|---|---|---|---|
| A | 9388 | 6970 | 26 | 26 | 0.28% | 0.37% | 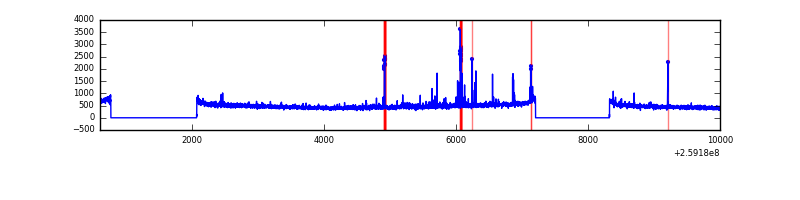 |
| B | 9388 | 6970 | 8 | 8 | 0.09% | 0.11% | 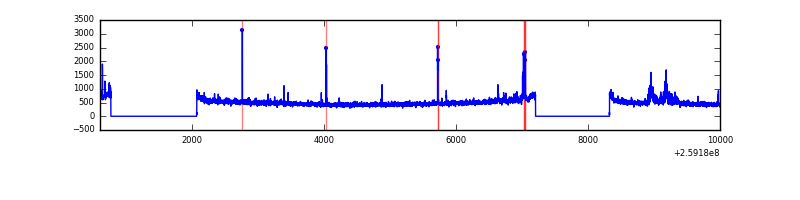 |
| C | 9388 | 6970 | 4 | 4 | 0.04% | 0.06% | 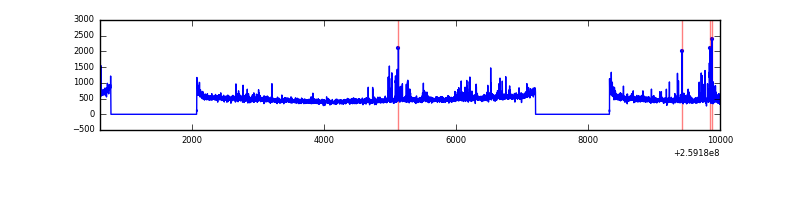 |
| D | 9388 | 6970 | 513 | 513 | 5.46% | 7.36% | 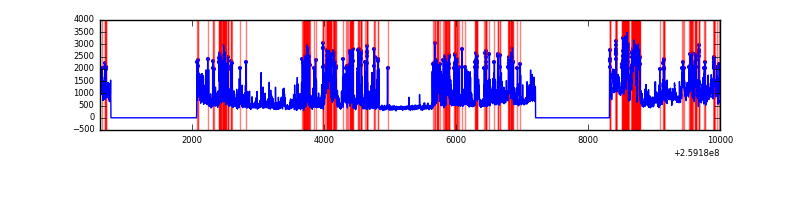 |
Top three noisy pixels from each quadrant. If the there are fewer than three noisy pixels in the level2.evt file, extra rows are filled as -1
| Pixel properties | Quadrant properties | ||||||
|---|---|---|---|---|---|---|---|
| Quadrant | DetID | PixID | Counts | Sigma | Mean | Median | Sigma |
| A | 9 | 143 | 140979 | 815.98 | 850 | 833 | 171.8 |
| A | 1 | 162 | 12993 | 70.8 | 850 | 833 | 171.8 |
| A | 15 | 69 | 11707 | 63.31 | 850 | 833 | 171.8 |
| B | 10 | 244 | 82895 | 505.95 | 860 | 841 | 162.2 |
| B | 3 | 64 | 60148 | 365.69 | 860 | 841 | 162.2 |
| B | 0 | 214 | 20302 | 120.0 | 860 | 841 | 162.2 |
| C | 14 | 220 | 189611 | 983.1 | 830 | 834 | 192.0 |
| C | 3 | 233 | 70642 | 363.54 | 830 | 834 | 192.0 |
| C | 13 | 61 | 6238 | 28.14 | 830 | 834 | 192.0 |
| D | 1 | 52 | 3085303 | 16390.19 | 789 | 765 | 188.2 |
| D | 14 | 34 | 262619 | 1391.4 | 789 | 765 | 188.2 |
| D | 5 | 222 | 76923 | 404.68 | 789 | 765 | 188.2 |
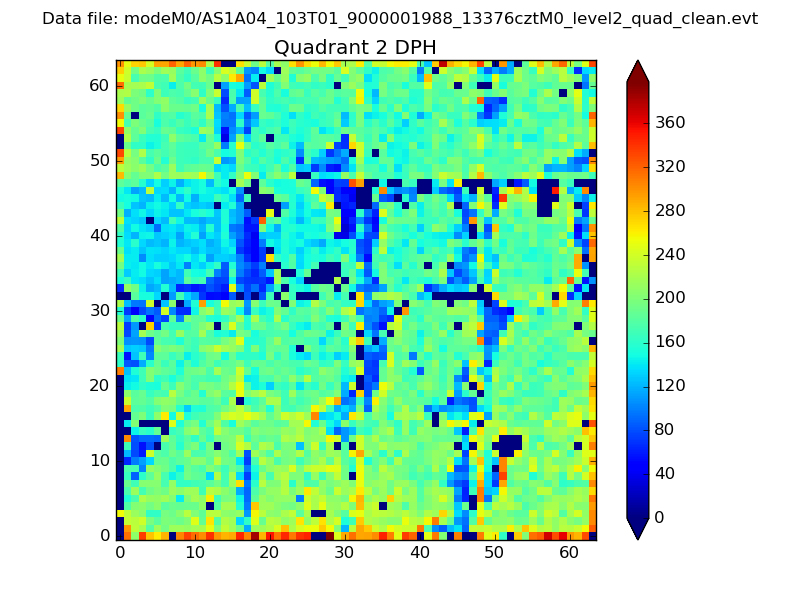
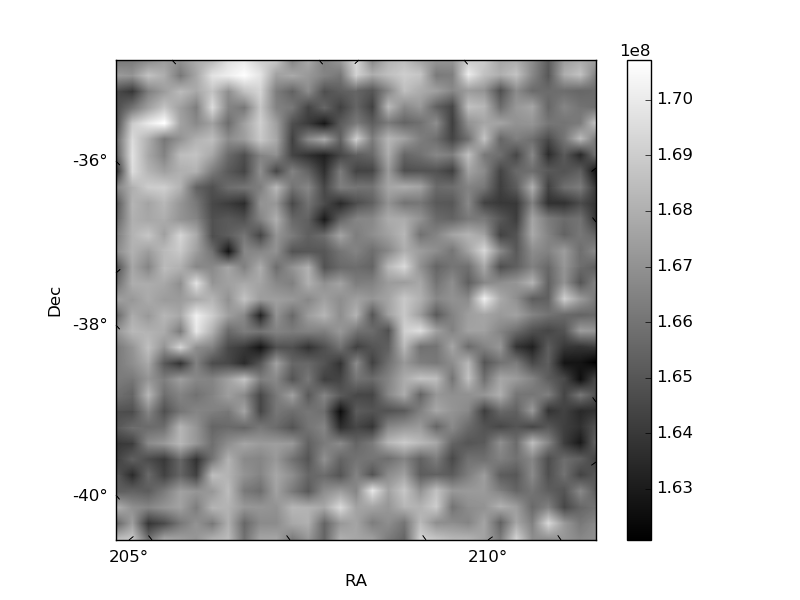
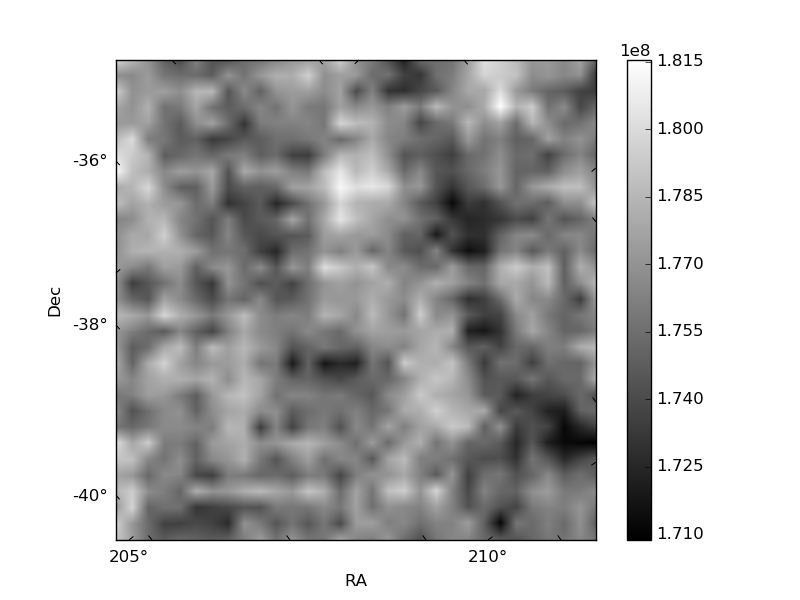
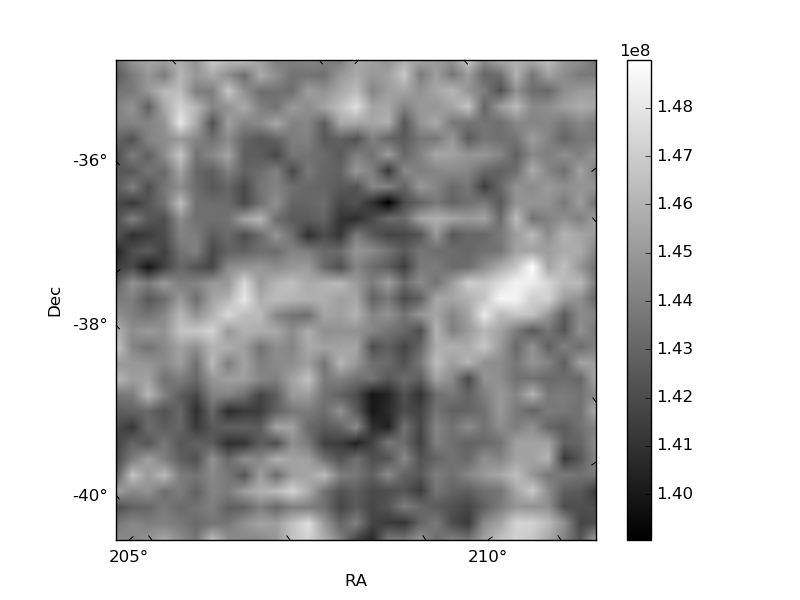
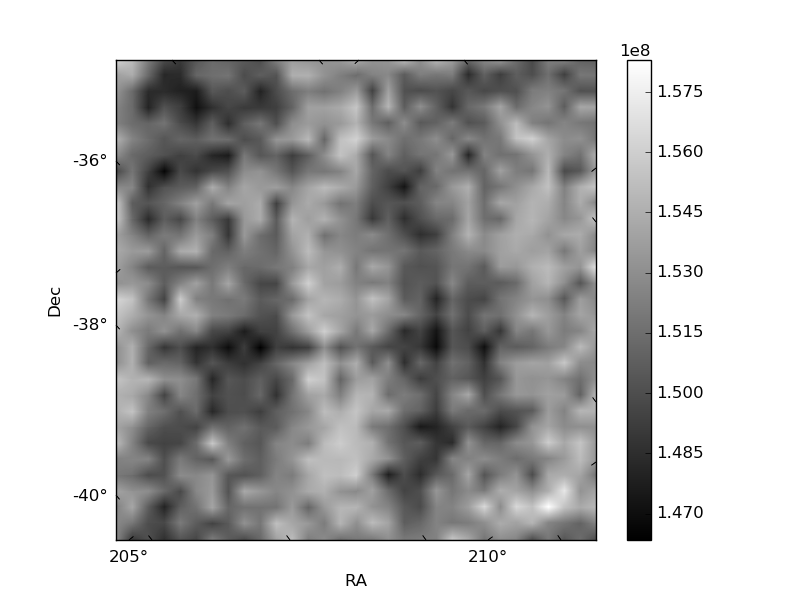
Histogram calculated using DETX and DETY for each event in the final _common_clean file
| Quadrant A | 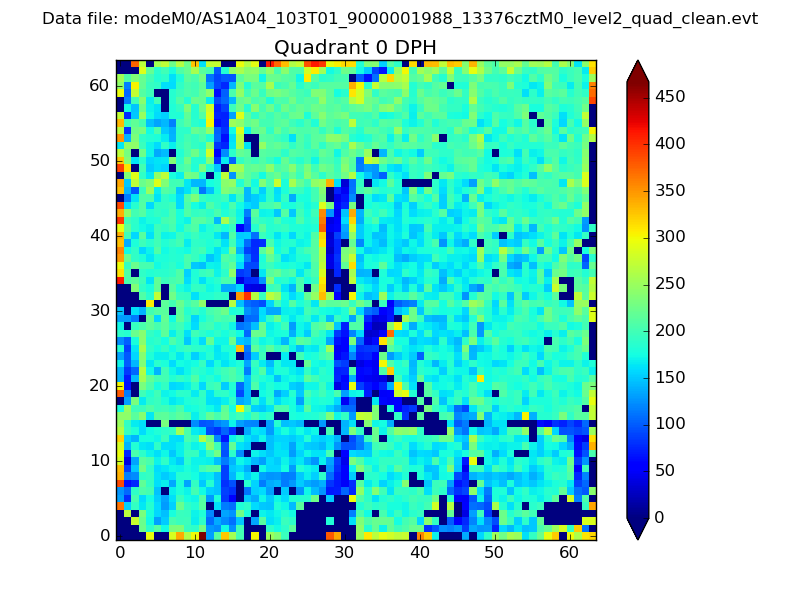 |
 |
Quadrant B |
|---|---|---|---|
| Quadrant D |  |
 |
Quadrant C |
| Plot type | Count rate plots | Images |
|---|---|---|
| Comparison with Poisson distribution Blue bars denote a histogram of data divided into 1 sec bins. Red curve is a Poisson curve with rate = median count rate of data. |
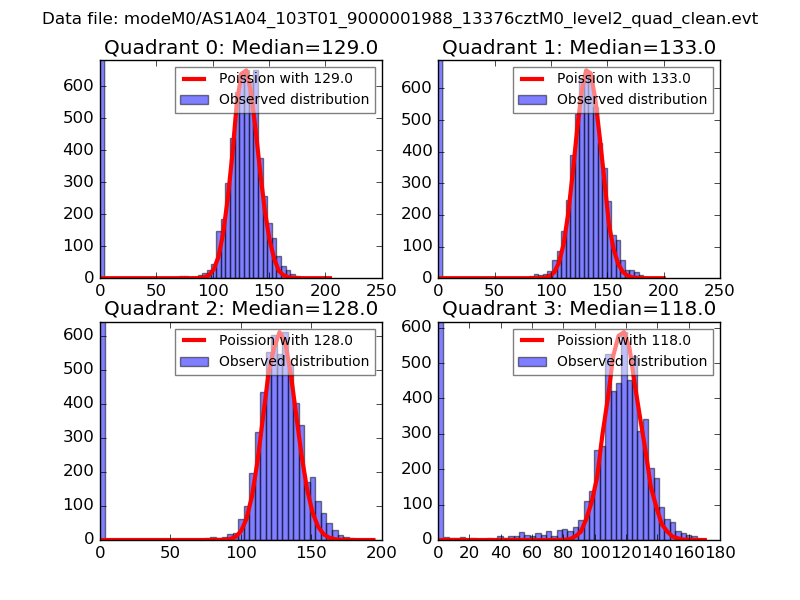 |
 |
| Quadrant-wise count rates Data is divided into 100 sec bins |
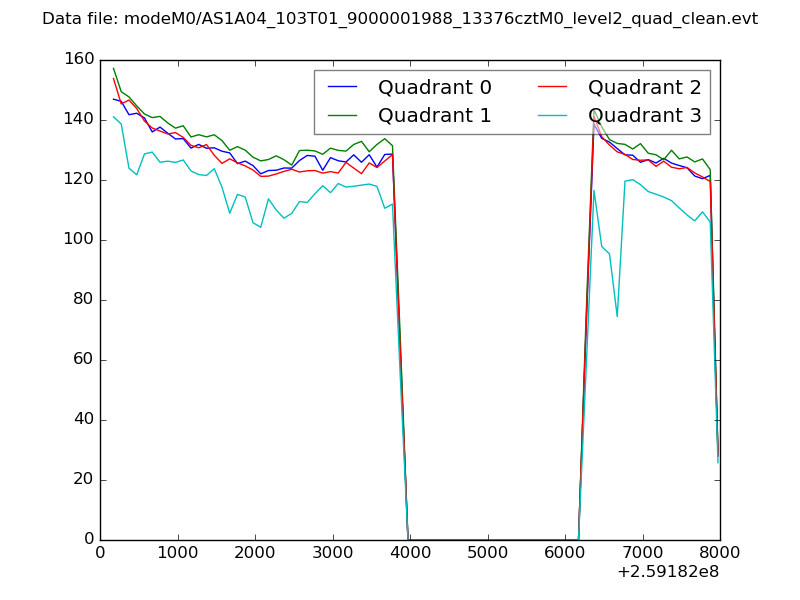 |
|
| Module-wise count rates for Quadrant A Data is divided into 100 sec bins |
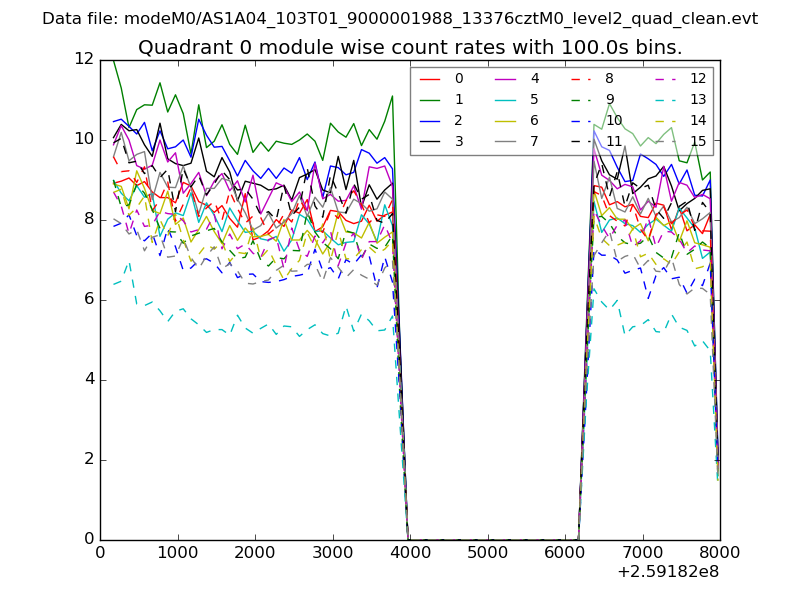 |
 |
| Module-wise count rates for Quadrant B Data is divided into 100 sec bins |
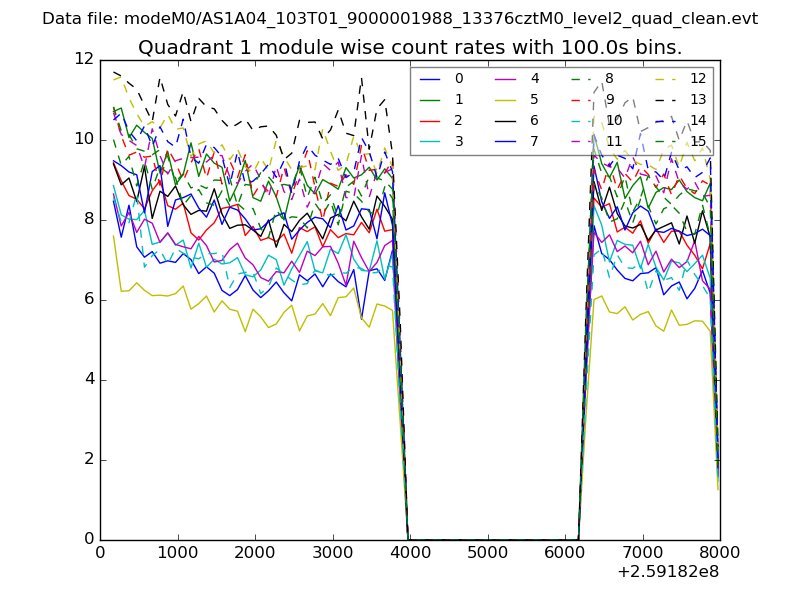 |
 |
| Module-wise count rates for Quadrant C Data is divided into 100 sec bins |
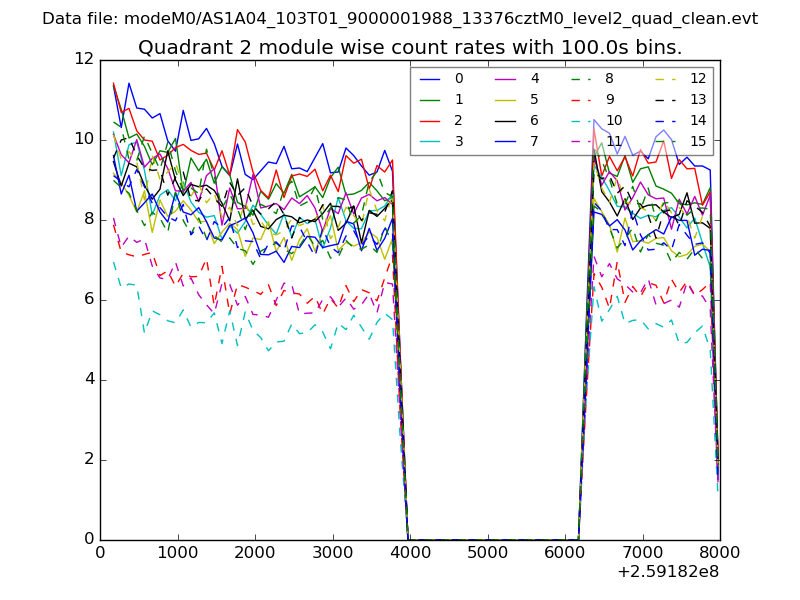 |
 |
| Module-wise count rates for Quadrant D Data is divided into 100 sec bins |
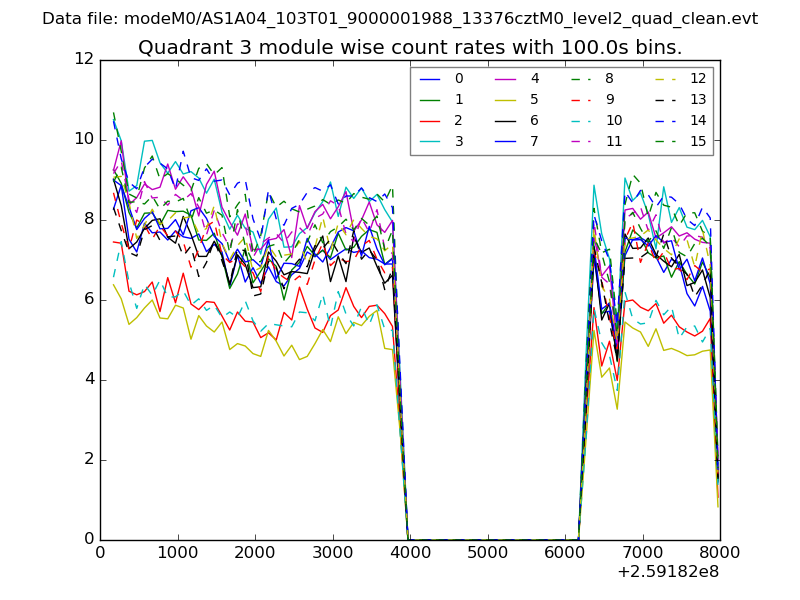 |
 |
| Parameter | Plot |
|---|---|
| CZT HV Monitor | 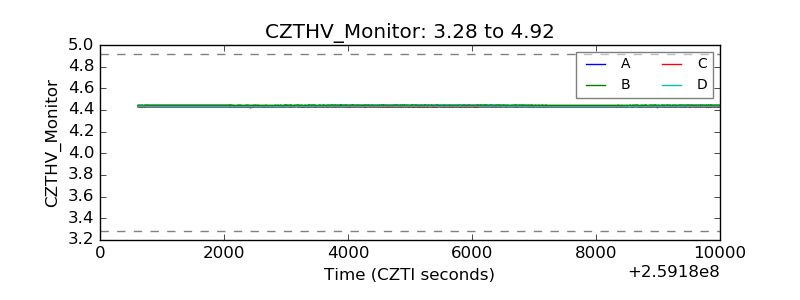 |
| D_VDD | 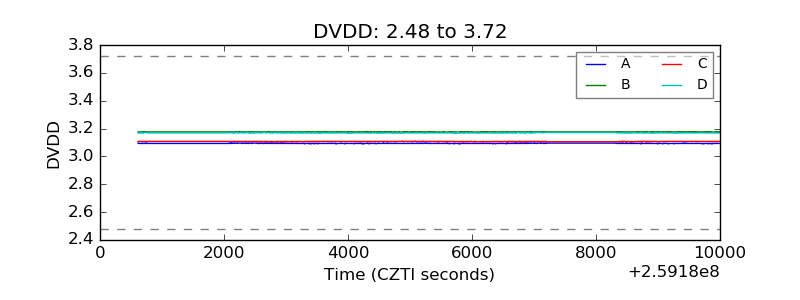 |
| Temperature 1 | 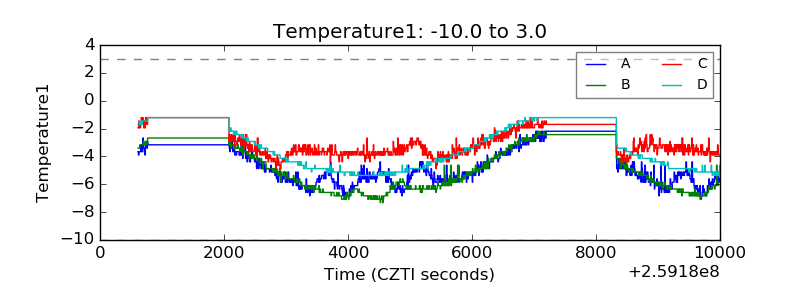 |
| Veto HV Monitor | 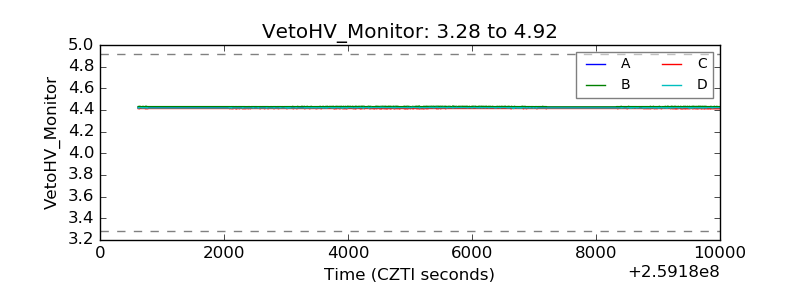 |
| Veto LLD | 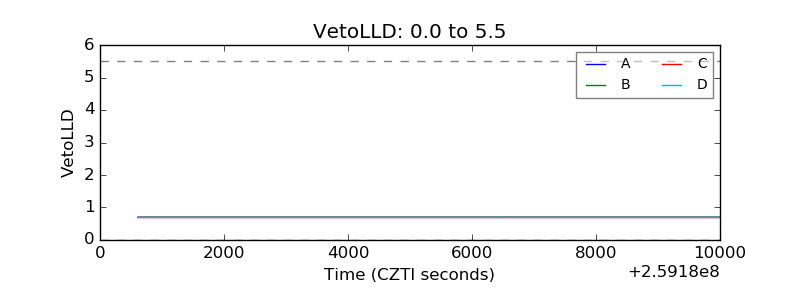 |
| Alpha Counter | 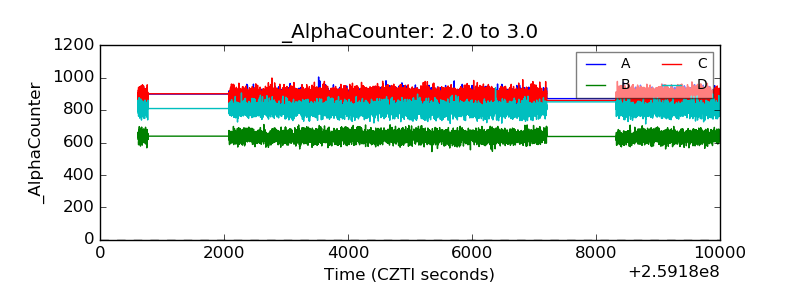 |
| _CPM_Rate | 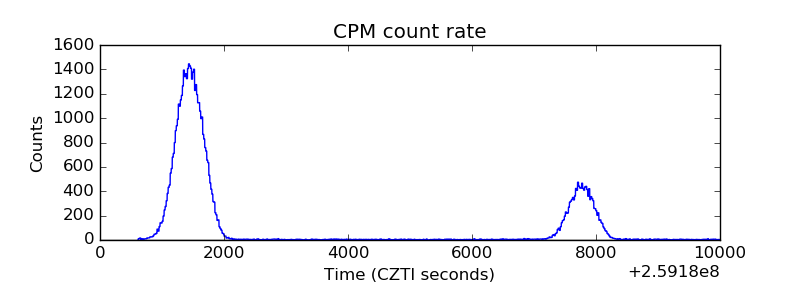 |
| CZT Counter | 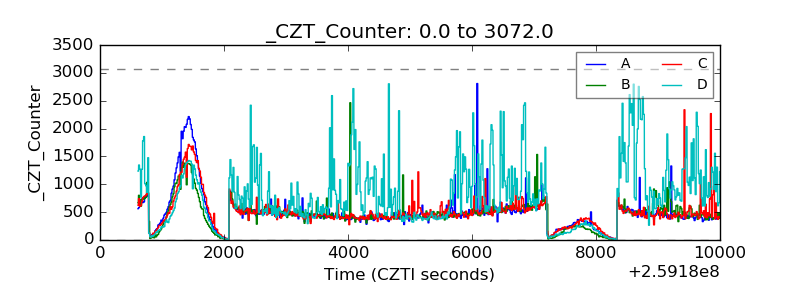 |
| +2.5 Volts monitor |  |
| +5 Volts monitor | 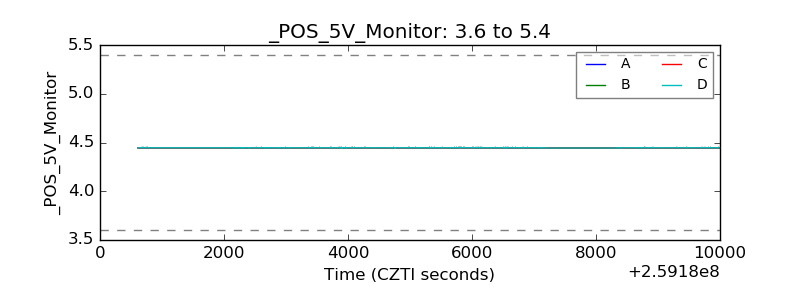 |
| _ROLL_ROT | 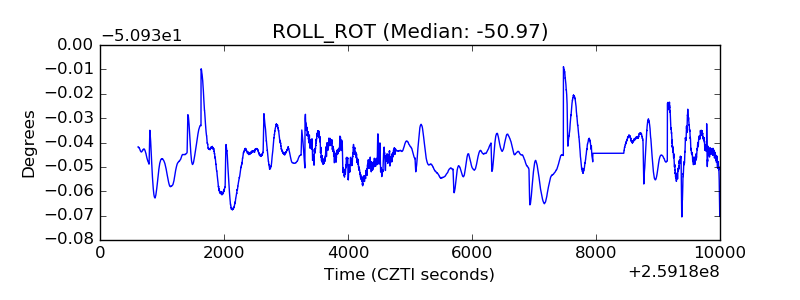 |
| _Roll_DEC | 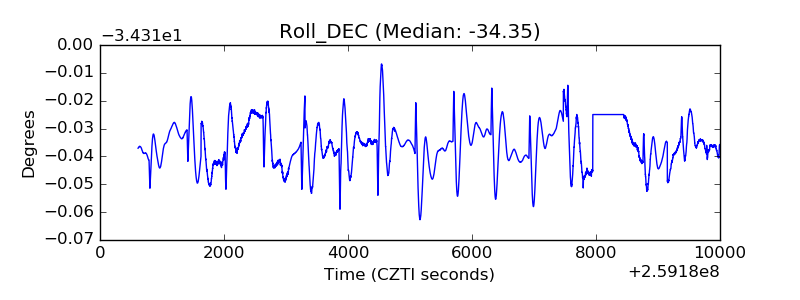 |
| _Roll_RA | 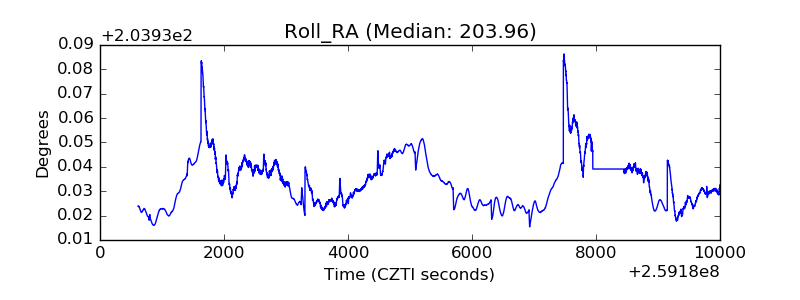 |
| Veto Counter | 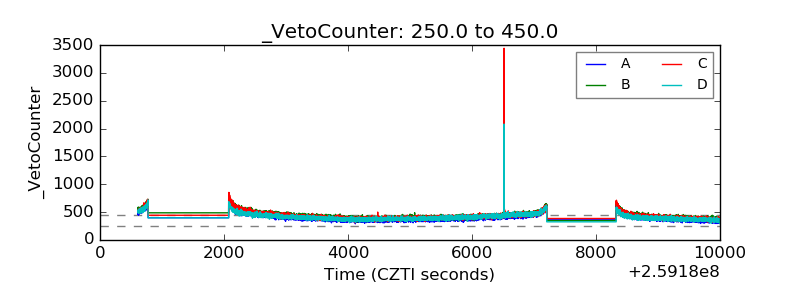 |