| Param | Original file | Final file |
|---|---|---|
| Filename | modeM0/AS1A04_103T01_9000001988_13377cztM0_level2.evt | modeM0/AS1A04_103T01_9000001988_13377cztM0_level2_quad_clean.evt |
| Size (bytes) | 589,728,960 | 98,202,240 |
| Size | 562.4 MB | 93.7 MB |
| Events in quadrant A | 3,298,307 | 632,371 |
| Events in quadrant B | 3,502,698 | 646,620 |
| Events in quadrant C | 3,521,830 | 625,366 |
| Events in quadrant D | 7,051,554 | 570,617 |
| Mode M0 | |||
|---|---|---|---|
| Quadrant | BADHDUFLAG | Total packets | Discarded packets |
| A | 0 | 14778 | 2 |
| B | 0 | 15192 | 1 |
| C | 0 | 15216 | 1 |
| D | 0 | 26042 | 1 |
| Mode SS | |||
|---|---|---|---|
| Quadrant | BADHDUFLAG | Total packets | Discarded packets |
| A | 0 | 146 | 0 |
| B | 0 | 146 | 0 |
| C | 0 | 146 | 0 |
| D | 0 | 146 | 0 |
| Mode M9 | |||
|---|---|---|---|
| Quadrant | BADHDUFLAG | Total packets | Discarded packets |
| A | 0 | 7 | 0 |
| B | 0 | 7 | 0 |
| C | 0 | 7 | 0 |
| D | 0 | 7 | 0 |
| Quadrant | Total seconds | Saturated seconds | Saturation percentage |
|---|---|---|---|
| A | 7162 | 22 | 0.307177% |
| B | 7162 | 53 | 0.740017% |
| C | 7162 | 21 | 0.293214% |
| D | 7162 | 728 | 10.164758% |
Noise dominated data is calculated using 1-second bins in cleaned event files. If a bin has >2000 counts, and if more than 50% of those come from <1% of pixels, then it is considered to be noise-dominated and hence unusable.
| Quadrant | # 1 sec bins | Bins with >0 counts | Bins with >2000 counts | High rate bins dominated by noise | Noise dominated (total time) | Noise dominated (detector-on time) | Marked lightcurve |
|---|---|---|---|---|---|---|---|
| A | 7863 | 7164 | 6 | 6 | 0.08% | 0.08% | 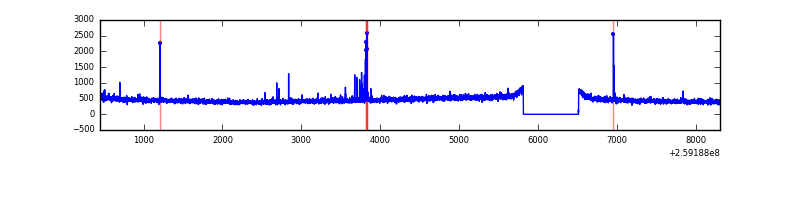 |
| B | 7863 | 7164 | 0 | 0 | 0.00% | 0.00% | 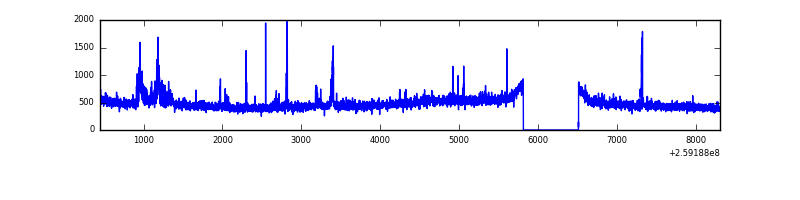 |
| C | 7863 | 7164 | 7 | 7 | 0.09% | 0.10% | 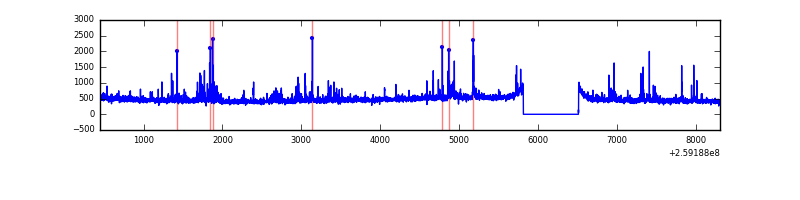 |
| D | 7863 | 7164 | 565 | 565 | 7.19% | 7.89% | 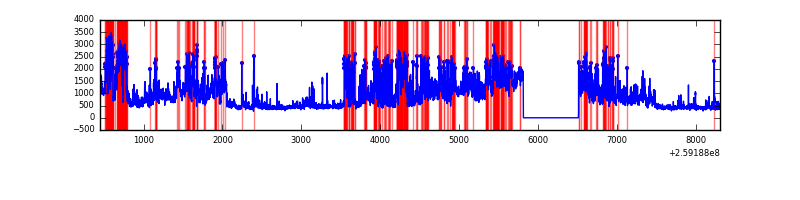 |
Top three noisy pixels from each quadrant. If the there are fewer than three noisy pixels in the level2.evt file, extra rows are filled as -1
| Pixel properties | Quadrant properties | ||||||
|---|---|---|---|---|---|---|---|
| Quadrant | DetID | PixID | Counts | Sigma | Mean | Median | Sigma |
| A | 9 | 143 | 44284 | 256.07 | 840 | 821 | 169.7 |
| A | 15 | 69 | 15631 | 87.26 | 840 | 821 | 169.7 |
| A | 0 | 226 | 7643 | 40.19 | 840 | 821 | 169.7 |
| B | 10 | 244 | 87754 | 537.9 | 850 | 827 | 161.6 |
| B | 3 | 64 | 42273 | 256.47 | 850 | 827 | 161.6 |
| B | 12 | 111 | 19181 | 113.57 | 850 | 827 | 161.6 |
| C | 14 | 220 | 235271 | 1228.8 | 821 | 826 | 190.8 |
| C | 3 | 233 | 70674 | 366.09 | 821 | 826 | 190.8 |
| C | 14 | 234 | 8219 | 38.75 | 821 | 826 | 190.8 |
| D | 1 | 52 | 3967369 | 21255.2 | 779 | 754 | 186.6 |
| D | 5 | 222 | 49016 | 258.61 | 779 | 754 | 186.6 |
| D | 2 | 136 | 41810 | 220.0 | 779 | 754 | 186.6 |
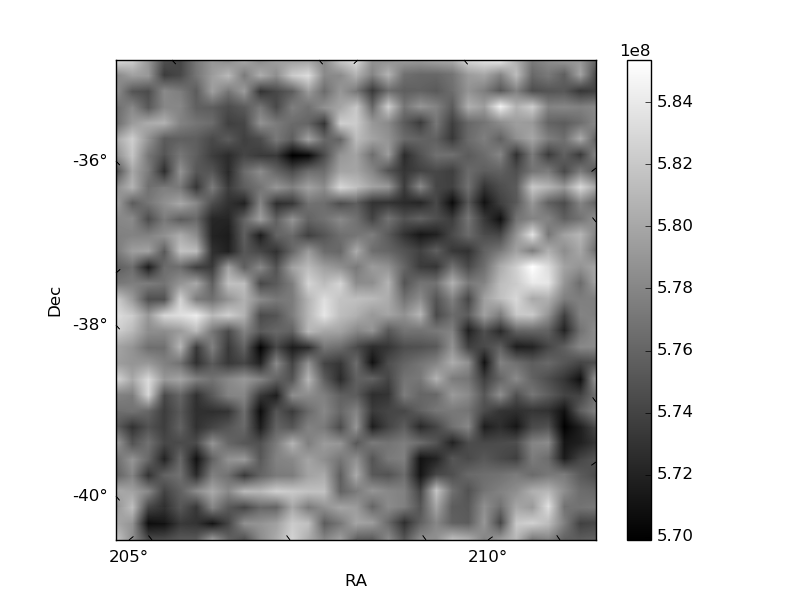
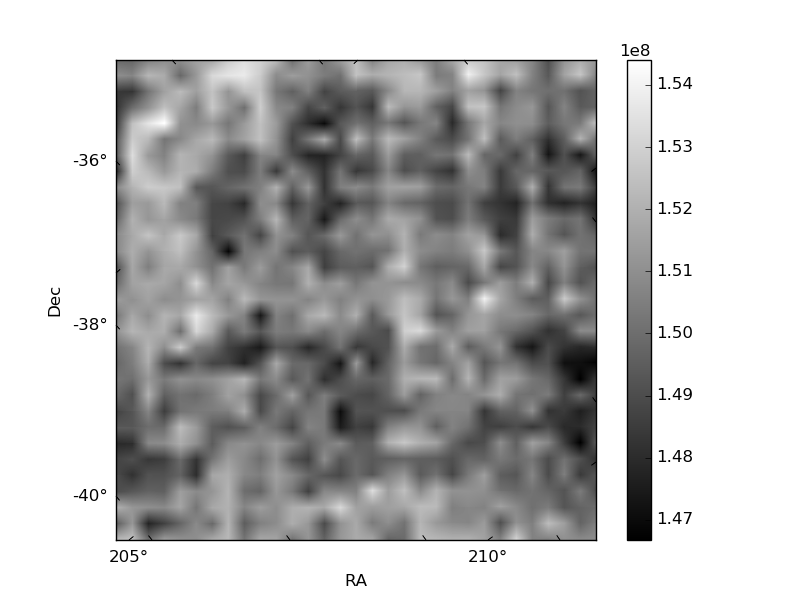
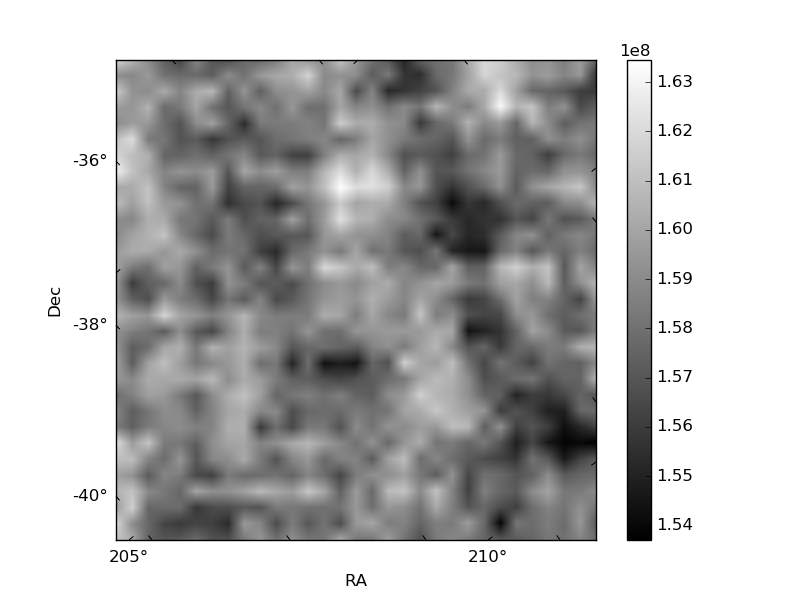
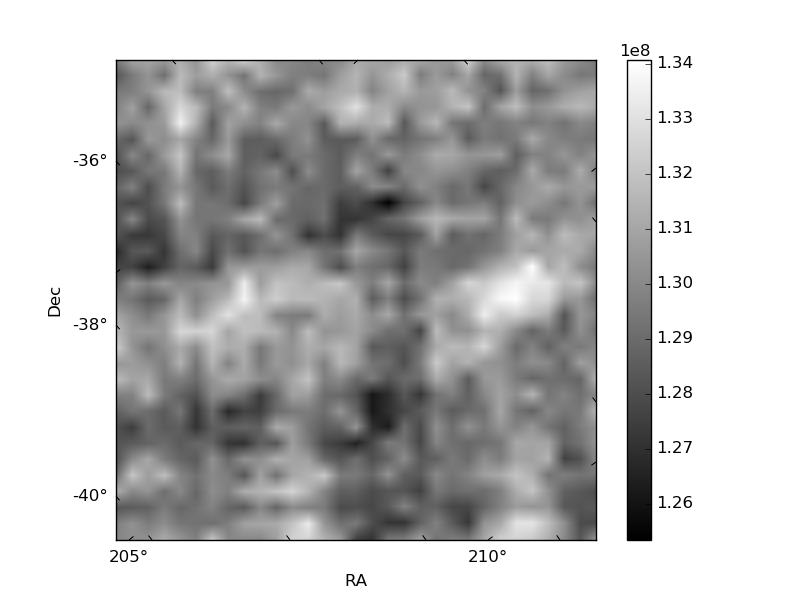
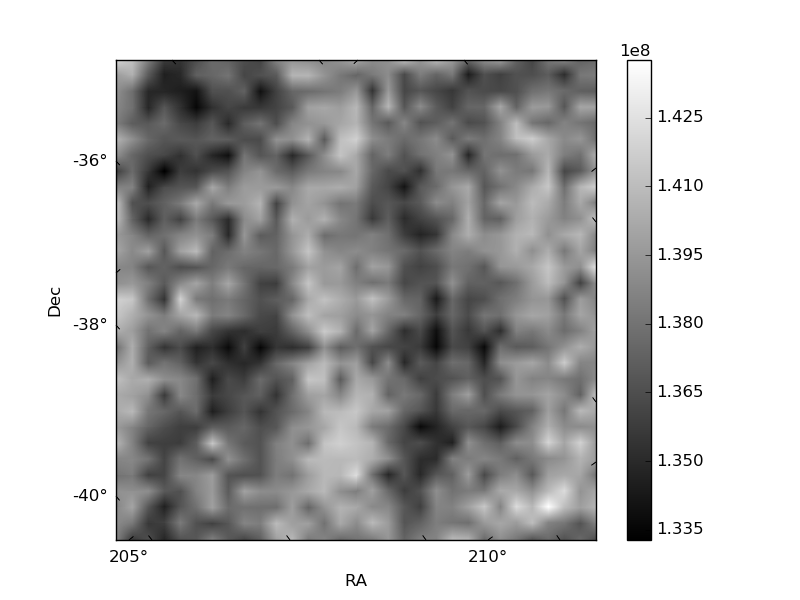
Histogram calculated using DETX and DETY for each event in the final _common_clean file
| Quadrant A | 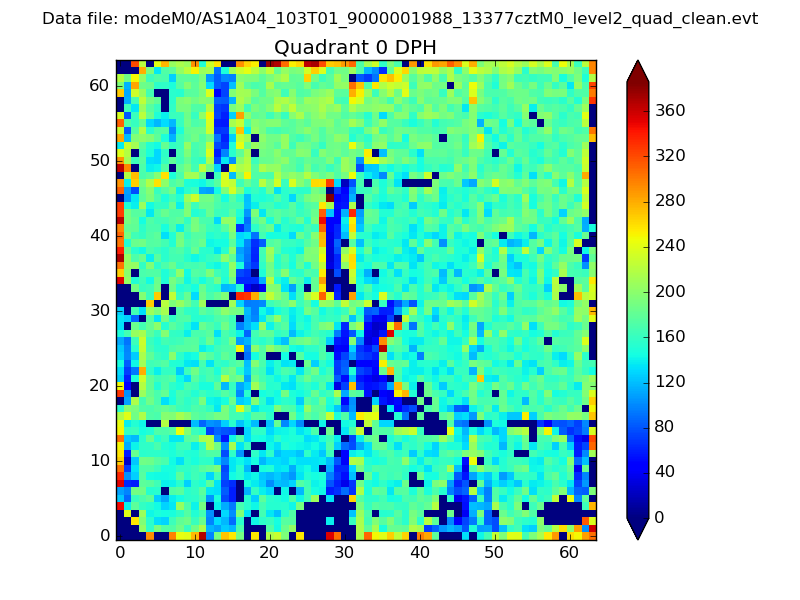 |
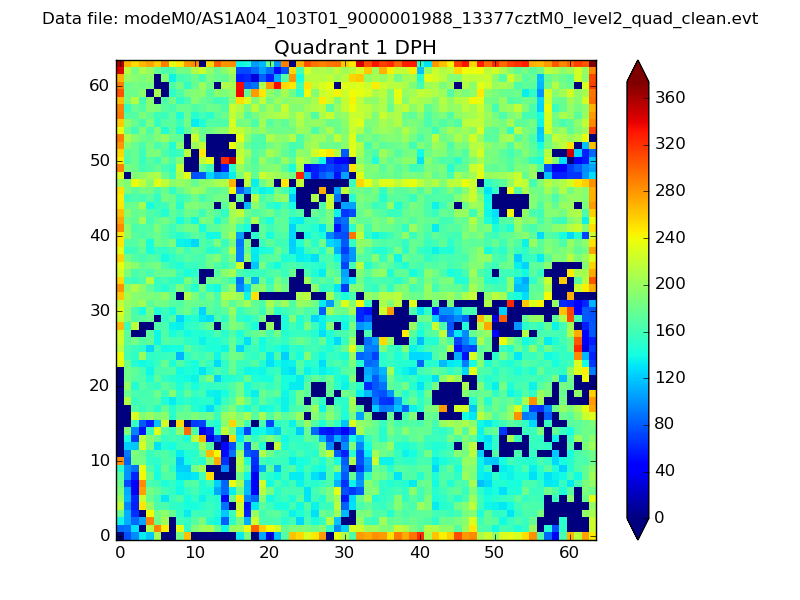 |
Quadrant B |
|---|---|---|---|
| Quadrant D | 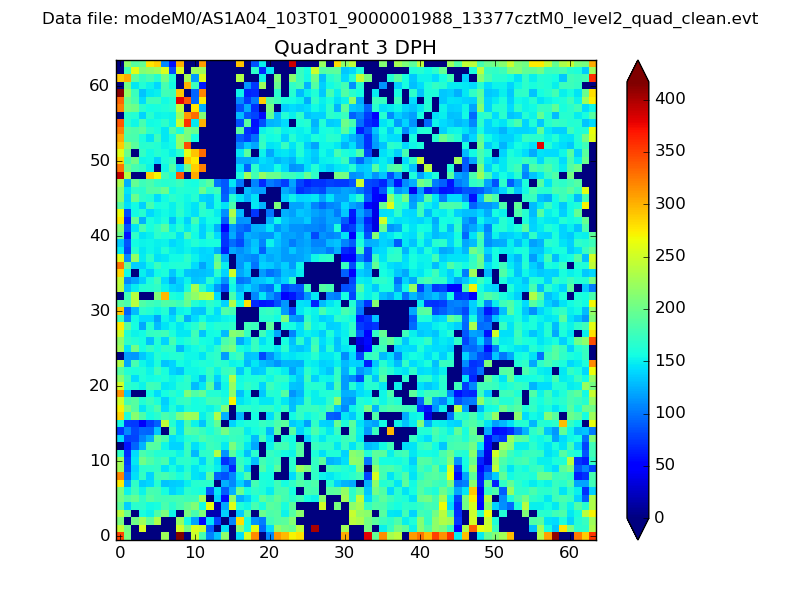 |
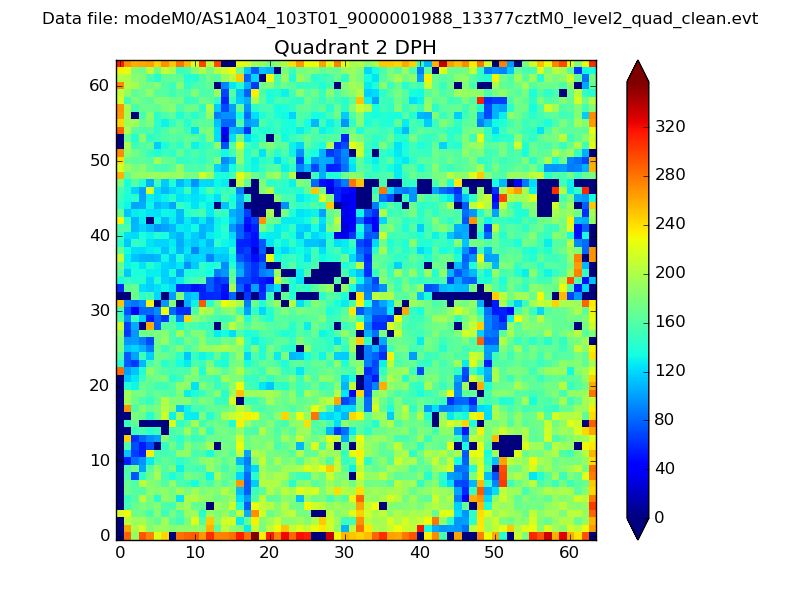 |
Quadrant C |
| Plot type | Count rate plots | Images |
|---|---|---|
| Comparison with Poisson distribution Blue bars denote a histogram of data divided into 1 sec bins. Red curve is a Poisson curve with rate = median count rate of data. |
 |
 |
| Quadrant-wise count rates Data is divided into 100 sec bins |
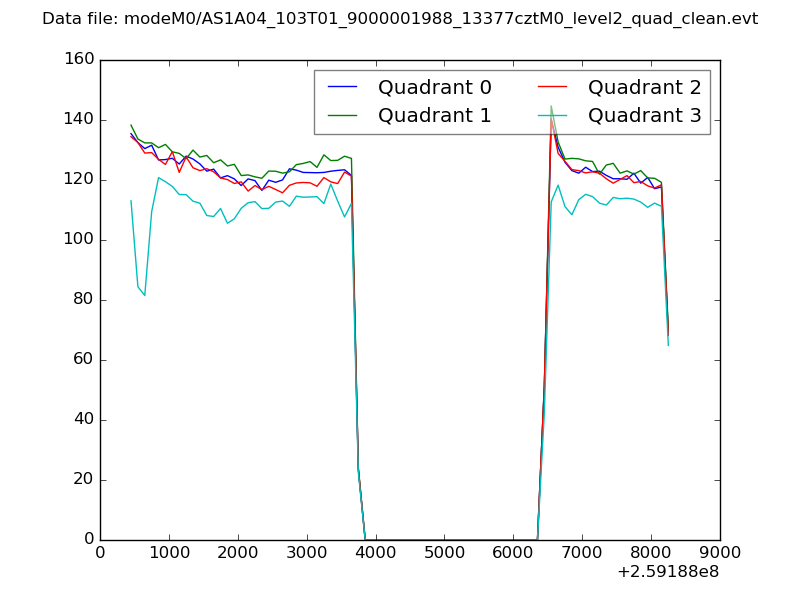 |
|
| Module-wise count rates for Quadrant A Data is divided into 100 sec bins |
 |
 |
| Module-wise count rates for Quadrant B Data is divided into 100 sec bins |
 |
 |
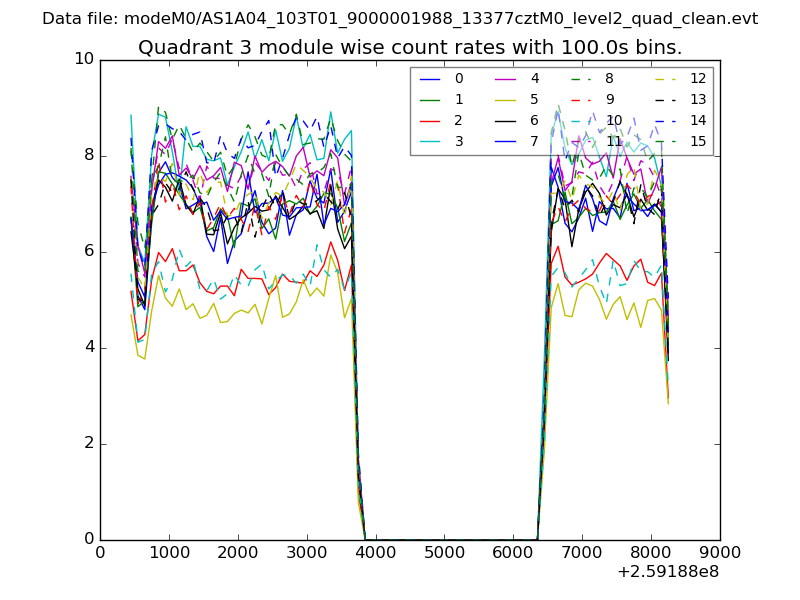
| Module-wise count rates for Quadrant C Data is divided into 100 sec bins |
 |
 |
| Module-wise count rates for Quadrant D Data is divided into 100 sec bins |
 |
 |
| Parameter | Plot |
|---|---|
| CZT HV Monitor |  |
| D_VDD | 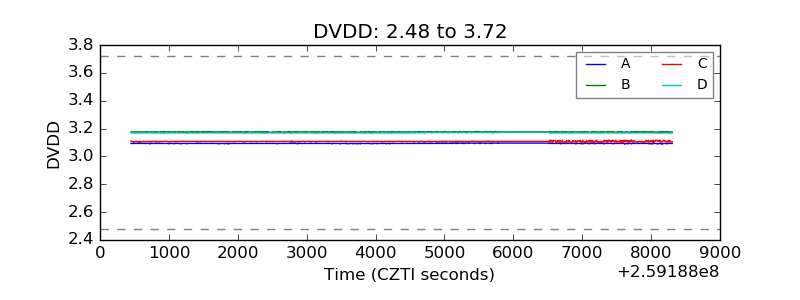 |
| Temperature 1 | 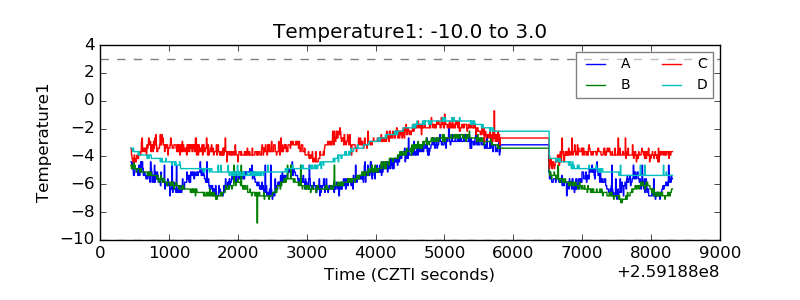 |
| Veto HV Monitor | 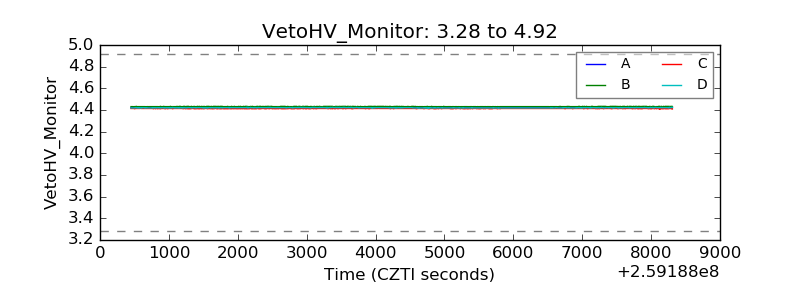 |
| Veto LLD | 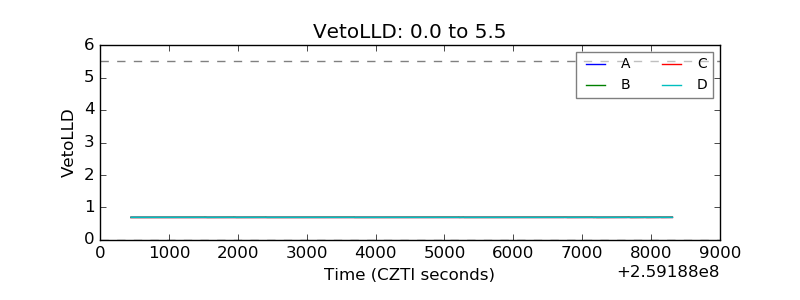 |
| Alpha Counter | 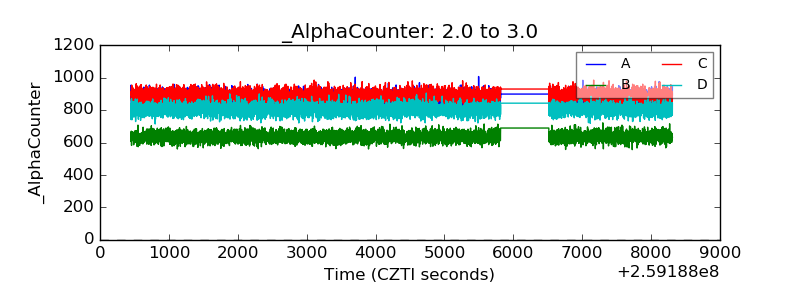 |
| _CPM_Rate | 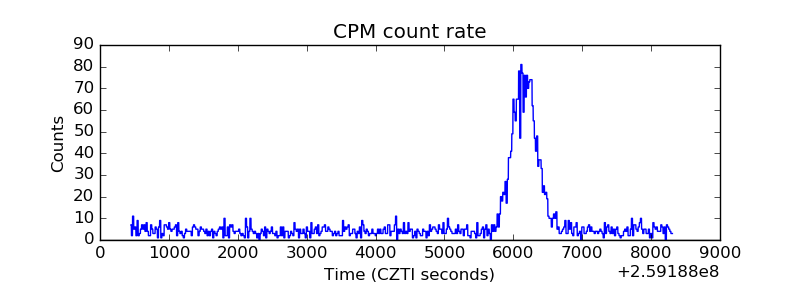 |
| CZT Counter | 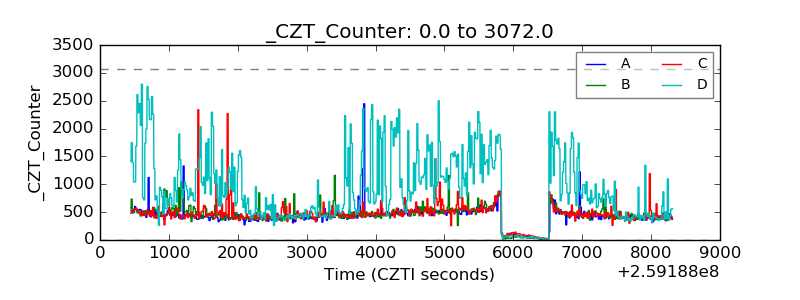 |
| +2.5 Volts monitor |  |
| +5 Volts monitor | 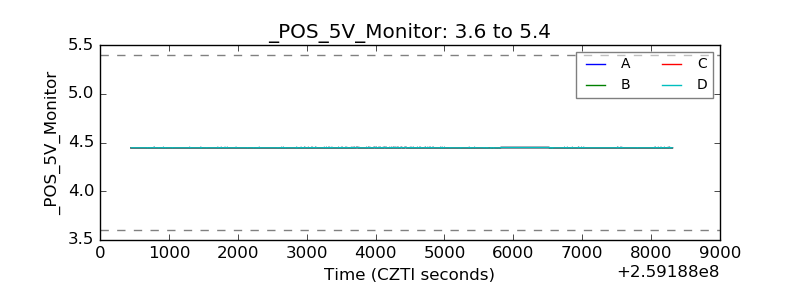 |
| _ROLL_ROT |  |
| _Roll_DEC |  |
| _Roll_RA | 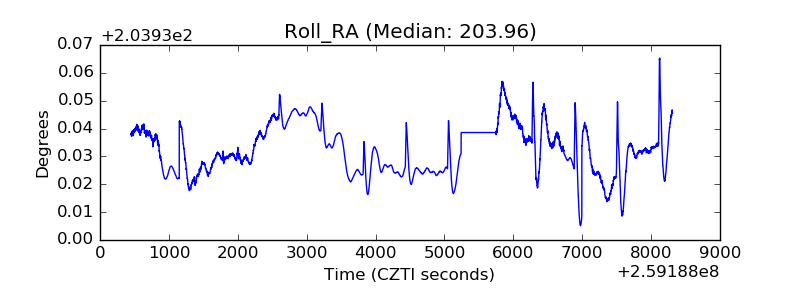 |
| Veto Counter |  |