| Param | Original file | Final file |
|---|---|---|
| Filename | modeM0/AS1A04_103T01_9000001988_13379cztM0_level2.evt | modeM0/AS1A04_103T01_9000001988_13379cztM0_level2_quad_clean.evt |
| Size (bytes) | 868,832,640 | 99,446,400 |
| Size | 828.6 MB | 94.8 MB |
| Events in quadrant A | 3,498,112 | 674,123 |
| Events in quadrant B | 3,849,893 | 691,766 |
| Events in quadrant C | 3,813,863 | 672,291 |
| Events in quadrant D | 14,633,710 | 439,822 |
| Mode M0 | |||
|---|---|---|---|
| Quadrant | BADHDUFLAG | Total packets | Discarded packets |
| A | 0 | 15726 | 2 |
| B | 0 | 16482 | 1 |
| C | 0 | 16431 | 1 |
| D | 0 | 48846 | 1 |
| Mode SS | |||
|---|---|---|---|
| Quadrant | BADHDUFLAG | Total packets | Discarded packets |
| A | 0 | 154 | 0 |
| B | 0 | 154 | 0 |
| C | 0 | 154 | 0 |
| D | 0 | 154 | 0 |
| Mode M9 | |||
|---|---|---|---|
| Quadrant | BADHDUFLAG | Total packets | Discarded packets |
| A | 0 | 2 | 0 |
| B | 0 | 2 | 0 |
| C | 0 | 2 | 0 |
| D | 0 | 2 | 0 |
| Quadrant | Total seconds | Saturated seconds | Saturation percentage |
|---|---|---|---|
| A | 7656 | 39 | 0.509404% |
| B | 7656 | 139 | 1.815569% |
| C | 7656 | 51 | 0.666144% |
| D | 7656 | 3959 | 51.711076% |
Noise dominated data is calculated using 1-second bins in cleaned event files. If a bin has >2000 counts, and if more than 50% of those come from <1% of pixels, then it is considered to be noise-dominated and hence unusable.
| Quadrant | # 1 sec bins | Bins with >0 counts | Bins with >2000 counts | High rate bins dominated by noise | Noise dominated (total time) | Noise dominated (detector-on time) | Marked lightcurve |
|---|---|---|---|---|---|---|---|
| A | 7827 | 7658 | 2 | 2 | 0.03% | 0.03% | 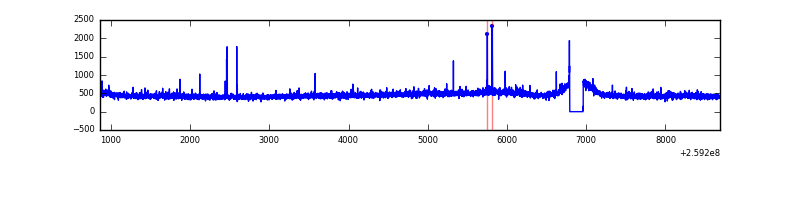 |
| B | 7827 | 7658 | 52 | 52 | 0.66% | 0.68% | 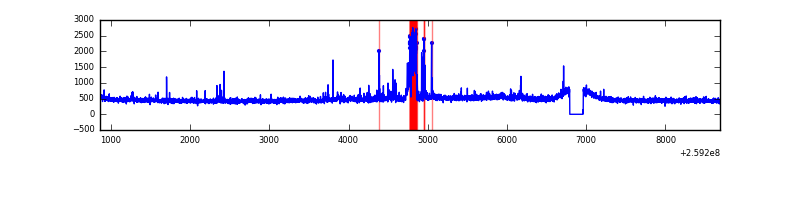 |
| C | 7827 | 7658 | 5 | 5 | 0.06% | 0.07% | 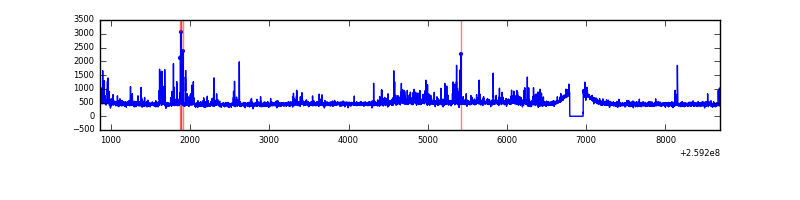 |
| D | 7827 | 7658 | 4075 | 4075 | 52.06% | 53.21% | 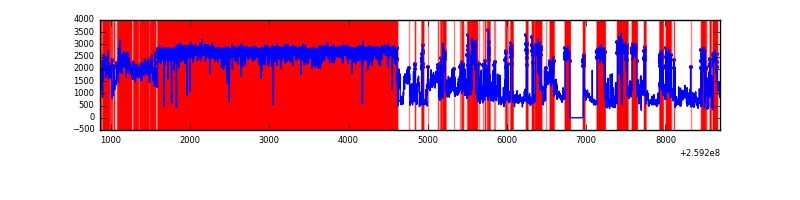 |
Top three noisy pixels from each quadrant. If the there are fewer than three noisy pixels in the level2.evt file, extra rows are filled as -1
| Pixel properties | Quadrant properties | ||||||
|---|---|---|---|---|---|---|---|
| Quadrant | DetID | PixID | Counts | Sigma | Mean | Median | Sigma |
| A | 9 | 143 | 33244 | 177.86 | 891 | 871 | 182.0 |
| A | 1 | 162 | 17936 | 93.76 | 891 | 871 | 182.0 |
| A | 0 | 226 | 7852 | 38.36 | 891 | 871 | 182.0 |
| B | 3 | 64 | 183837 | 1057.84 | 897 | 873 | 173.0 |
| B | 10 | 244 | 68748 | 392.43 | 897 | 873 | 173.0 |
| B | 4 | 142 | 36614 | 206.64 | 897 | 873 | 173.0 |
| C | 14 | 220 | 297809 | 1460.31 | 876 | 879 | 203.3 |
| C | 3 | 233 | 92986 | 452.98 | 876 | 879 | 203.3 |
| C | 14 | 234 | 9282 | 41.33 | 876 | 879 | 203.3 |
| D | 1 | 52 | 12079839 | 81221.38 | 618 | 599 | 148.7 |
| D | 8 | 195 | 182932 | 1226.02 | 618 | 599 | 148.7 |
| D | 2 | 234 | 19767 | 128.89 | 618 | 599 | 148.7 |
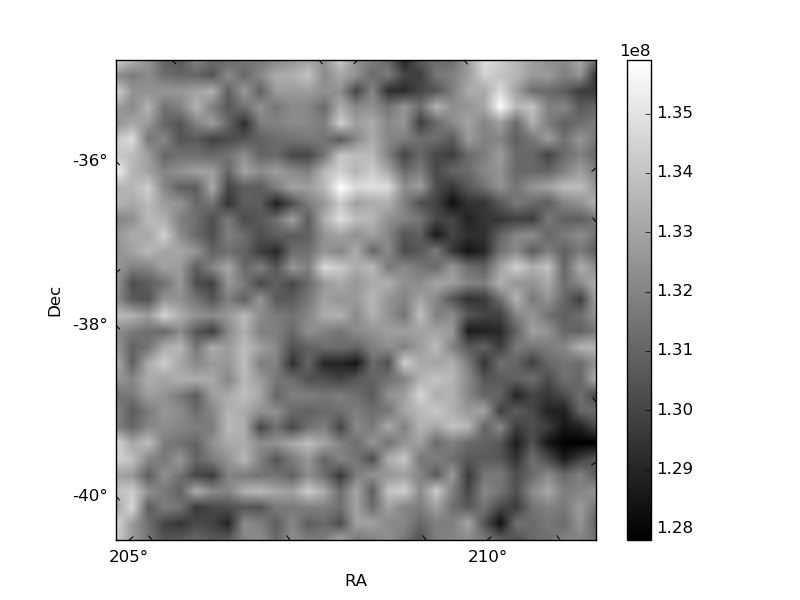
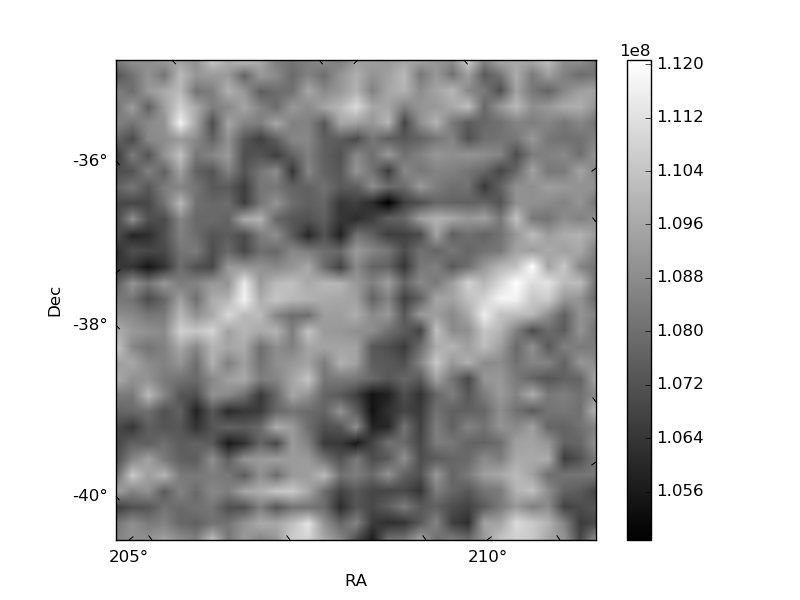
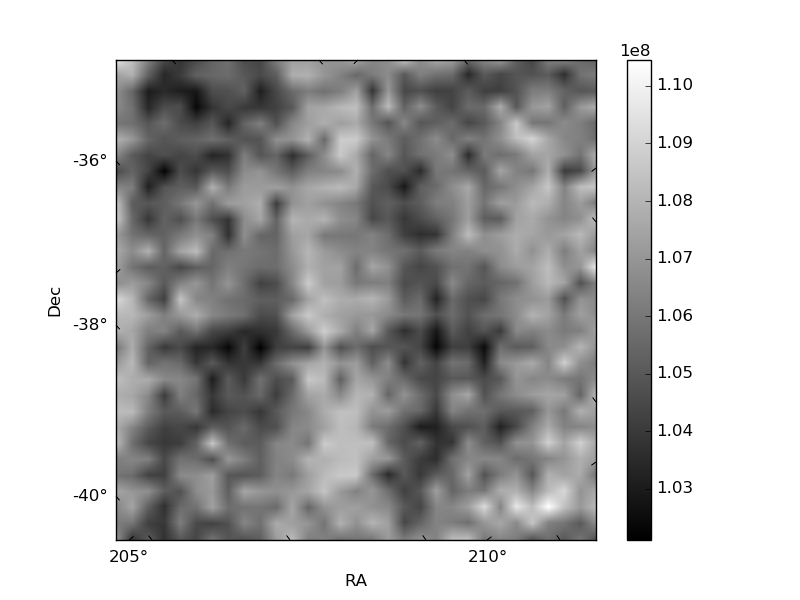
Histogram calculated using DETX and DETY for each event in the final _common_clean file
| Quadrant A | 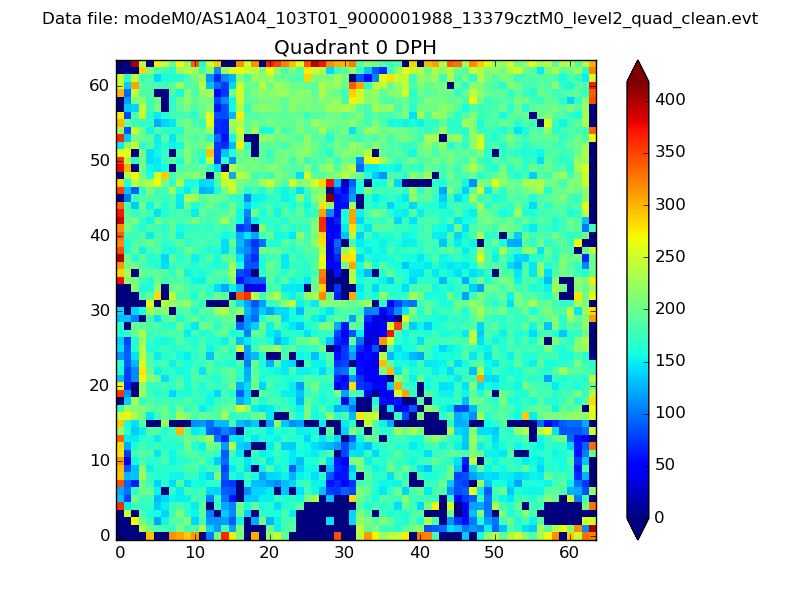 |
 |
Quadrant B |
|---|---|---|---|
| Quadrant D |  |
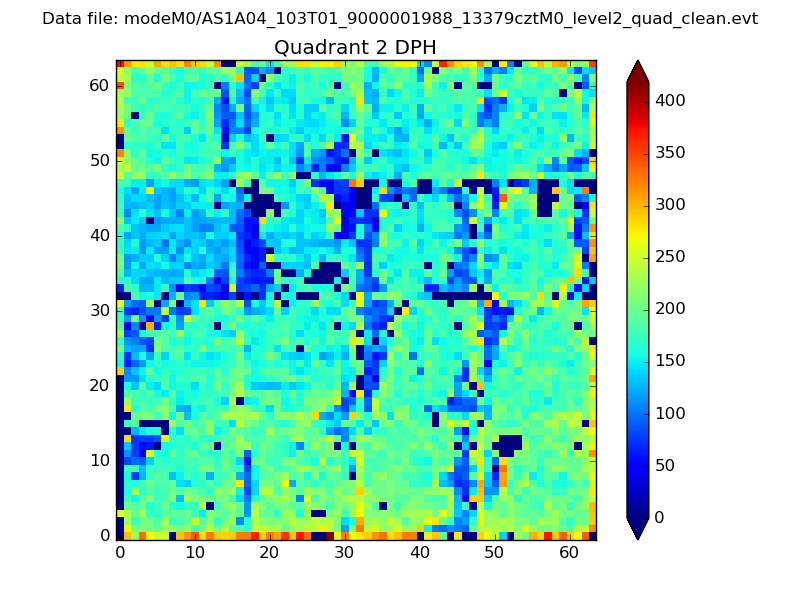 |
Quadrant C |
| Plot type | Count rate plots | Images |
|---|---|---|
| Comparison with Poisson distribution Blue bars denote a histogram of data divided into 1 sec bins. Red curve is a Poisson curve with rate = median count rate of data. |
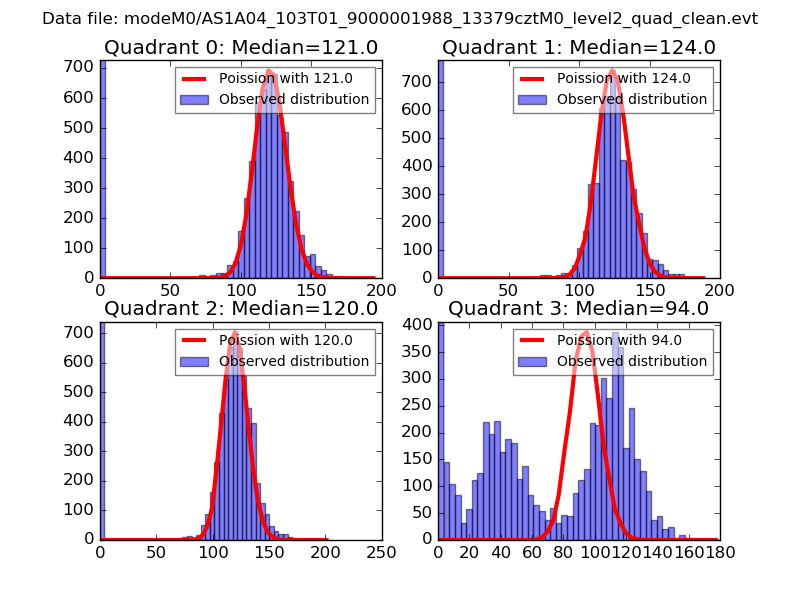 |
 |
| Quadrant-wise count rates Data is divided into 100 sec bins |
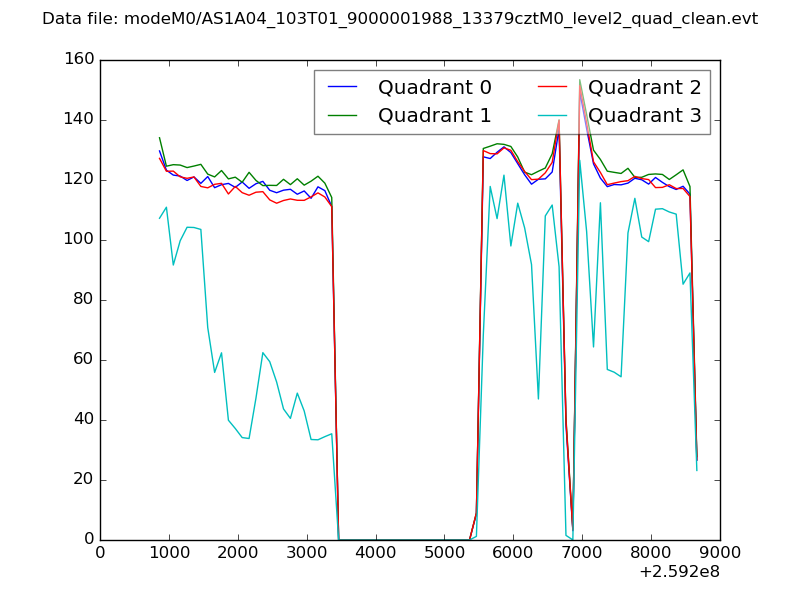 |
|
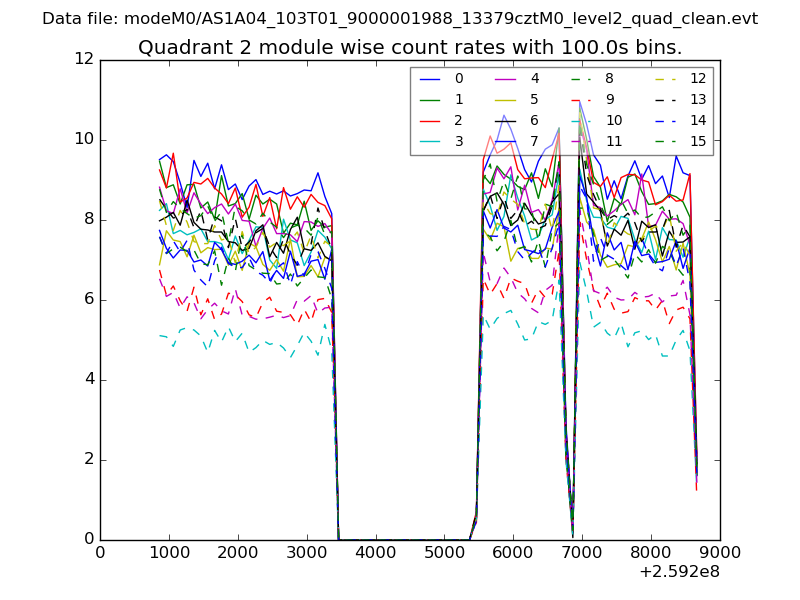
| Module-wise count rates for Quadrant A Data is divided into 100 sec bins |
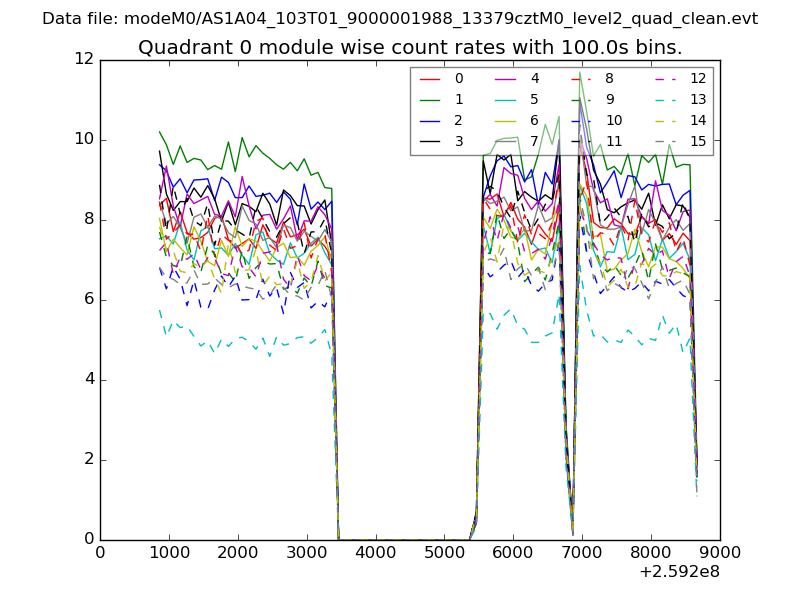 |
 |
| Module-wise count rates for Quadrant B Data is divided into 100 sec bins |
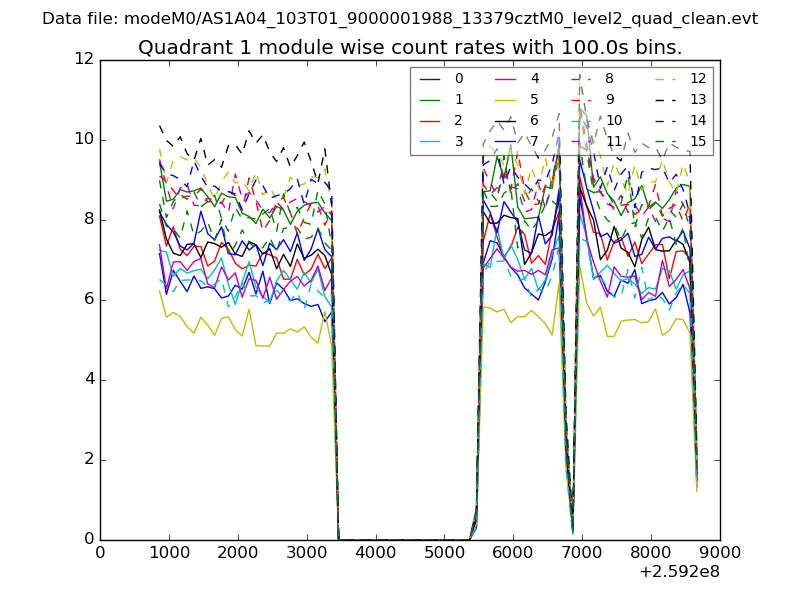 |
 |
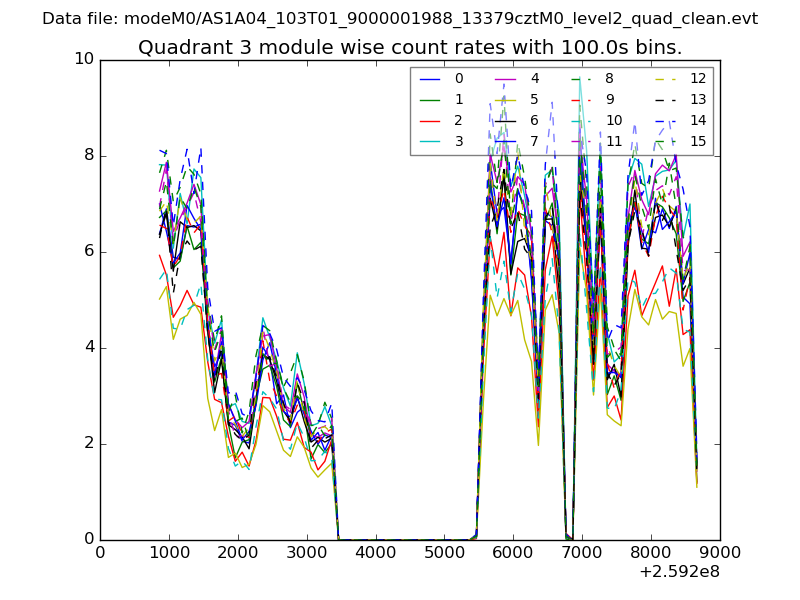
| Module-wise count rates for Quadrant C Data is divided into 100 sec bins |
 |
 |
| Module-wise count rates for Quadrant D Data is divided into 100 sec bins |
 |
 |
| Parameter | Plot |
|---|---|
| CZT HV Monitor | 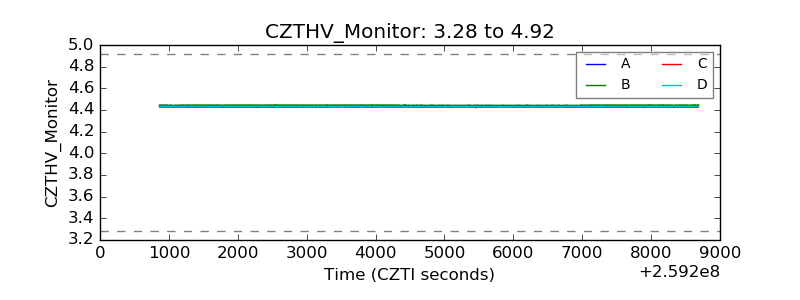 |
| D_VDD | 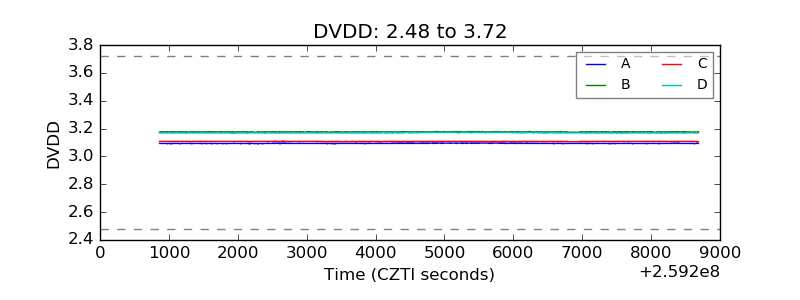 |
| Temperature 1 | 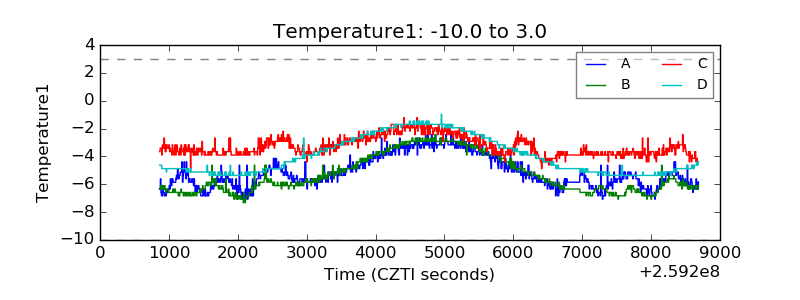 |
| Veto HV Monitor | 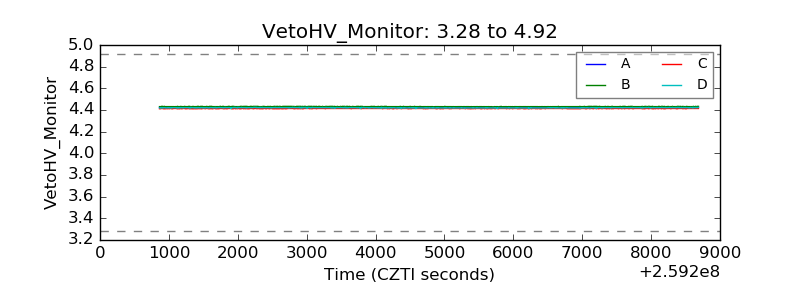 |
| Veto LLD | 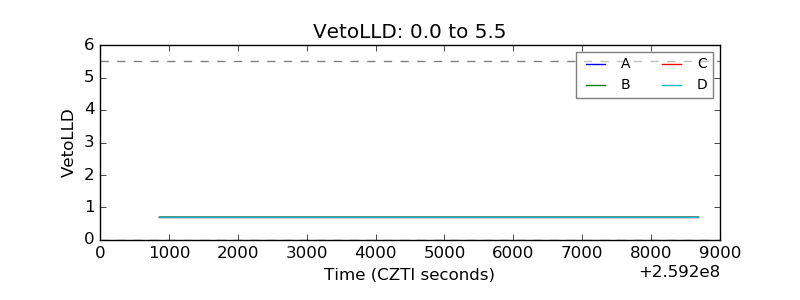 |
| Alpha Counter | 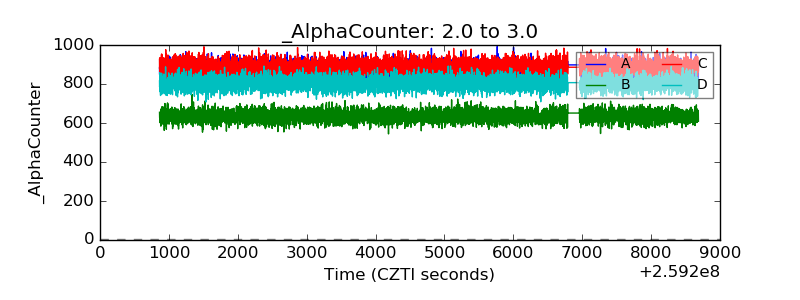 |
| _CPM_Rate | 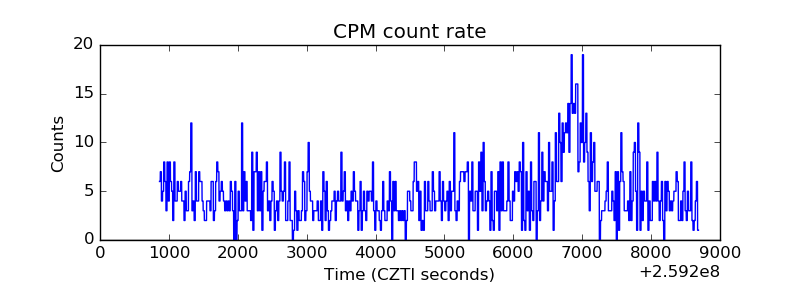 |
| CZT Counter | 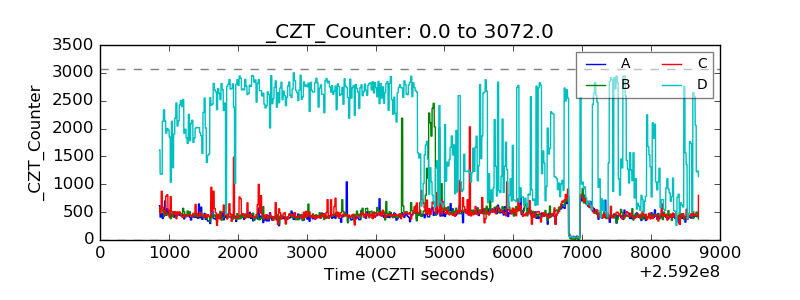 |
| +2.5 Volts monitor | 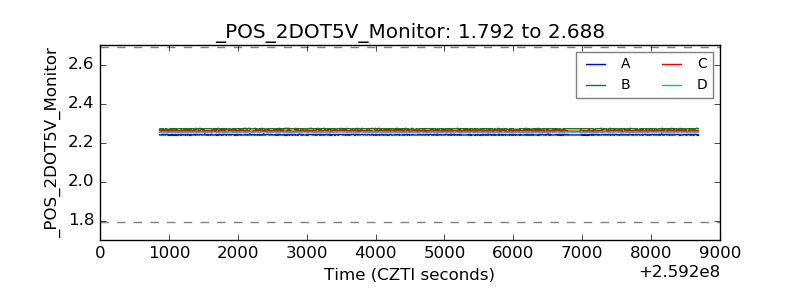 |
| +5 Volts monitor |  |
| _ROLL_ROT | 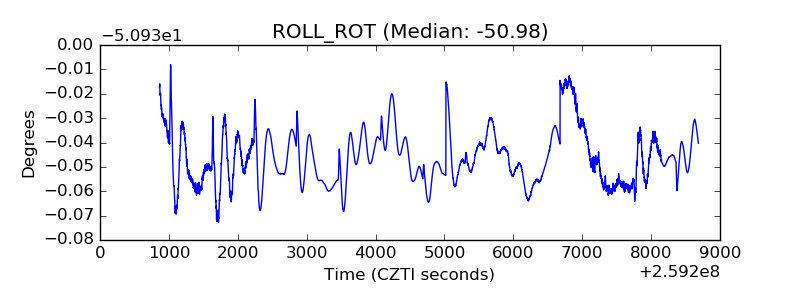 |
| _Roll_DEC | 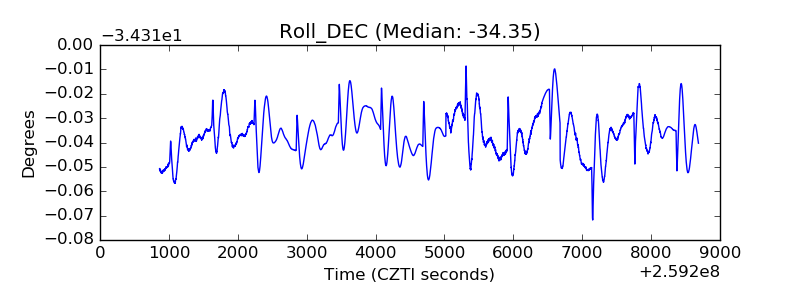 |
| _Roll_RA | 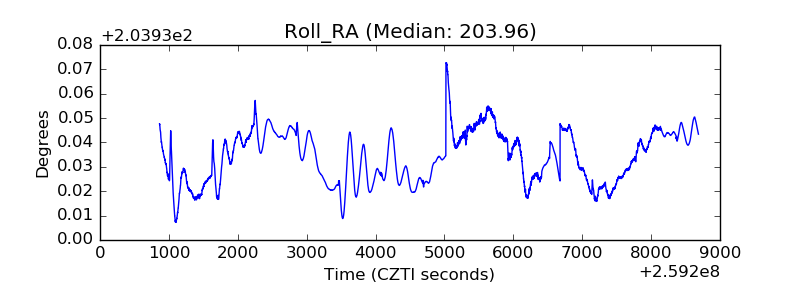 |
| Veto Counter | 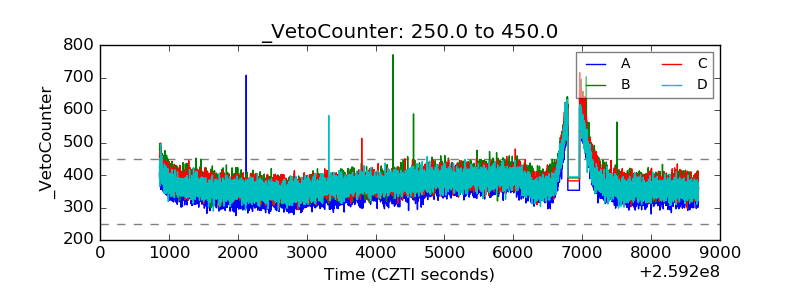 |