| Param | Original file | Final file |
|---|---|---|
| Filename | modeM0/AS1A04_103T01_9000001988_13382cztM0_level2.evt | modeM0/AS1A04_103T01_9000001988_13382cztM0_level2_quad_clean.evt |
| Size (bytes) | 1,554,969,600 | 236,157,120 |
| Size | 1.4 GB | 225.2 MB |
| Events in quadrant A | 8,742,462 | 1,492,970 |
| Events in quadrant B | 9,348,244 | 1,521,912 |
| Events in quadrant C | 9,337,205 | 1,486,037 |
| Events in quadrant D | 18,385,869 | 1,345,182 |
| Mode M0 | |||
|---|---|---|---|
| Quadrant | BADHDUFLAG | Total packets | Discarded packets |
| A | 0 | 38870 | 5 |
| B | 0 | 40016 | 4 |
| C | 0 | 40293 | 4 |
| D | 0 | 67683 | 4 |
| Mode SS | |||
|---|---|---|---|
| Quadrant | BADHDUFLAG | Total packets | Discarded packets |
| A | 0 | 386 | 0 |
| B | 0 | 386 | 0 |
| C | 0 | 386 | 0 |
| D | 0 | 386 | 0 |
| Mode M9 | |||
|---|---|---|---|
| Quadrant | BADHDUFLAG | Total packets | Discarded packets |
| A | 0 | 18 | 0 |
| B | 0 | 18 | 0 |
| C | 0 | 18 | 0 |
| D | 0 | 18 | 0 |
| Quadrant | Total seconds | Saturated seconds | Saturation percentage |
|---|---|---|---|
| A | 18959 | 186 | 0.981064% |
| B | 18959 | 267 | 1.408302% |
| C | 18959 | 182 | 0.959966% |
| D | 18959 | 1807 | 9.531093% |
Noise dominated data is calculated using 1-second bins in cleaned event files. If a bin has >2000 counts, and if more than 50% of those come from <1% of pixels, then it is considered to be noise-dominated and hence unusable.
| Quadrant | # 1 sec bins | Bins with >0 counts | Bins with >2000 counts | High rate bins dominated by noise | Noise dominated (total time) | Noise dominated (detector-on time) | Marked lightcurve |
|---|---|---|---|---|---|---|---|
| A | 20780 | 18964 | 24 | 24 | 0.12% | 0.13% | 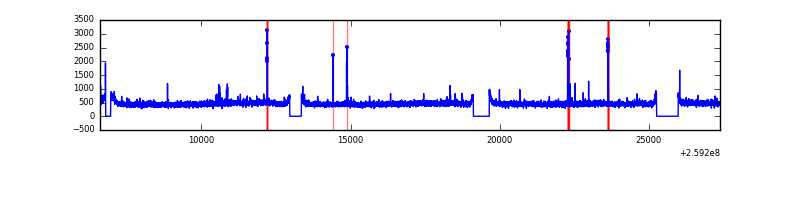 |
| B | 20780 | 18964 | 58 | 58 | 0.28% | 0.31% | 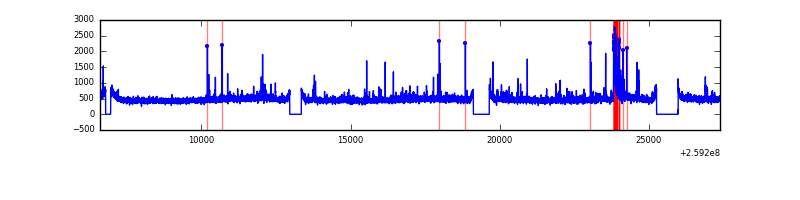 |
| C | 20780 | 18964 | 28 | 28 | 0.13% | 0.15% | 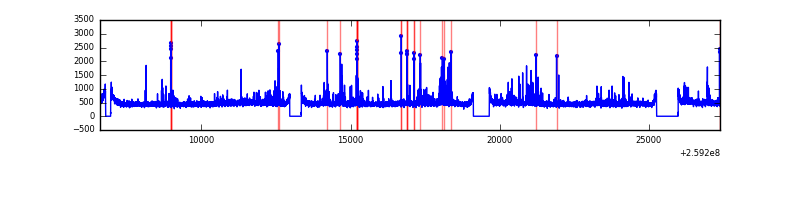 |
| D | 20780 | 18964 | 1639 | 1639 | 7.89% | 8.64% | 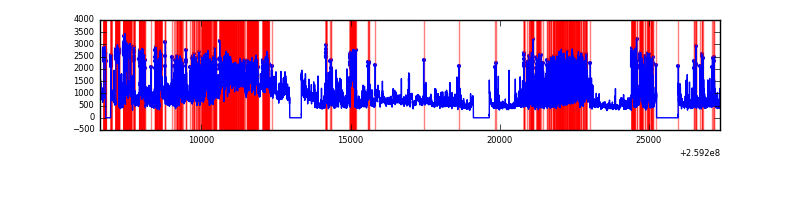 |
Top three noisy pixels from each quadrant. If the there are fewer than three noisy pixels in the level2.evt file, extra rows are filled as -1
| Pixel properties | Quadrant properties | ||||||
|---|---|---|---|---|---|---|---|
| Quadrant | DetID | PixID | Counts | Sigma | Mean | Median | Sigma |
| A | 15 | 69 | 78588 | 167.87 | 2232 | 2180 | 455.2 |
| A | 9 | 143 | 48181 | 101.07 | 2232 | 2180 | 455.2 |
| A | 1 | 162 | 25249 | 50.68 | 2232 | 2180 | 455.2 |
| B | 3 | 64 | 367339 | 855.18 | 2238 | 2175 | 427.0 |
| B | 0 | 214 | 55512 | 124.91 | 2238 | 2175 | 427.0 |
| B | 12 | 111 | 51050 | 114.46 | 2238 | 2175 | 427.0 |
| C | 14 | 220 | 659105 | 1298.94 | 2187 | 2196 | 505.7 |
| C | 3 | 233 | 139420 | 271.34 | 2187 | 2196 | 505.7 |
| C | 13 | 61 | 15560 | 26.42 | 2187 | 2196 | 505.7 |
| D | 1 | 52 | 9739424 | 19383.25 | 2092 | 2027 | 502.4 |
| D | 2 | 136 | 217528 | 428.98 | 2092 | 2027 | 502.4 |
| D | 13 | 249 | 200830 | 395.74 | 2092 | 2027 | 502.4 |
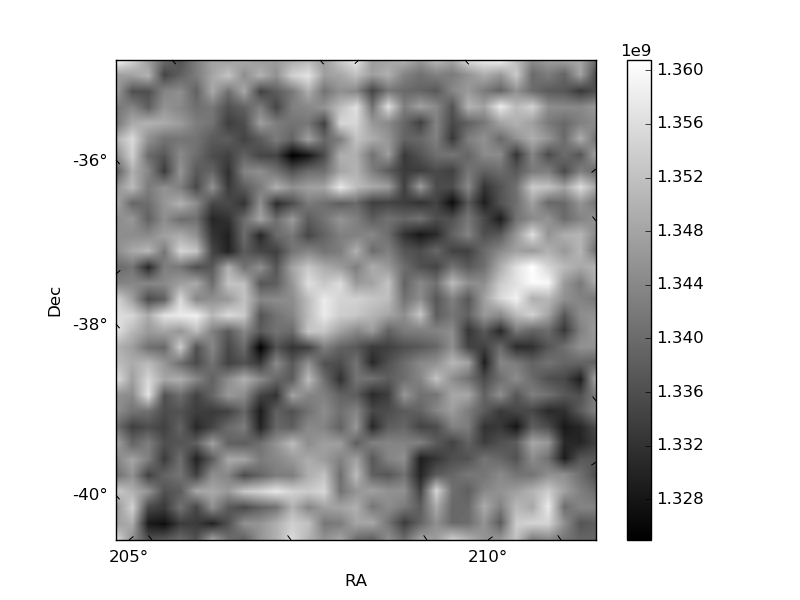
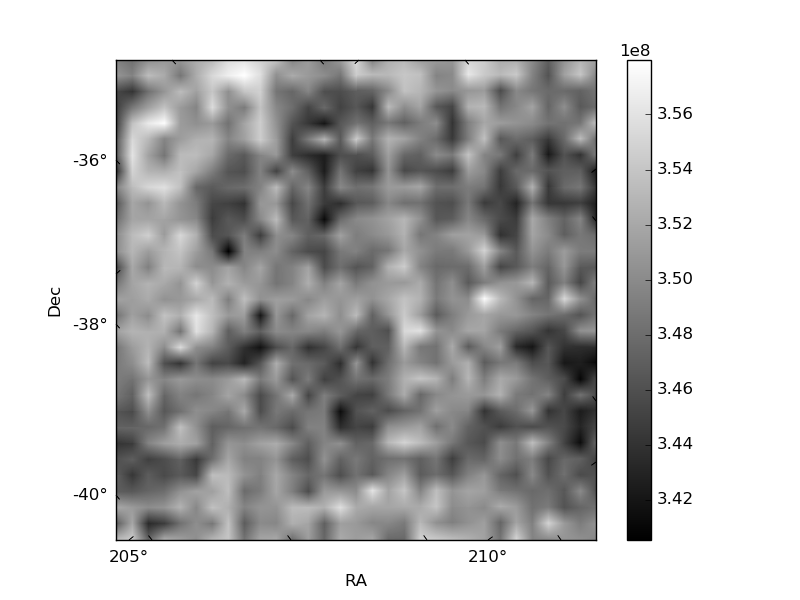
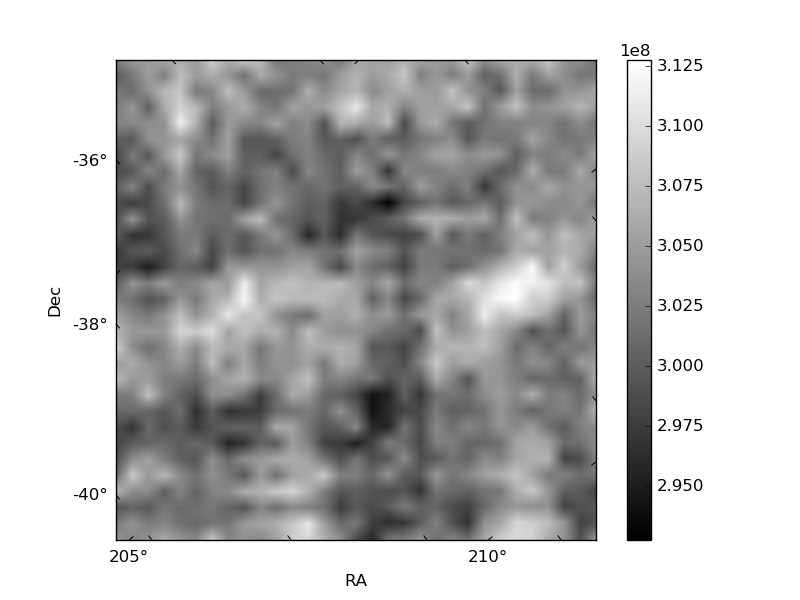
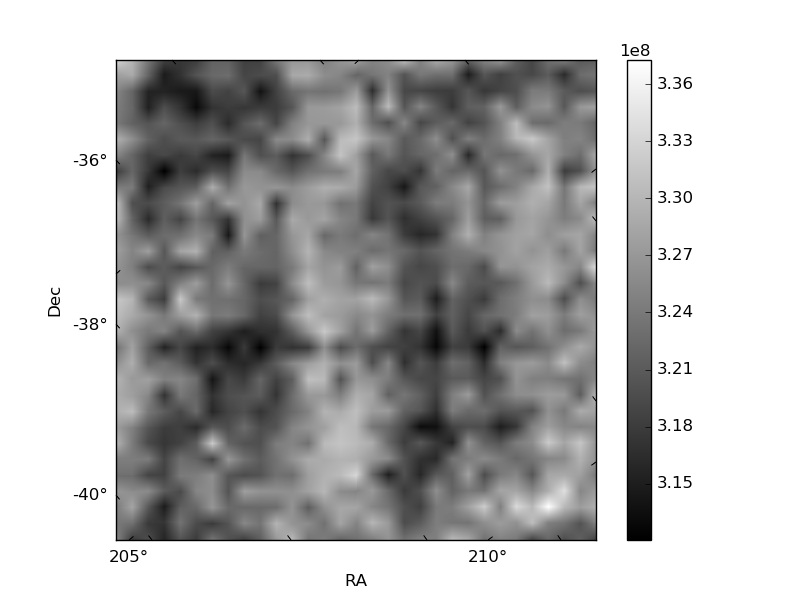
Histogram calculated using DETX and DETY for each event in the final _common_clean file
| Quadrant A | 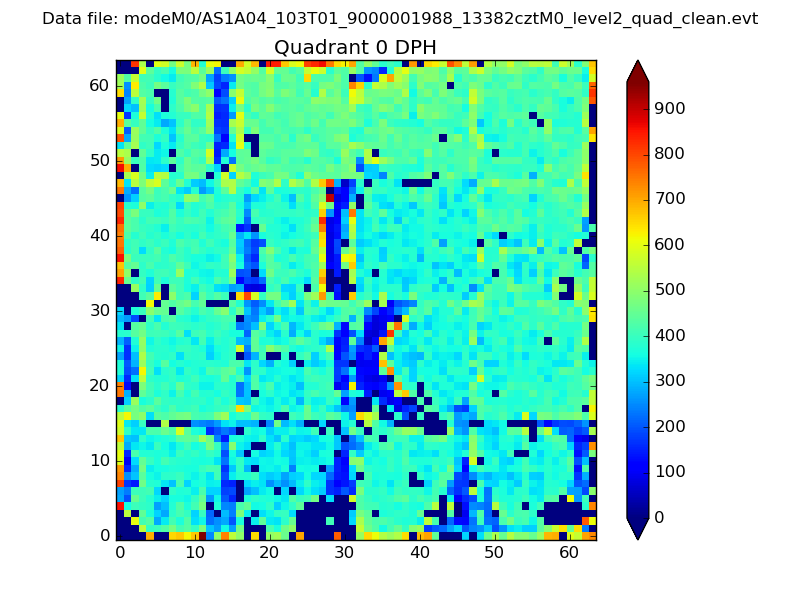 |
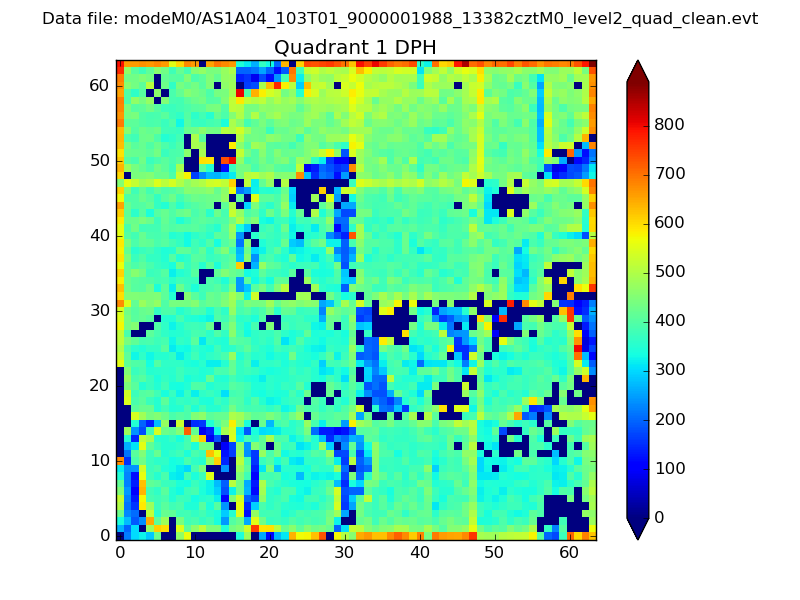 |
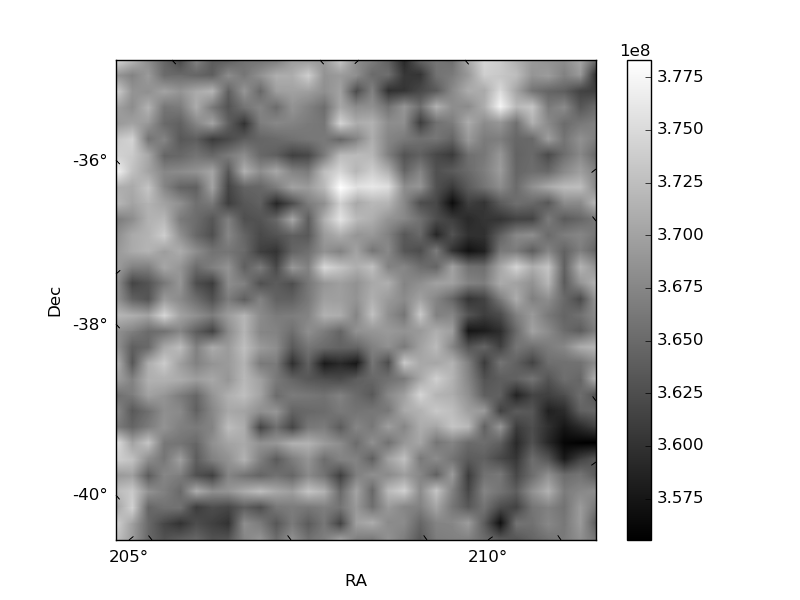
Quadrant B |
|---|---|---|---|
| Quadrant D | 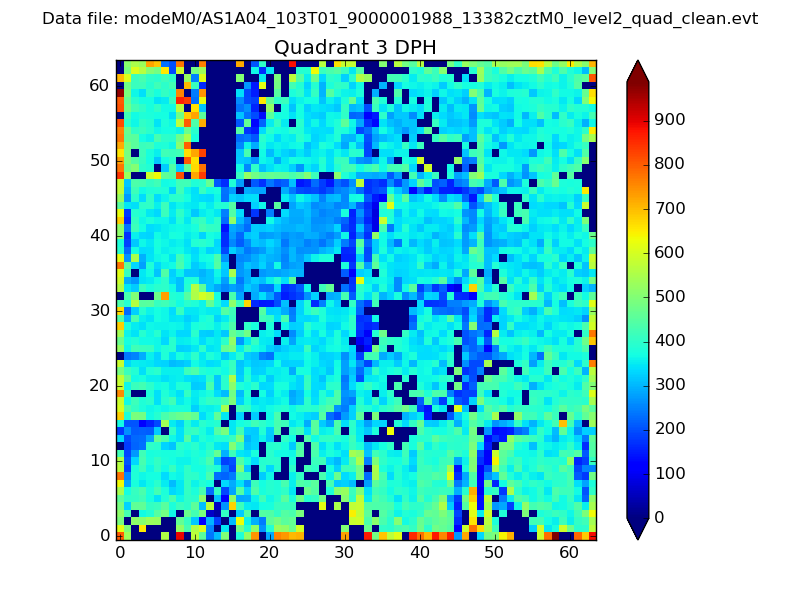 |
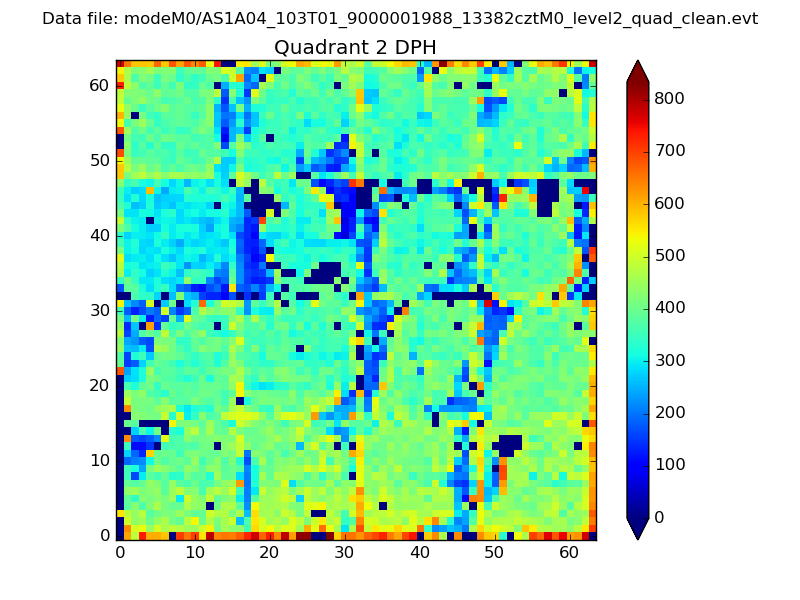 |
Quadrant C |
| Plot type | Count rate plots | Images |
|---|---|---|
| Comparison with Poisson distribution Blue bars denote a histogram of data divided into 1 sec bins. Red curve is a Poisson curve with rate = median count rate of data. |
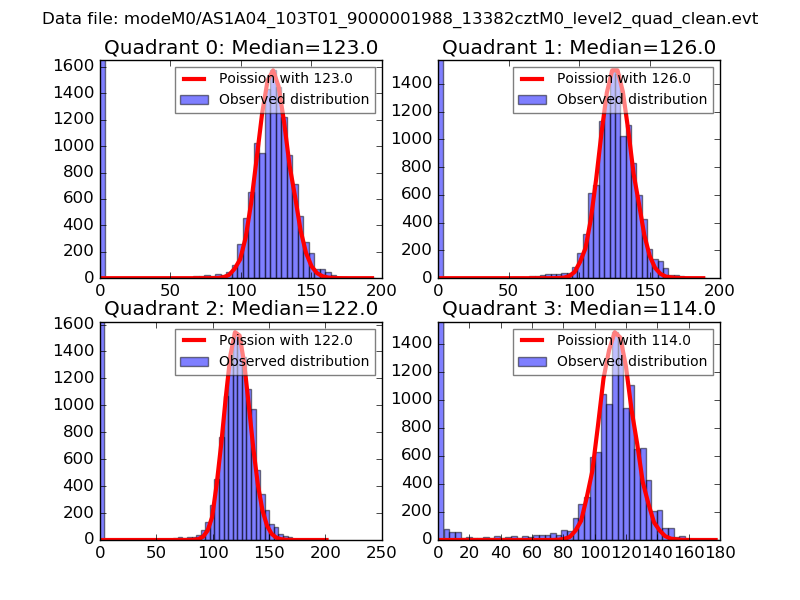 |
 |
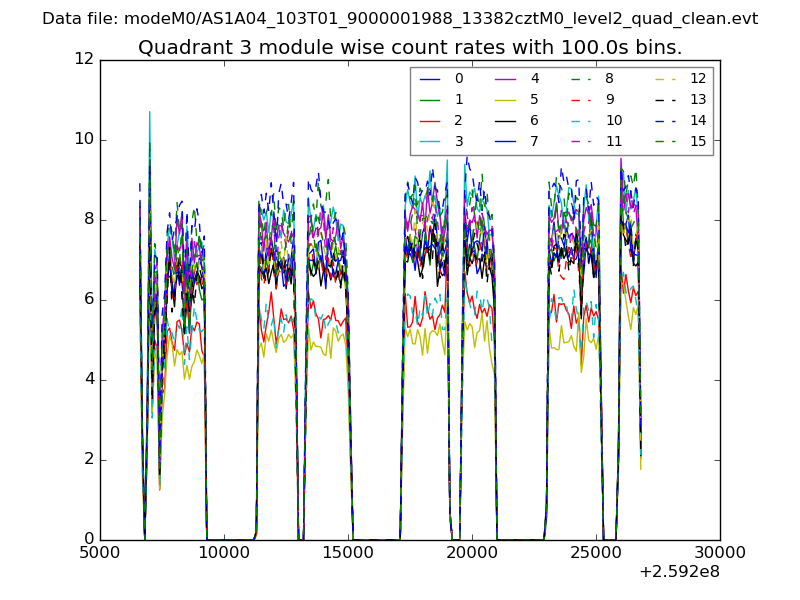
| Quadrant-wise count rates Data is divided into 100 sec bins |
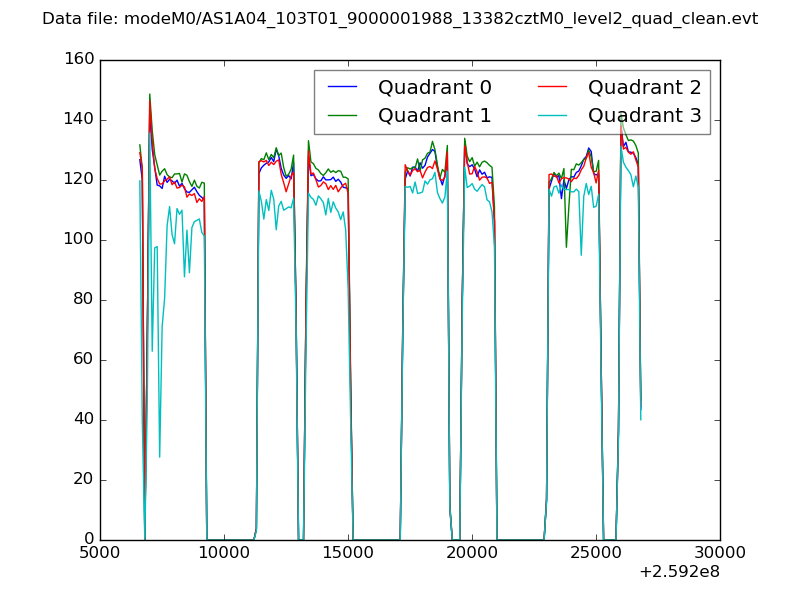 |
|
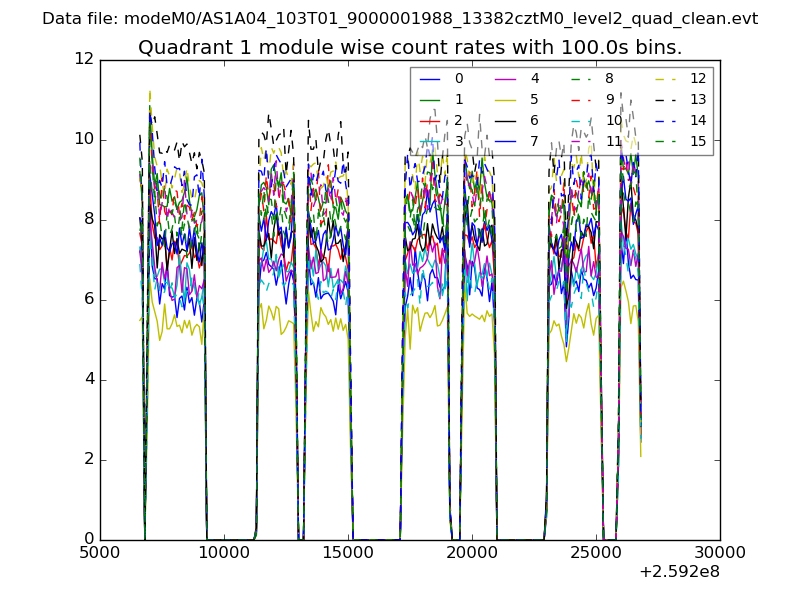
| Module-wise count rates for Quadrant A Data is divided into 100 sec bins |
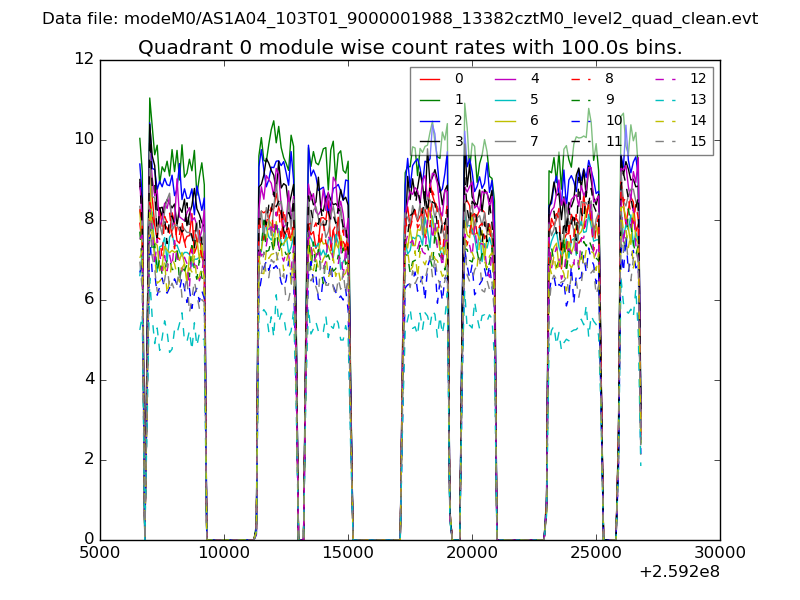 |
 |
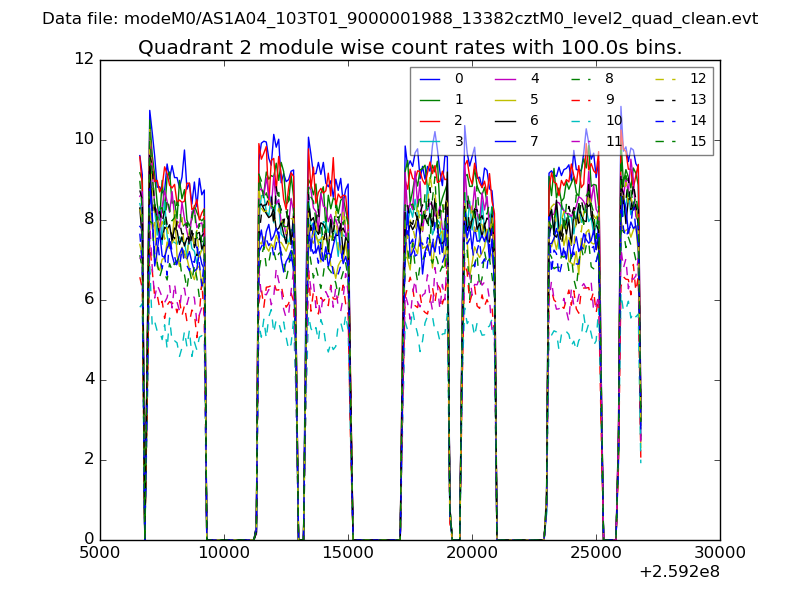
| Module-wise count rates for Quadrant B Data is divided into 100 sec bins |
 |
 |
| Module-wise count rates for Quadrant C Data is divided into 100 sec bins |
 |
 |
| Module-wise count rates for Quadrant D Data is divided into 100 sec bins |
 |
 |
| Parameter | Plot |
|---|---|
| CZT HV Monitor | 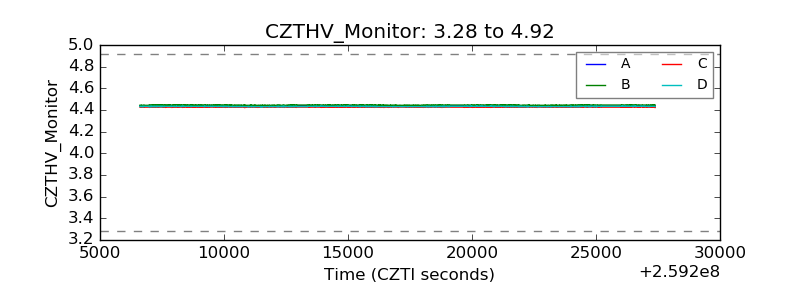 |
| D_VDD |  |
| Temperature 1 | 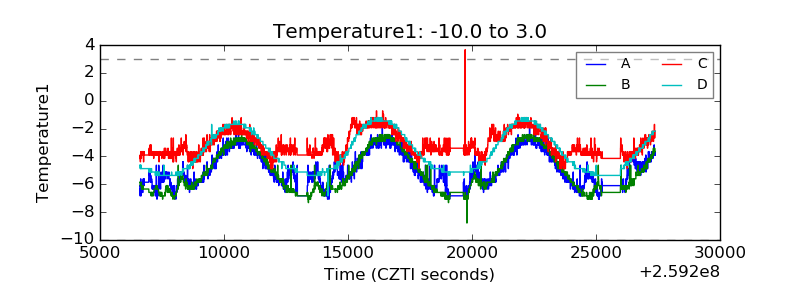 |
| Veto HV Monitor | 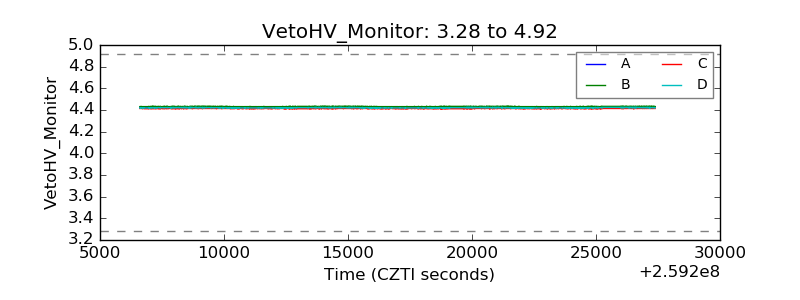 |
| Veto LLD |  |
| Alpha Counter | 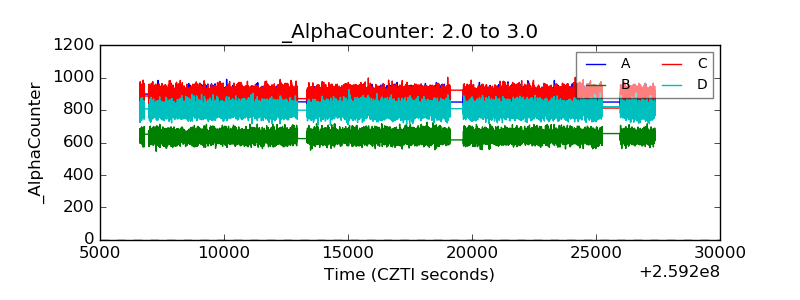 |
| _CPM_Rate | 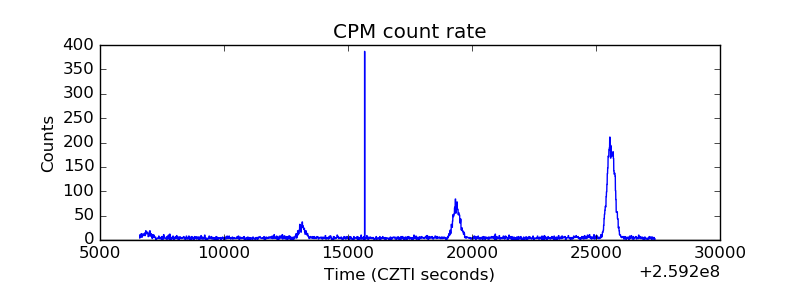 |
| CZT Counter | 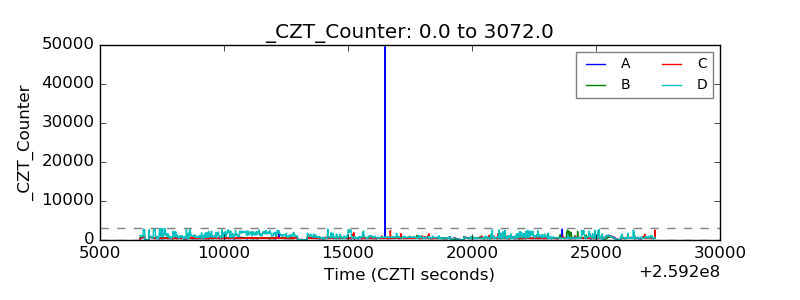 |
| +2.5 Volts monitor | 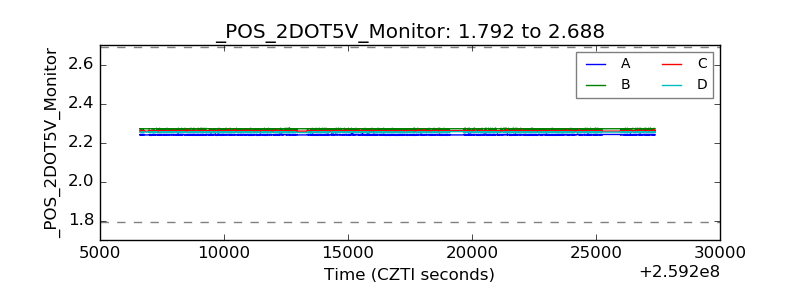 |
| +5 Volts monitor |  |
| _ROLL_ROT | 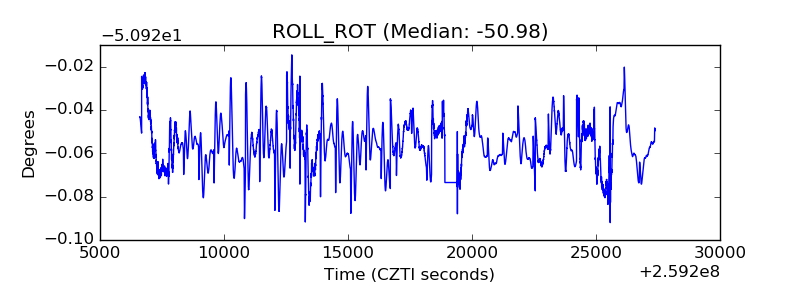 |
| _Roll_DEC | 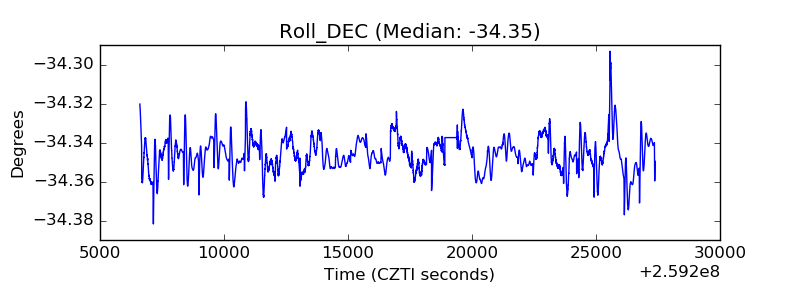 |
| _Roll_RA | 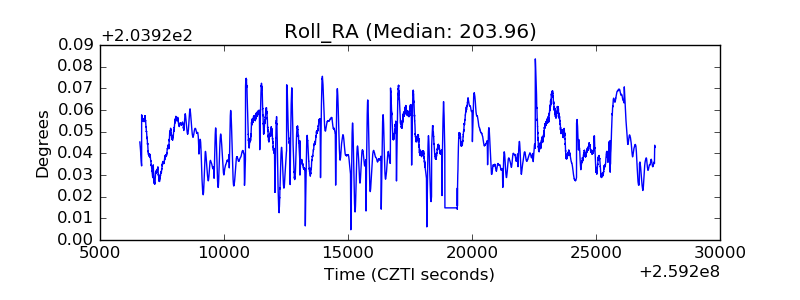 |
| Veto Counter | 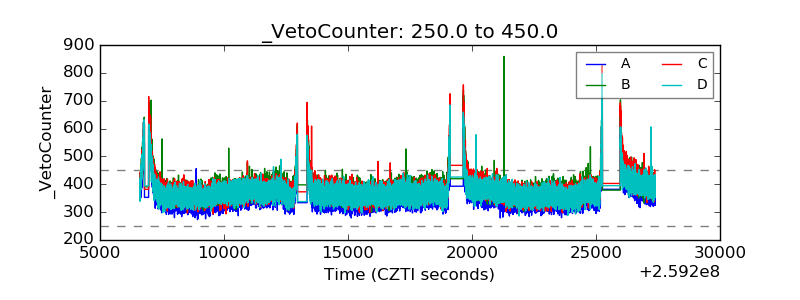 |