| Param | Original file | Final file |
|---|---|---|
| Filename | modeM0/AS1A04_103T01_9000001988_13383cztM0_level2.evt | modeM0/AS1A04_103T01_9000001988_13383cztM0_level2_quad_clean.evt |
| Size (bytes) | 511,211,520 | 77,463,360 |
| Size | 487.5 MB | 73.9 MB |
| Events in quadrant A | 3,220,054 | 472,946 |
| Events in quadrant B | 3,380,851 | 481,614 |
| Events in quadrant C | 3,400,570 | 471,552 |
| Events in quadrant D | 5,016,576 | 442,810 |
| Mode M0 | |||
|---|---|---|---|
| Quadrant | BADHDUFLAG | Total packets | Discarded packets |
| A | 0 | 14000 | 3 |
| B | 0 | 14310 | 2 |
| C | 0 | 14455 | 2 |
| D | 0 | 19407 | 2 |
| Mode SS | |||
|---|---|---|---|
| Quadrant | BADHDUFLAG | Total packets | Discarded packets |
| A | 0 | 140 | 0 |
| B | 0 | 140 | 0 |
| C | 0 | 140 | 0 |
| D | 0 | 140 | 0 |
| Mode M9 | |||
|---|---|---|---|
| Quadrant | BADHDUFLAG | Total packets | Discarded packets |
| A | 0 | 9 | 0 |
| B | 0 | 9 | 0 |
| C | 0 | 9 | 0 |
| D | 0 | 10 | 0 |
| Quadrant | Total seconds | Saturated seconds | Saturation percentage |
|---|---|---|---|
| A | 6835 | 62 | 0.907096% |
| B | 6835 | 70 | 1.024140% |
| C | 6835 | 52 | 0.760790% |
| D | 6835 | 372 | 5.442575% |
Noise dominated data is calculated using 1-second bins in cleaned event files. If a bin has >2000 counts, and if more than 50% of those come from <1% of pixels, then it is considered to be noise-dominated and hence unusable.
| Quadrant | # 1 sec bins | Bins with >0 counts | Bins with >2000 counts | High rate bins dominated by noise | Noise dominated (total time) | Noise dominated (detector-on time) | Marked lightcurve |
|---|---|---|---|---|---|---|---|
| A | 7716 | 6837 | 0 | 0 | 0.00% | 0.00% | 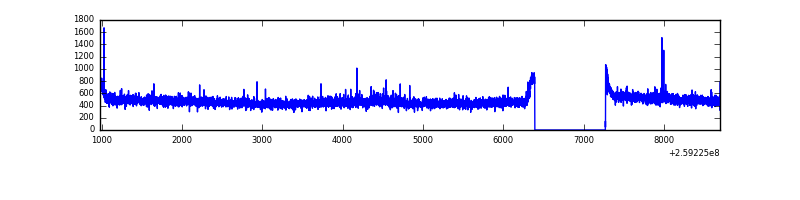 |
| B | 7716 | 6837 | 13 | 13 | 0.17% | 0.19% | 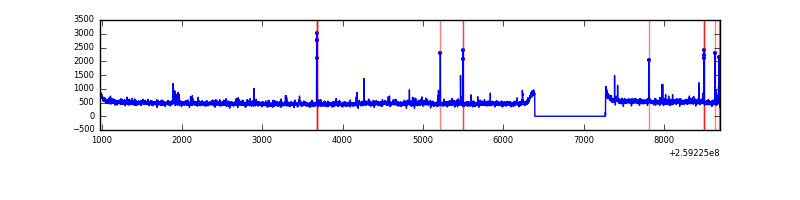 |
| C | 7716 | 6837 | 2 | 2 | 0.03% | 0.03% | 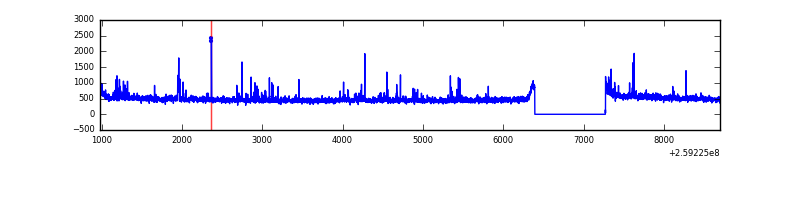 |
| D | 7716 | 6837 | 302 | 302 | 3.91% | 4.42% | 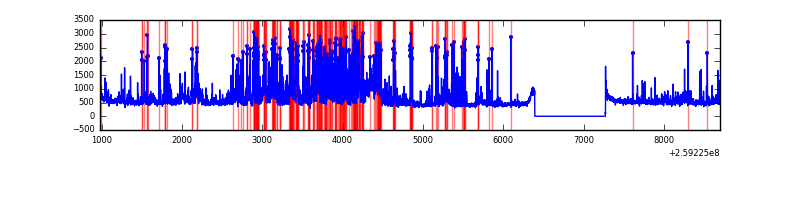 |
Top three noisy pixels from each quadrant. If the there are fewer than three noisy pixels in the level2.evt file, extra rows are filled as -1
| Pixel properties | Quadrant properties | ||||||
|---|---|---|---|---|---|---|---|
| Quadrant | DetID | PixID | Counts | Sigma | Mean | Median | Sigma |
| A | 1 | 162 | 21008 | 120.61 | 823 | 804 | 167.5 |
| A | 9 | 143 | 10801 | 59.68 | 823 | 804 | 167.5 |
| A | 1 | 178 | 8236 | 44.37 | 823 | 804 | 167.5 |
| B | 3 | 64 | 45776 | 284.34 | 825 | 802 | 158.2 |
| B | 0 | 214 | 30829 | 189.84 | 825 | 802 | 158.2 |
| B | 3 | 209 | 22477 | 137.03 | 825 | 802 | 158.2 |
| C | 14 | 220 | 139243 | 741.34 | 808 | 814 | 186.7 |
| C | 3 | 233 | 89963 | 477.42 | 808 | 814 | 186.7 |
| C | 8 | 128 | 12152 | 60.72 | 808 | 814 | 186.7 |
| D | 1 | 52 | 1777031 | 9349.7 | 789 | 766 | 190.0 |
| D | 5 | 222 | 102279 | 534.33 | 789 | 766 | 190.0 |
| D | 2 | 136 | 67907 | 353.41 | 789 | 766 | 190.0 |
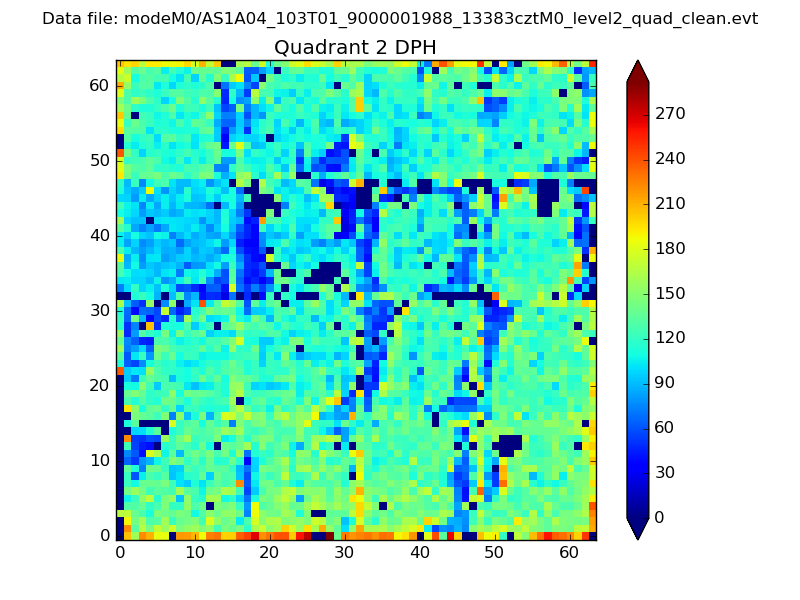
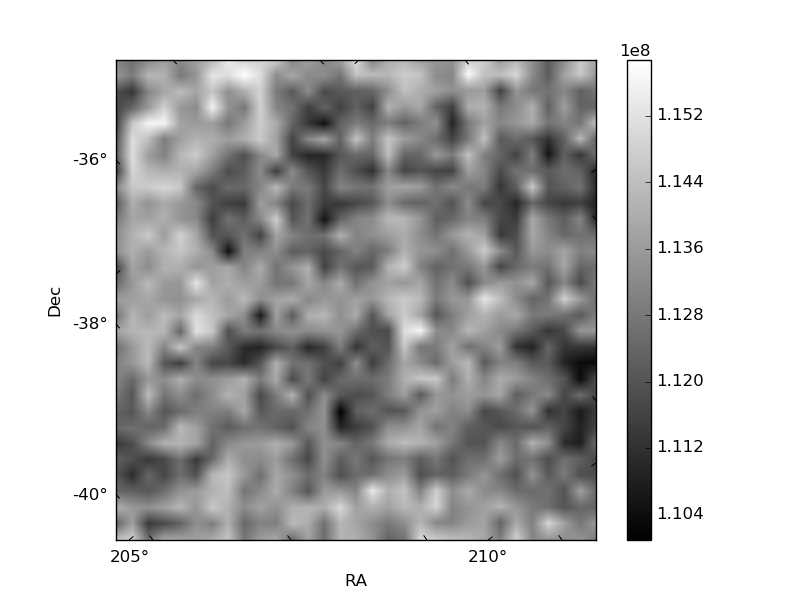
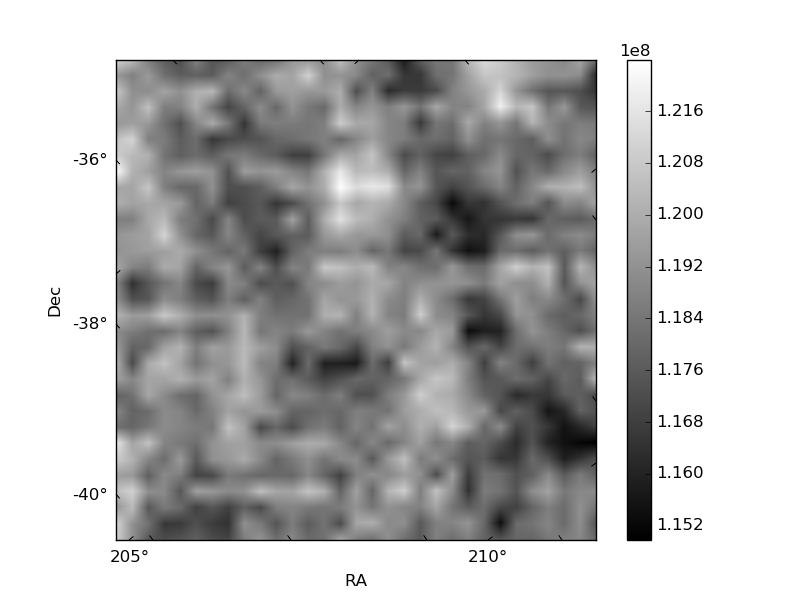
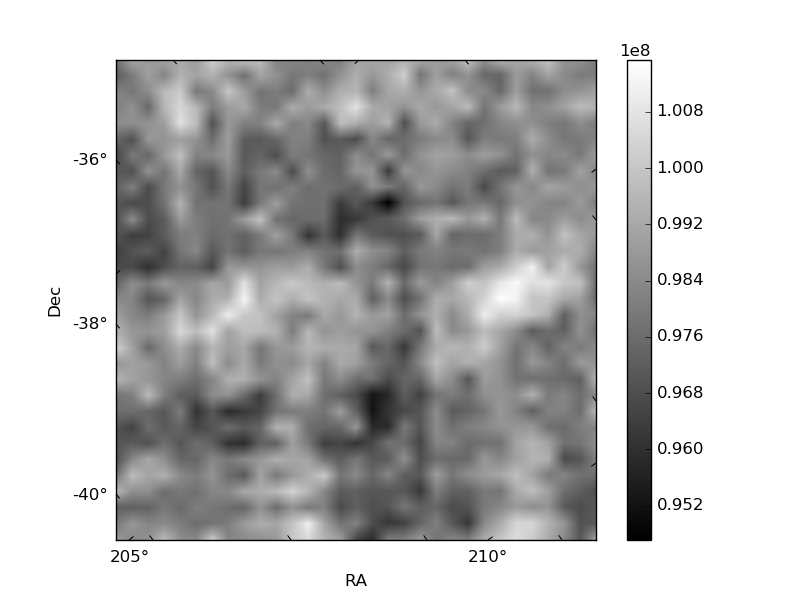
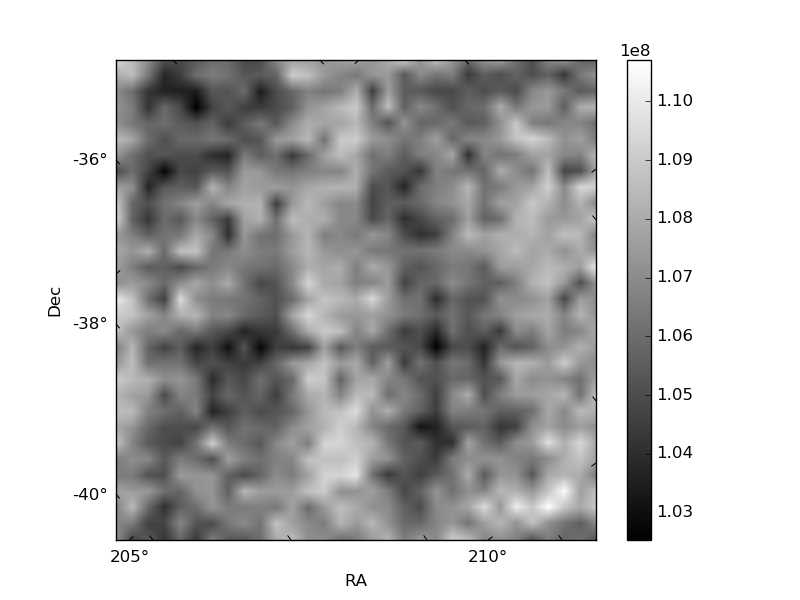
Histogram calculated using DETX and DETY for each event in the final _common_clean file
| Quadrant A |  |
 |
Quadrant B |
|---|---|---|---|
| Quadrant D |  |
 |
Quadrant C |
| Plot type | Count rate plots | Images |
|---|---|---|
| Comparison with Poisson distribution Blue bars denote a histogram of data divided into 1 sec bins. Red curve is a Poisson curve with rate = median count rate of data. |
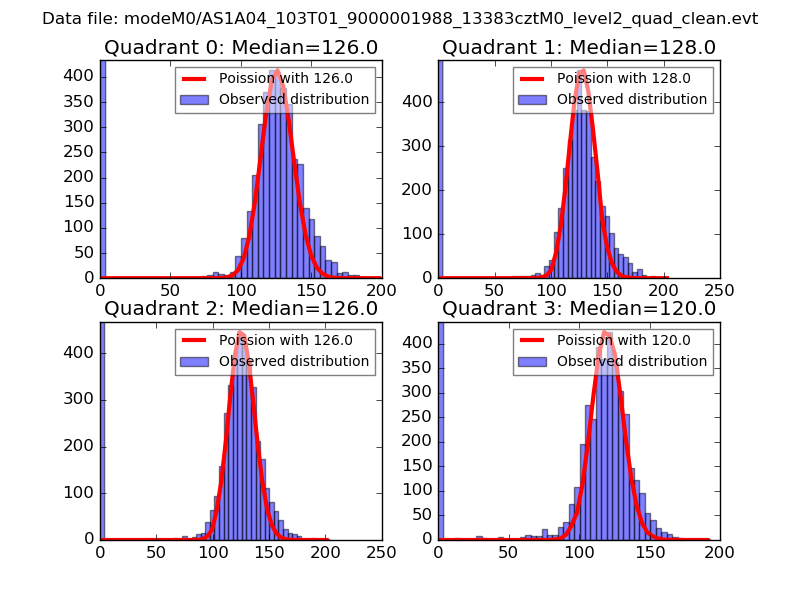 |
 |
| Quadrant-wise count rates Data is divided into 100 sec bins |
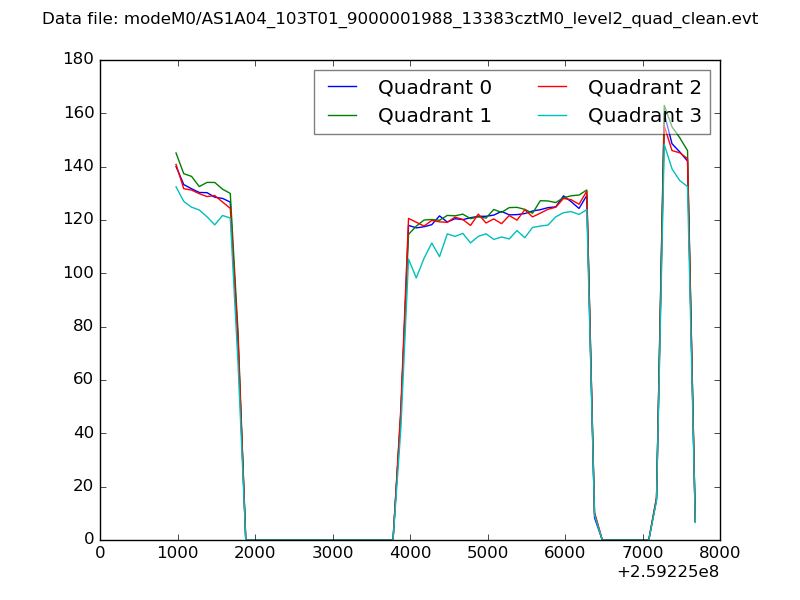 |
|
| Module-wise count rates for Quadrant A Data is divided into 100 sec bins |
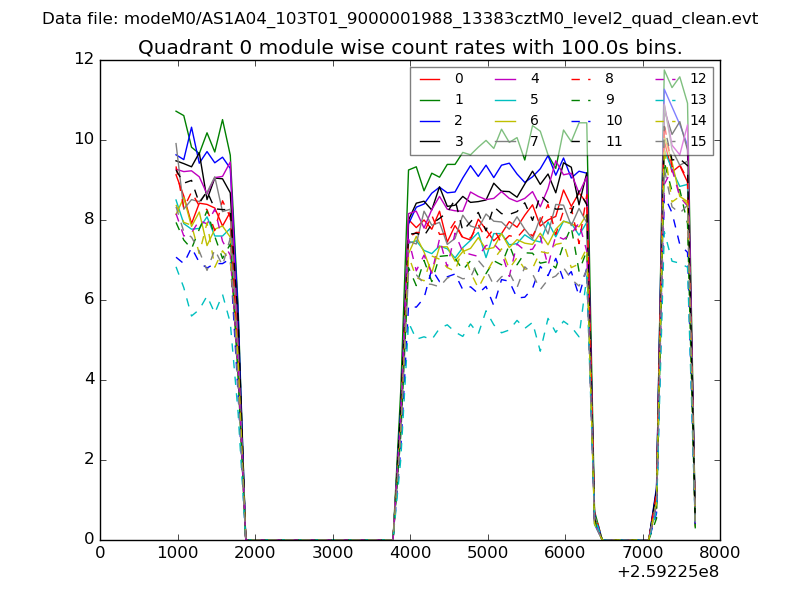 |
 |
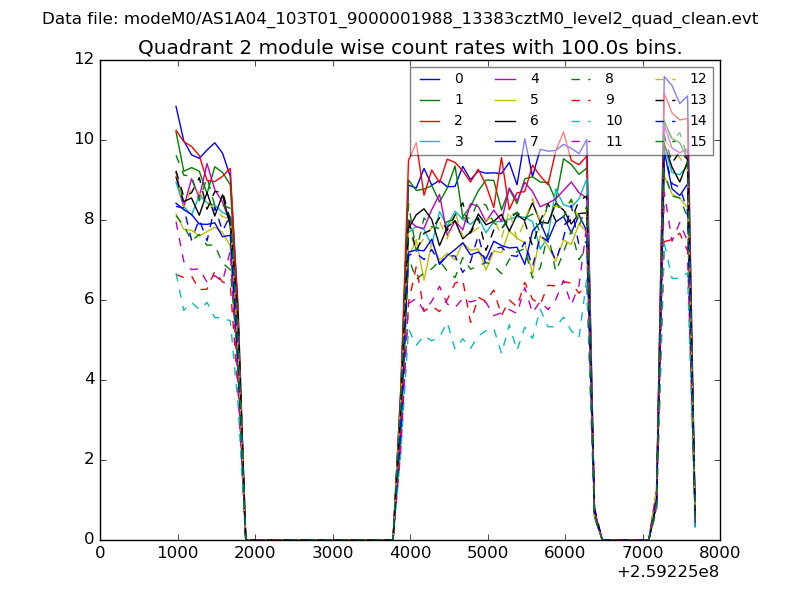
| Module-wise count rates for Quadrant B Data is divided into 100 sec bins |
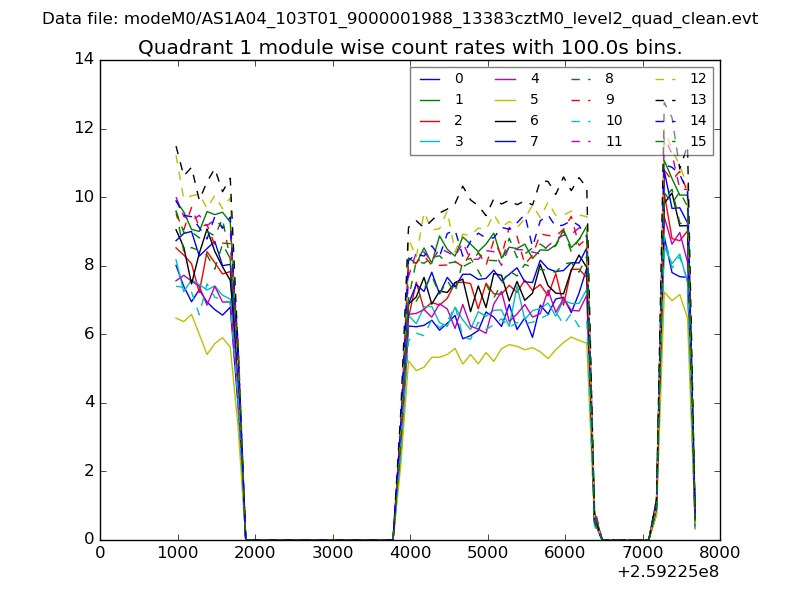 |
 |
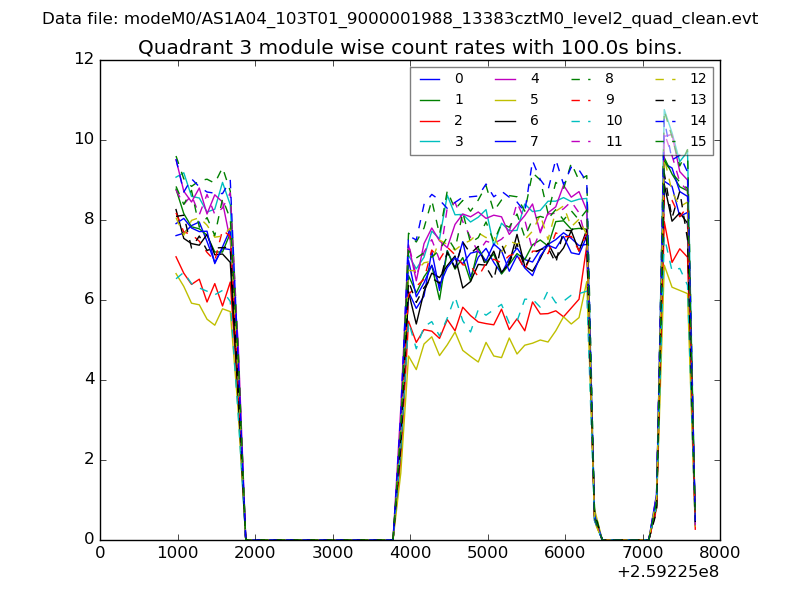
| Module-wise count rates for Quadrant C Data is divided into 100 sec bins |
 |
 |
| Module-wise count rates for Quadrant D Data is divided into 100 sec bins |
 |
 |
| Parameter | Plot |
|---|---|
| CZT HV Monitor | 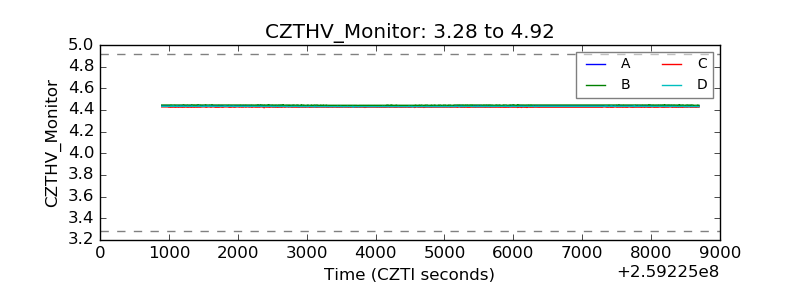 |
| D_VDD | 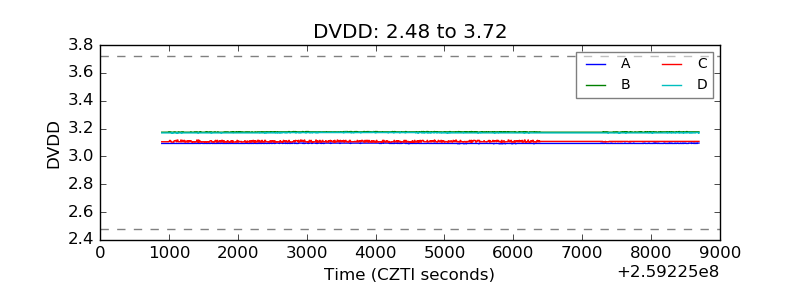 |
| Temperature 1 | 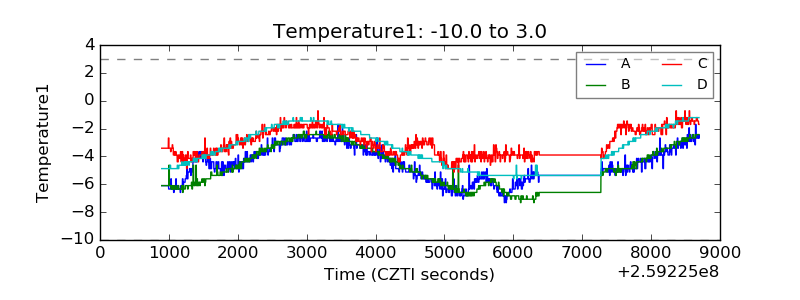 |
| Veto HV Monitor | 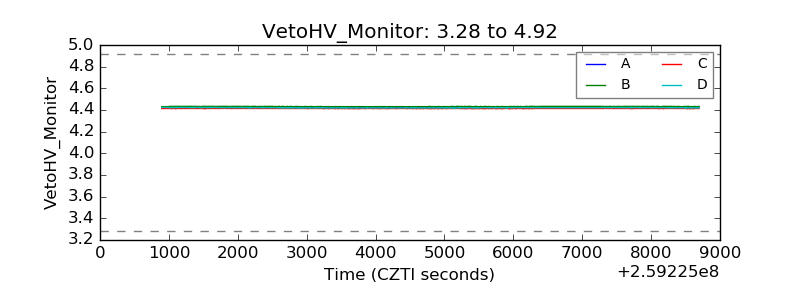 |
| Veto LLD | 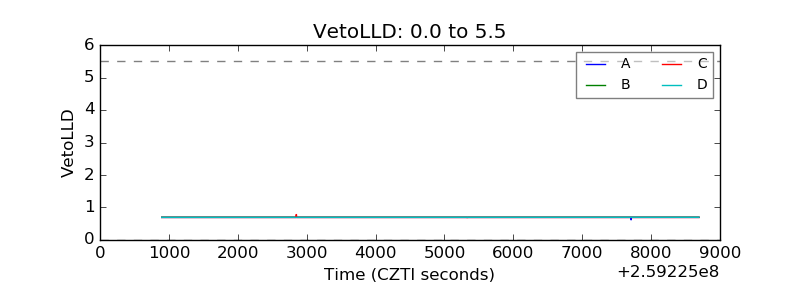 |
| Alpha Counter | 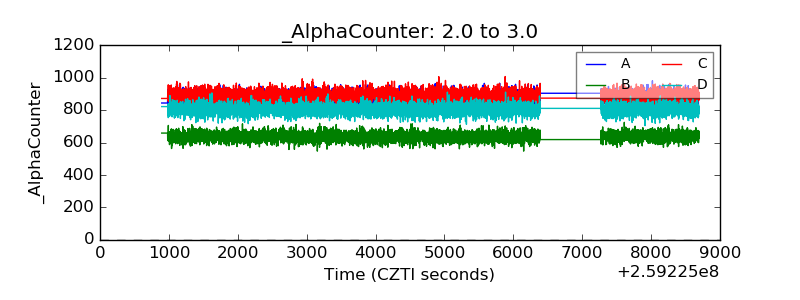 |
| _CPM_Rate | 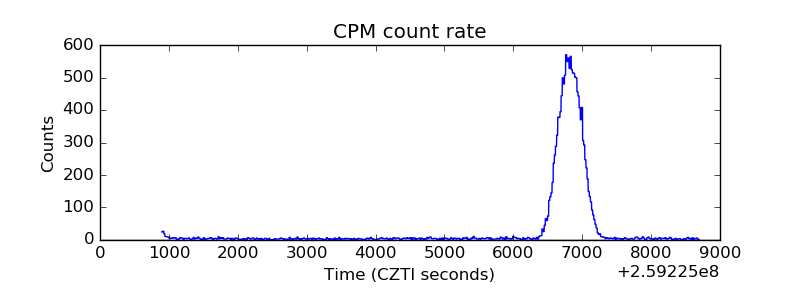 |
| CZT Counter | 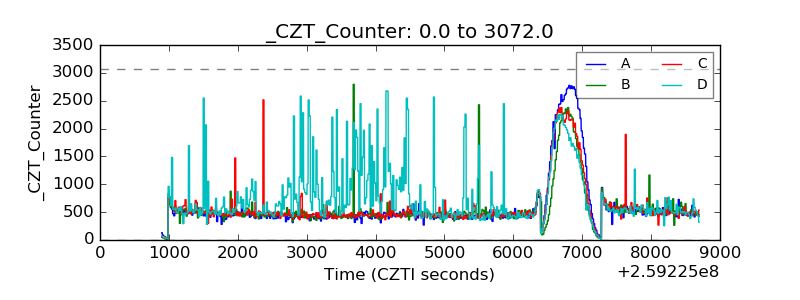 |
| +2.5 Volts monitor | 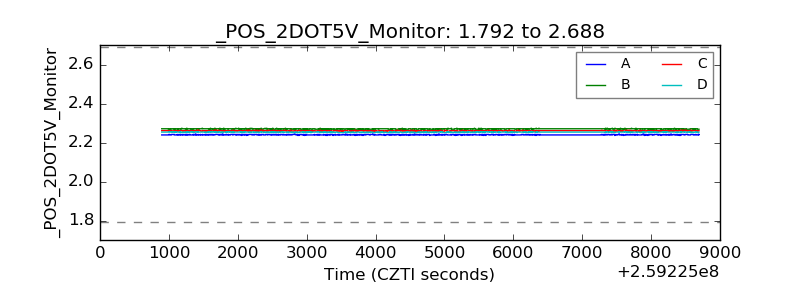 |
| +5 Volts monitor |  |
| _ROLL_ROT | 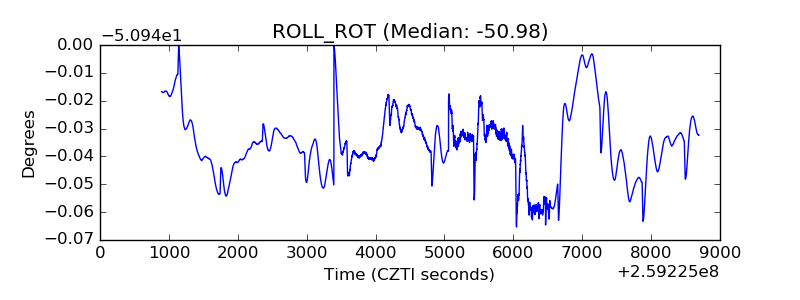 |
| _Roll_DEC | 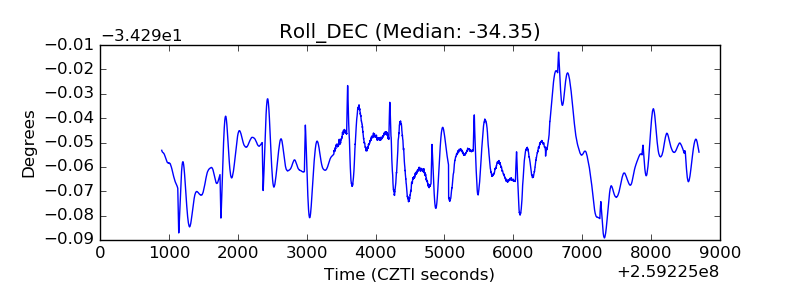 |
| _Roll_RA | 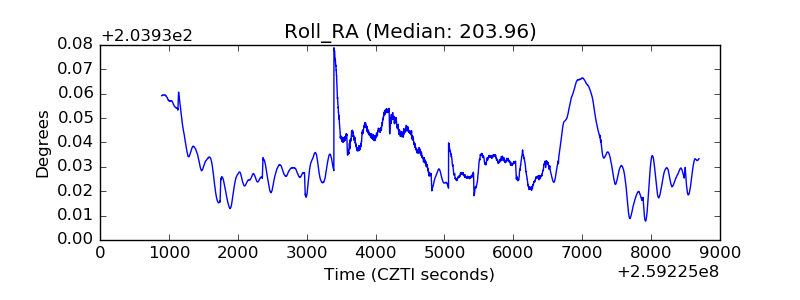 |
| Veto Counter | 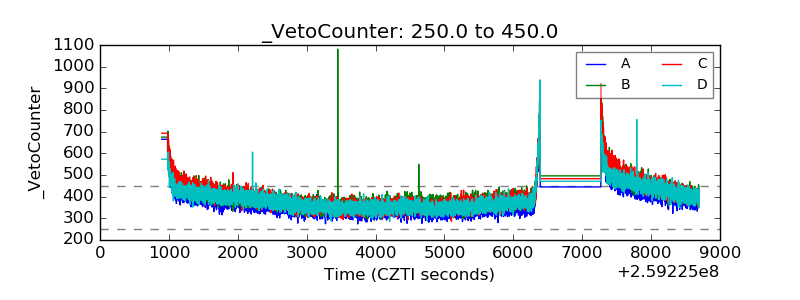 |