| Param | Original file | Final file |
|---|---|---|
| Filename | modeM0/AS1A04_103T01_9000001988_13384cztM0_level2.evt | modeM0/AS1A04_103T01_9000001988_13384cztM0_level2_quad_clean.evt |
| Size (bytes) | 480,827,520 | 70,663,680 |
| Size | 458.6 MB | 67.4 MB |
| Events in quadrant A | 3,343,234 | 421,453 |
| Events in quadrant B | 3,740,016 | 424,894 |
| Events in quadrant C | 3,489,484 | 416,731 |
| Events in quadrant D | 3,529,246 | 404,539 |
| Mode M0 | |||
|---|---|---|---|
| Quadrant | BADHDUFLAG | Total packets | Discarded packets |
| A | 0 | 14327 | 3 |
| B | 0 | 15410 | 2 |
| C | 0 | 14752 | 2 |
| D | 0 | 15092 | 2 |
| Mode SS | |||
|---|---|---|---|
| Quadrant | BADHDUFLAG | Total packets | Discarded packets |
| A | 0 | 140 | 0 |
| B | 0 | 140 | 0 |
| C | 0 | 140 | 0 |
| D | 0 | 140 | 0 |
| Mode M9 | |||
|---|---|---|---|
| Quadrant | BADHDUFLAG | Total packets | Discarded packets |
| A | 0 | 19 | 0 |
| B | 0 | 19 | 0 |
| C | 0 | 19 | 0 |
| D | 0 | 19 | 0 |
| Quadrant | Total seconds | Saturated seconds | Saturation percentage |
|---|---|---|---|
| A | 6768 | 121 | 1.787825% |
| B | 6768 | 172 | 2.541371% |
| C | 6768 | 93 | 1.374113% |
| D | 6768 | 124 | 1.832151% |
Noise dominated data is calculated using 1-second bins in cleaned event files. If a bin has >2000 counts, and if more than 50% of those come from <1% of pixels, then it is considered to be noise-dominated and hence unusable.
| Quadrant | # 1 sec bins | Bins with >0 counts | Bins with >2000 counts | High rate bins dominated by noise | Noise dominated (total time) | Noise dominated (detector-on time) | Marked lightcurve |
|---|---|---|---|---|---|---|---|
| A | 8679 | 6771 | 14 | 14 | 0.16% | 0.21% | 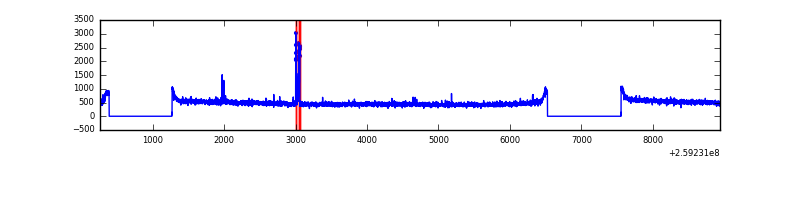 |
| B | 8679 | 6771 | 35 | 35 | 0.40% | 0.52% | 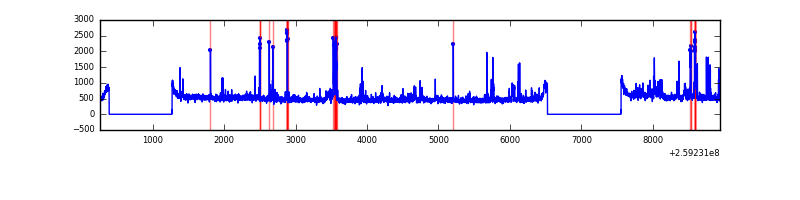 |
| C | 8679 | 6771 | 6 | 6 | 0.07% | 0.09% | 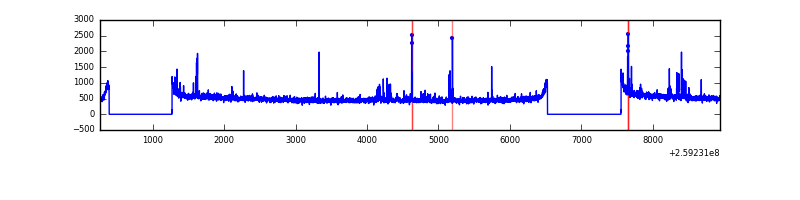 |
| D | 8679 | 6771 | 27 | 27 | 0.31% | 0.40% | 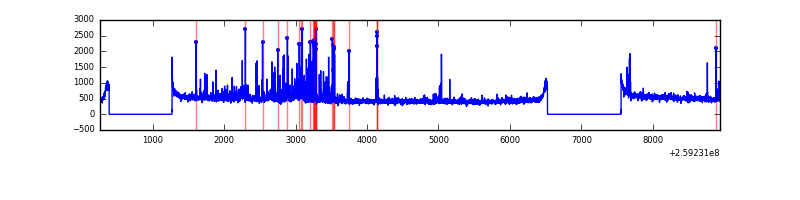 |
Top three noisy pixels from each quadrant. If the there are fewer than three noisy pixels in the level2.evt file, extra rows are filled as -1
| Pixel properties | Quadrant properties | ||||||
|---|---|---|---|---|---|---|---|
| Quadrant | DetID | PixID | Counts | Sigma | Mean | Median | Sigma |
| A | 9 | 143 | 65094 | 374.61 | 846 | 825 | 171.6 |
| A | 1 | 162 | 13711 | 75.11 | 846 | 825 | 171.6 |
| A | 0 | 226 | 7471 | 38.74 | 846 | 825 | 171.6 |
| B | 0 | 85 | 222929 | 1388.45 | 845 | 825 | 160.0 |
| B | 3 | 64 | 70168 | 433.49 | 845 | 825 | 160.0 |
| B | 0 | 230 | 36671 | 224.09 | 845 | 825 | 160.0 |
| C | 3 | 233 | 137582 | 717.56 | 826 | 830 | 190.6 |
| C | 14 | 220 | 126231 | 658.0 | 826 | 830 | 190.6 |
| C | 13 | 61 | 5853 | 26.36 | 826 | 830 | 190.6 |
| D | 13 | 249 | 148522 | 749.38 | 824 | 799 | 197.1 |
| D | 1 | 52 | 124361 | 626.82 | 824 | 799 | 197.1 |
| D | 2 | 136 | 95865 | 482.26 | 824 | 799 | 197.1 |
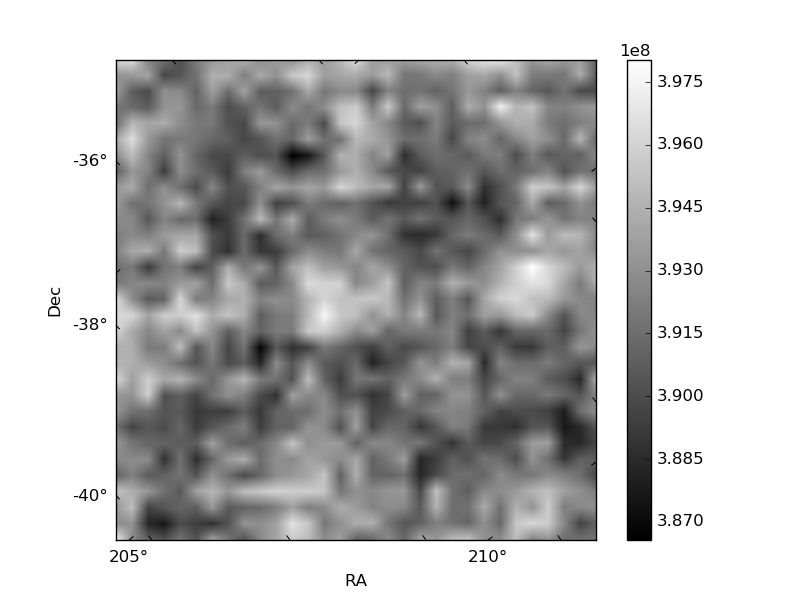
Histogram calculated using DETX and DETY for each event in the final _common_clean file
| Quadrant A | 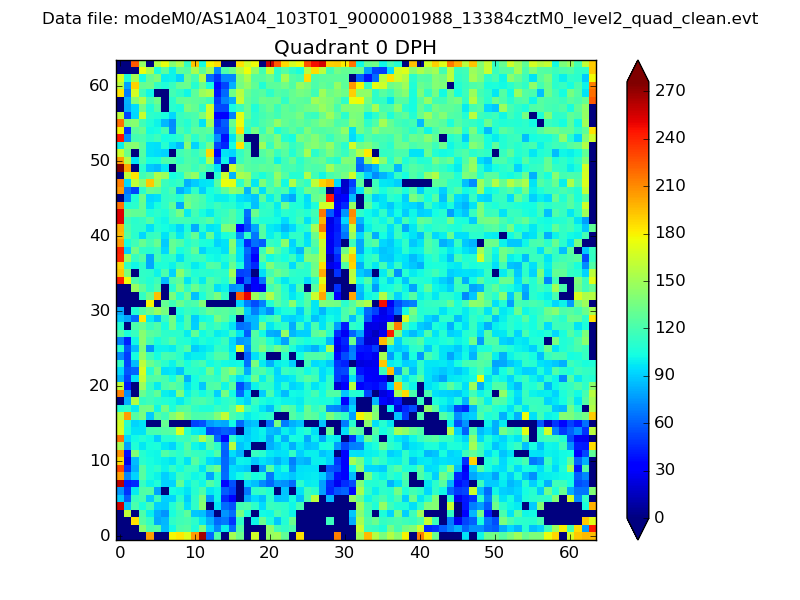 |
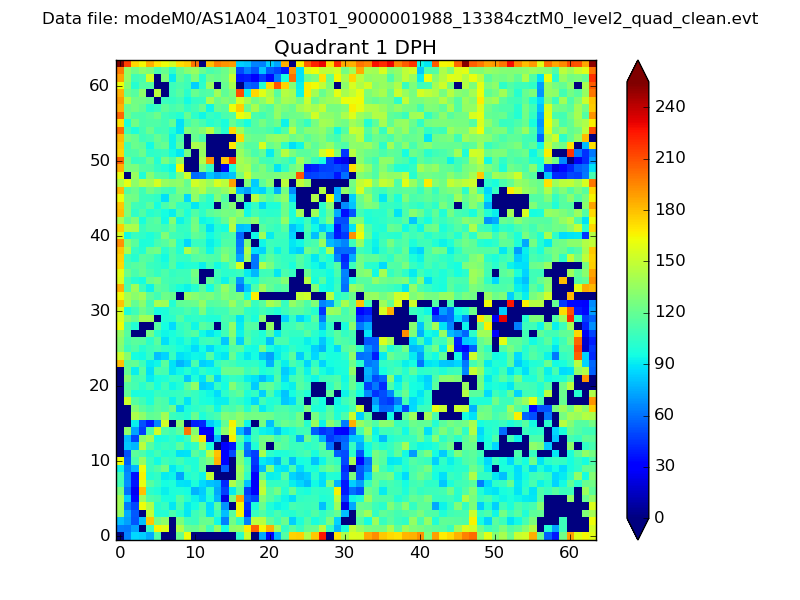 |
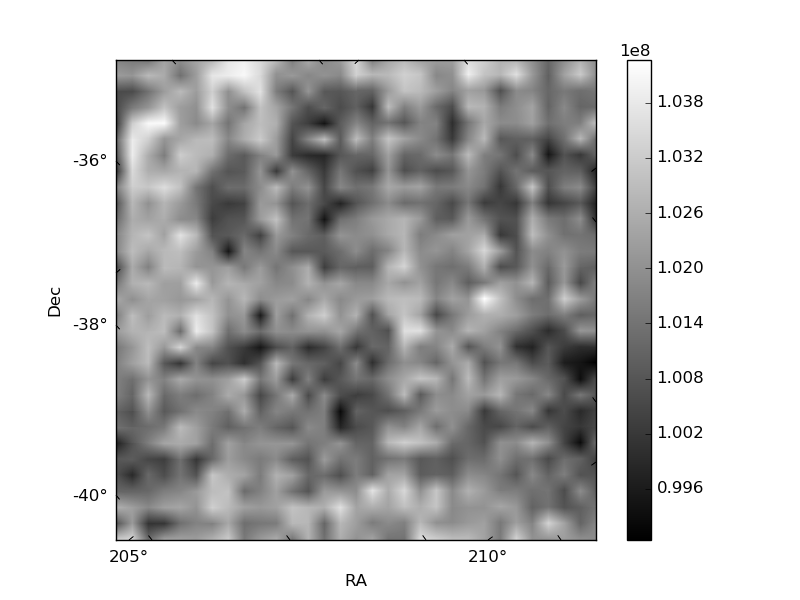
Quadrant B |
|---|---|---|---|
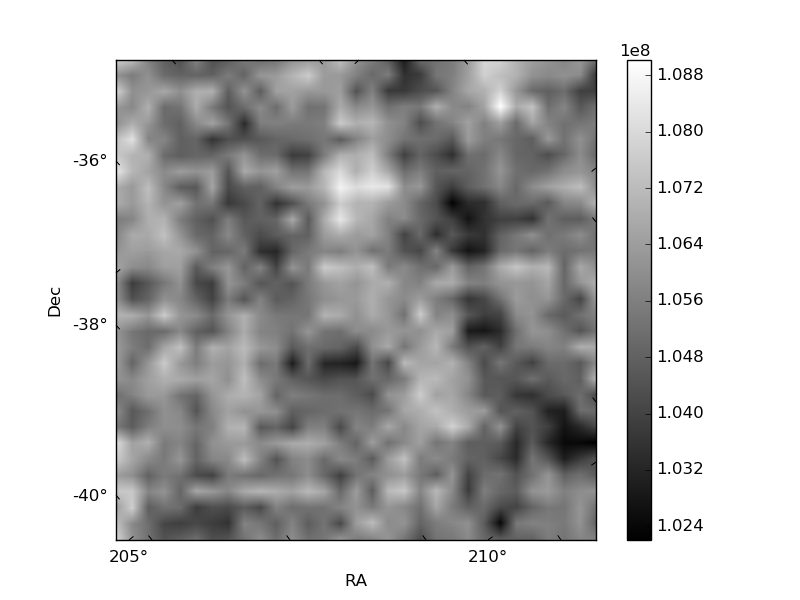
| Quadrant D | 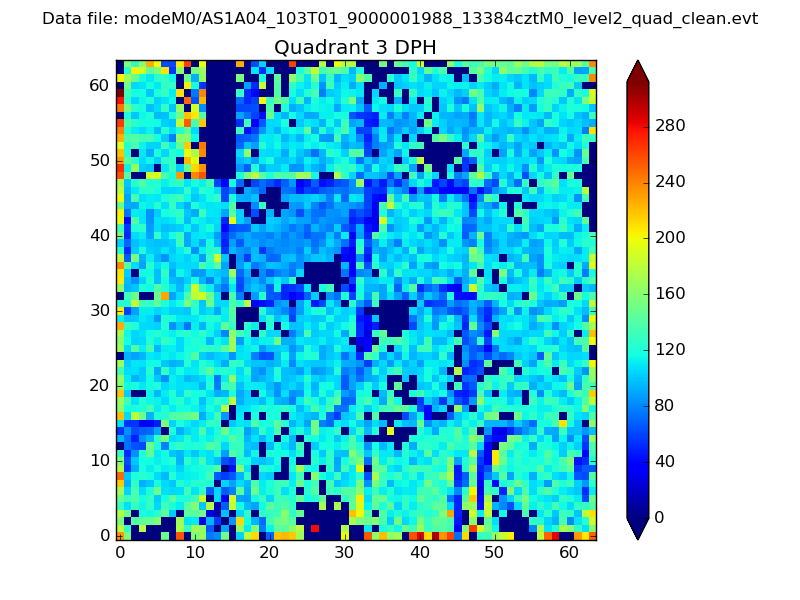 |
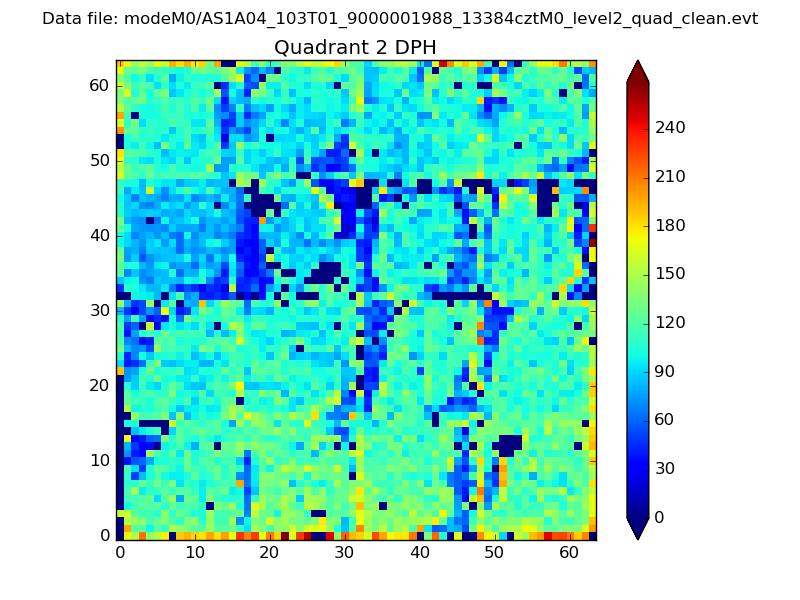 |
Quadrant C |
| Plot type | Count rate plots | Images |
|---|---|---|
| Comparison with Poisson distribution Blue bars denote a histogram of data divided into 1 sec bins. Red curve is a Poisson curve with rate = median count rate of data. |
 |
 |
| Quadrant-wise count rates Data is divided into 100 sec bins |
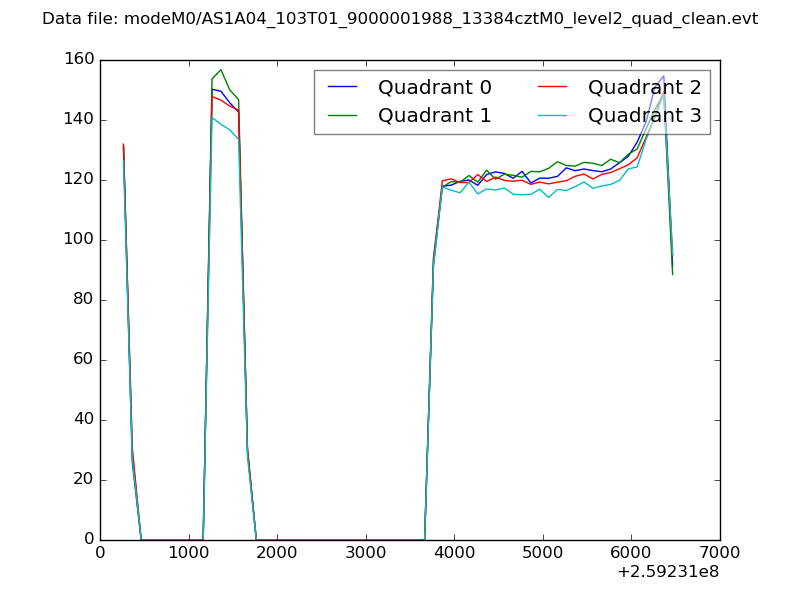 |
|
| Module-wise count rates for Quadrant A Data is divided into 100 sec bins |
 |
 |
| Module-wise count rates for Quadrant B Data is divided into 100 sec bins |
 |
 |
| Module-wise count rates for Quadrant C Data is divided into 100 sec bins |
 |
 |
| Module-wise count rates for Quadrant D Data is divided into 100 sec bins |
 |
 |
| Parameter | Plot |
|---|---|
| CZT HV Monitor |  |
| D_VDD | 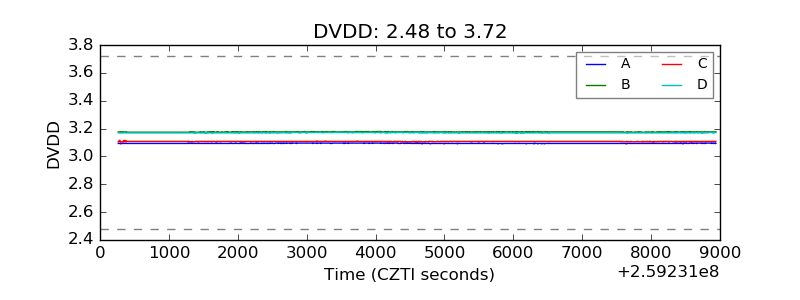 |
| Temperature 1 | 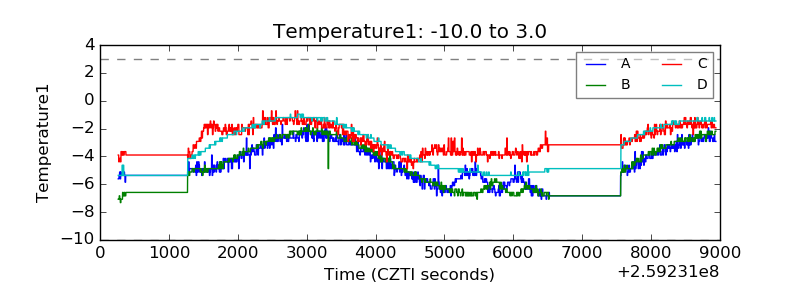 |
| Veto HV Monitor | 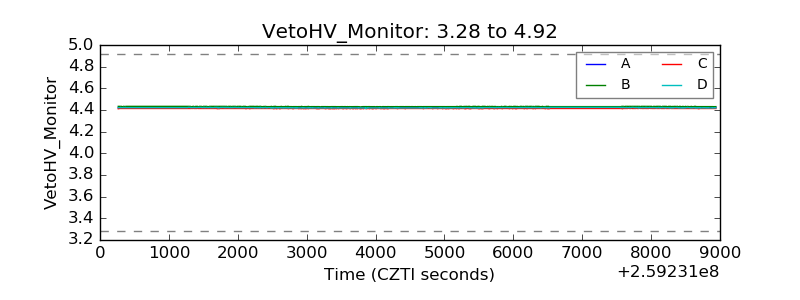 |
| Veto LLD | 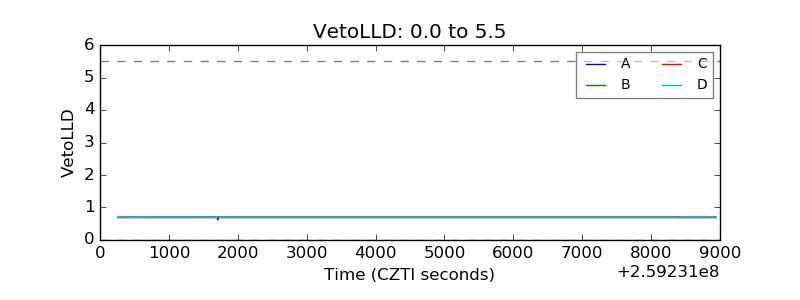 |
| Alpha Counter | 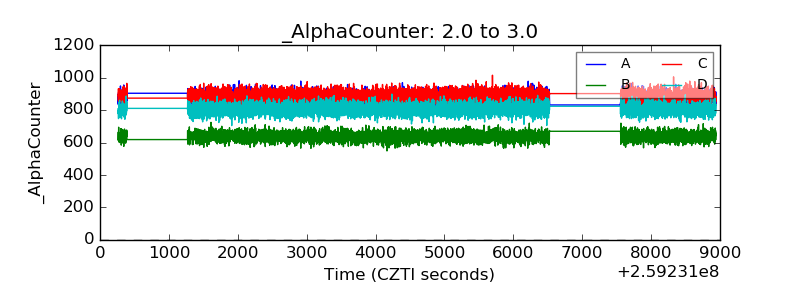 |
| _CPM_Rate | 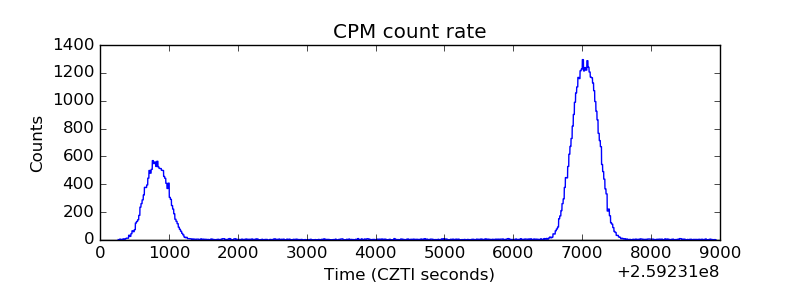 |
| CZT Counter | 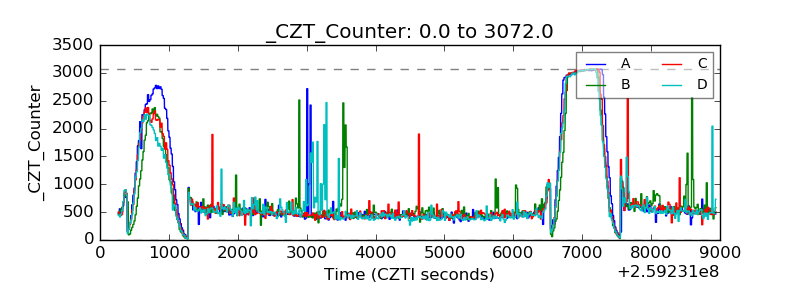 |
| +2.5 Volts monitor |  |
| +5 Volts monitor | 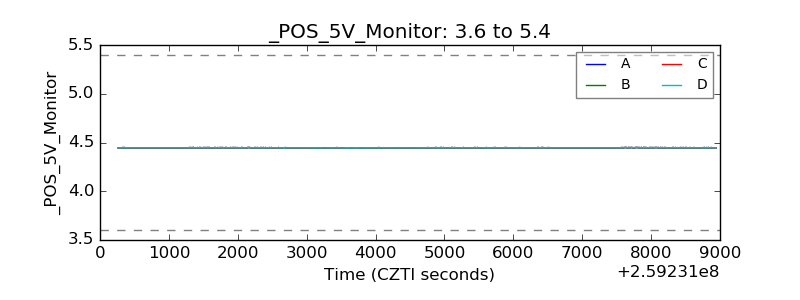 |
| _ROLL_ROT | 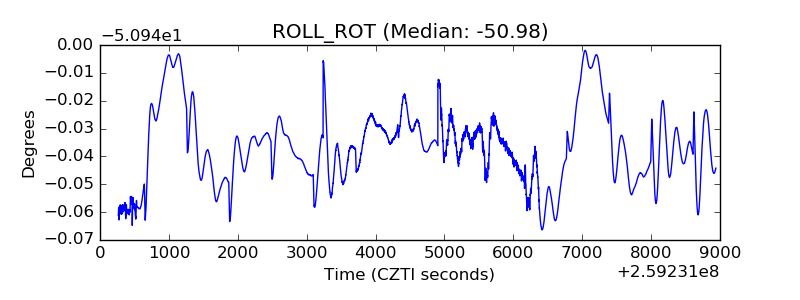 |
| _Roll_DEC | 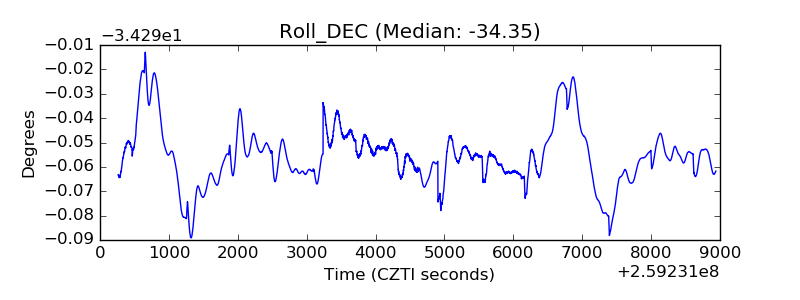 |
| _Roll_RA | 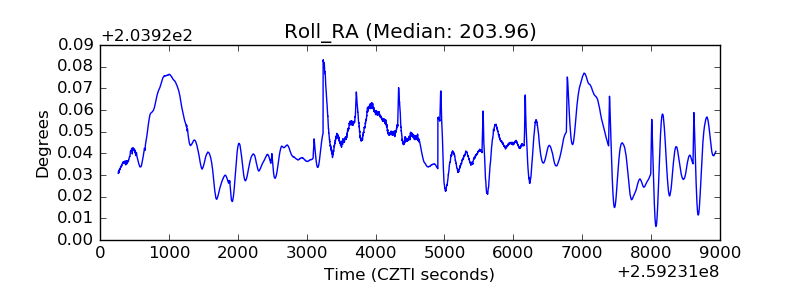 |
| Veto Counter |  |