| Param | Original file | Final file |
|---|---|---|
| Filename | modeM0/AS1A04_103T01_9000001988_13387cztM0_level2.evt | modeM0/AS1A04_103T01_9000001988_13387cztM0_level2_quad_clean.evt |
| Size (bytes) | 470,485,440 | 78,174,720 |
| Size | 448.7 MB | 74.6 MB |
| Events in quadrant A | 3,340,699 | 484,487 |
| Events in quadrant B | 3,523,074 | 494,136 |
| Events in quadrant C | 3,489,137 | 478,620 |
| Events in quadrant D | 3,457,859 | 459,962 |
| Mode M0 | |||
|---|---|---|---|
| Quadrant | BADHDUFLAG | Total packets | Discarded packets |
| A | 0 | 14187 | 3 |
| B | 0 | 14673 | 2 |
| C | 0 | 14538 | 2 |
| D | 0 | 14649 | 2 |
| Mode SS | |||
|---|---|---|---|
| Quadrant | BADHDUFLAG | Total packets | Discarded packets |
| A | 0 | 130 | 0 |
| B | 0 | 130 | 0 |
| C | 0 | 130 | 0 |
| D | 0 | 130 | 0 |
| Mode M9 | |||
|---|---|---|---|
| Quadrant | BADHDUFLAG | Total packets | Discarded packets |
| A | 0 | 19 | 0 |
| B | 0 | 19 | 0 |
| C | 0 | 19 | 0 |
| D | 0 | 20 | 0 |
| Quadrant | Total seconds | Saturated seconds | Saturation percentage |
|---|---|---|---|
| A | 6453 | 88 | 1.363707% |
| B | 6453 | 96 | 1.487680% |
| C | 6453 | 80 | 1.239733% |
| D | 6453 | 94 | 1.456687% |
Noise dominated data is calculated using 1-second bins in cleaned event files. If a bin has >2000 counts, and if more than 50% of those come from <1% of pixels, then it is considered to be noise-dominated and hence unusable.
| Quadrant | # 1 sec bins | Bins with >0 counts | Bins with >2000 counts | High rate bins dominated by noise | Noise dominated (total time) | Noise dominated (detector-on time) | Marked lightcurve |
|---|---|---|---|---|---|---|---|
| A | 7719 | 6455 | 0 | 0 | 0.00% | 0.00% | 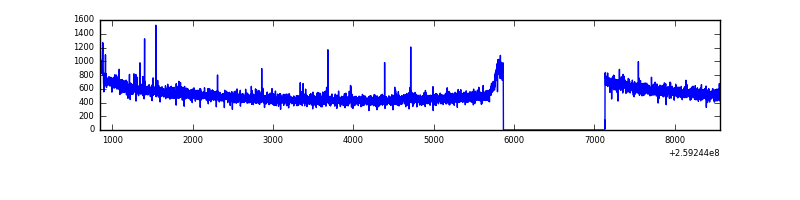 |
| B | 7719 | 6455 | 1 | 1 | 0.01% | 0.02% | 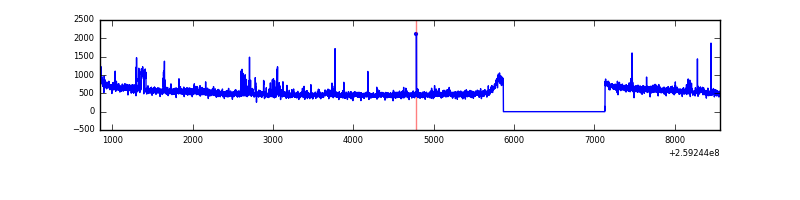 |
| C | 7719 | 6455 | 3 | 3 | 0.04% | 0.05% | 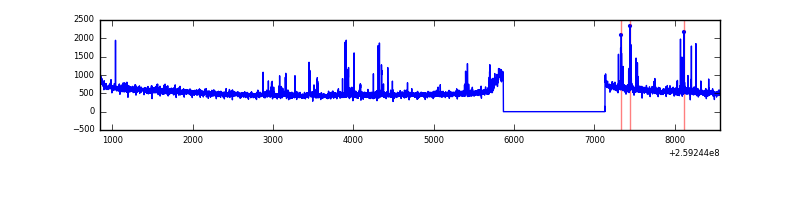 |
| D | 7719 | 6455 | 14 | 14 | 0.18% | 0.22% | 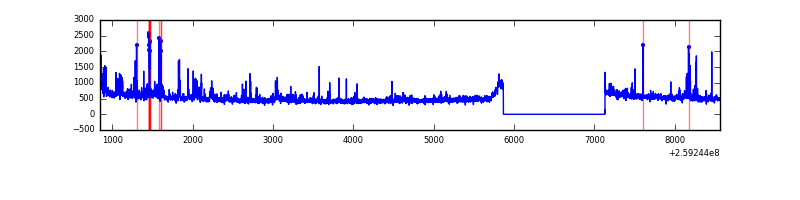 |
Top three noisy pixels from each quadrant. If the there are fewer than three noisy pixels in the level2.evt file, extra rows are filled as -1
| Pixel properties | Quadrant properties | ||||||
|---|---|---|---|---|---|---|---|
| Quadrant | DetID | PixID | Counts | Sigma | Mean | Median | Sigma |
| A | 15 | 69 | 21492 | 121.47 | 858 | 842 | 170.0 |
| A | 8 | 15 | 8697 | 46.2 | 858 | 842 | 170.0 |
| A | 1 | 162 | 7992 | 42.06 | 858 | 842 | 170.0 |
| B | 10 | 245 | 32766 | 200.66 | 858 | 840 | 159.1 |
| B | 0 | 85 | 30744 | 187.95 | 858 | 840 | 159.1 |
| B | 0 | 214 | 30045 | 183.55 | 858 | 840 | 159.1 |
| C | 14 | 220 | 140649 | 748.76 | 824 | 830 | 186.7 |
| C | 3 | 233 | 129370 | 688.36 | 824 | 830 | 186.7 |
| C | 13 | 61 | 5993 | 27.65 | 824 | 830 | 186.7 |
| D | 1 | 52 | 238819 | 1234.08 | 818 | 796 | 192.9 |
| D | 13 | 249 | 51683 | 263.83 | 818 | 796 | 192.9 |
| D | 9 | 85 | 30779 | 155.45 | 818 | 796 | 192.9 |
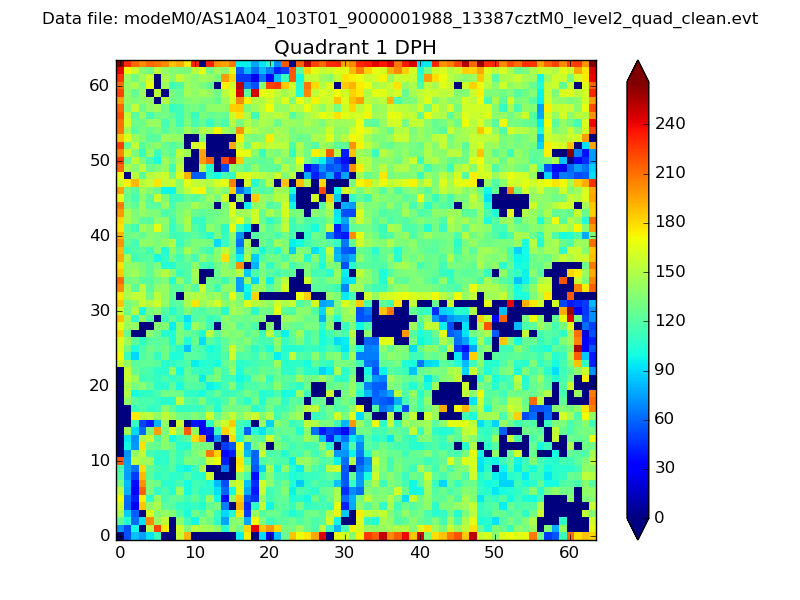
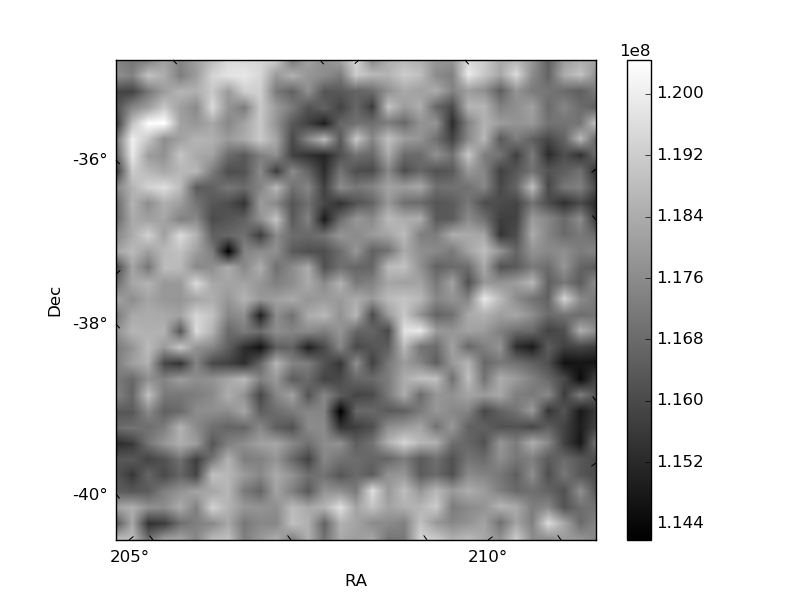
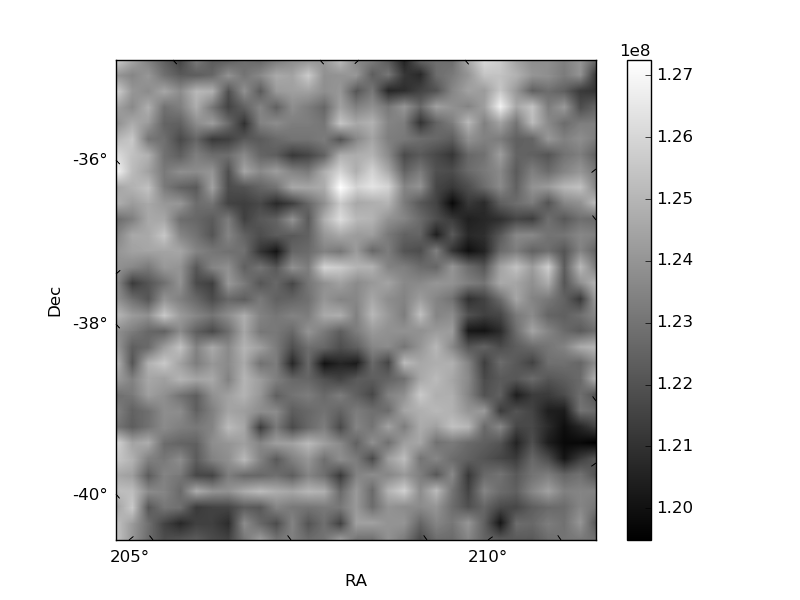
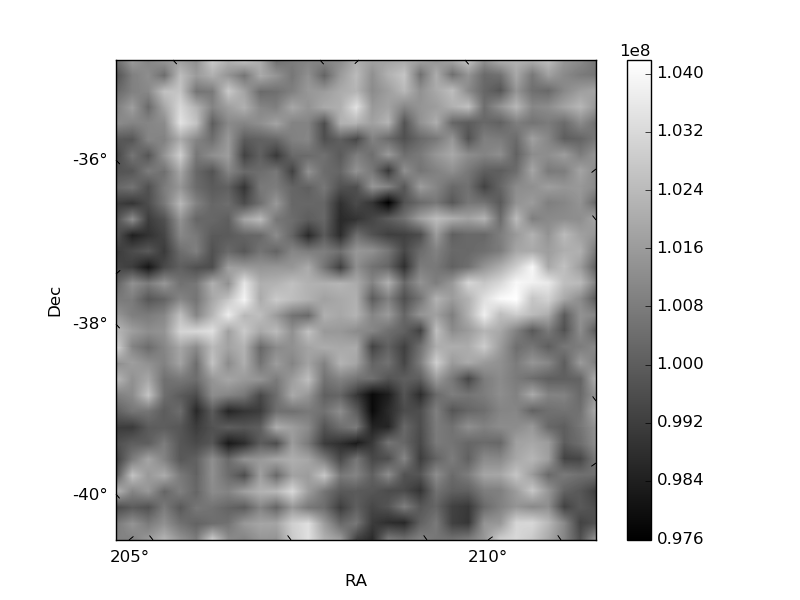
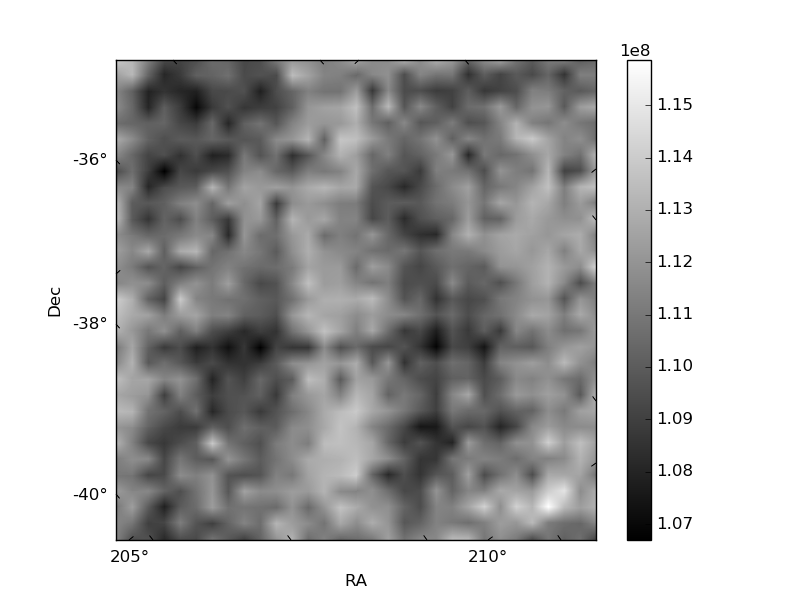
Histogram calculated using DETX and DETY for each event in the final _common_clean file
| Quadrant A |  |
 |
Quadrant B |
|---|---|---|---|
| Quadrant D | 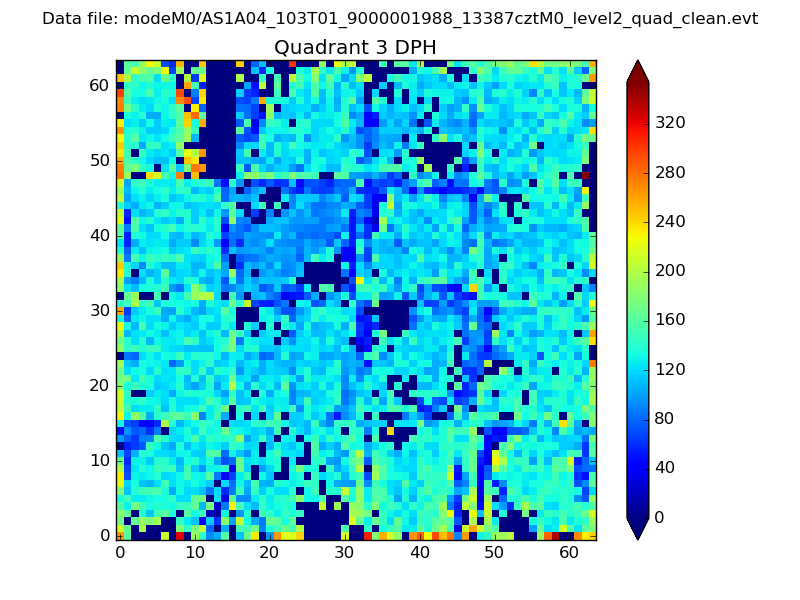 |
 |
Quadrant C |
| Plot type | Count rate plots | Images |
|---|---|---|
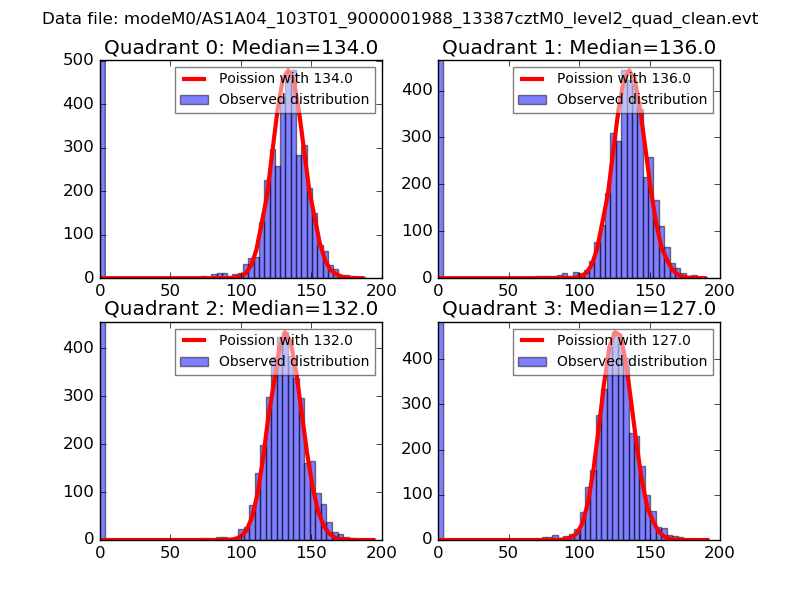
| Comparison with Poisson distribution Blue bars denote a histogram of data divided into 1 sec bins. Red curve is a Poisson curve with rate = median count rate of data. |
 |
 |
| Quadrant-wise count rates Data is divided into 100 sec bins |
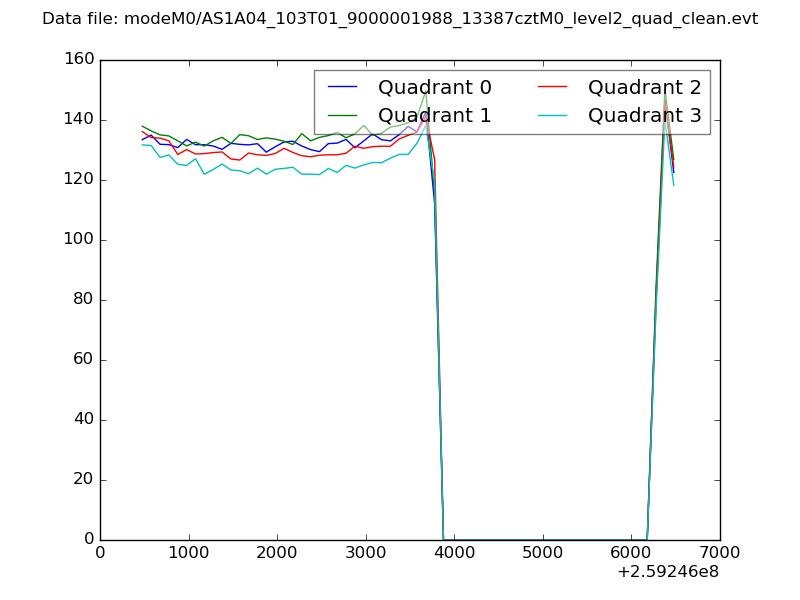 |
|
| Module-wise count rates for Quadrant A Data is divided into 100 sec bins |
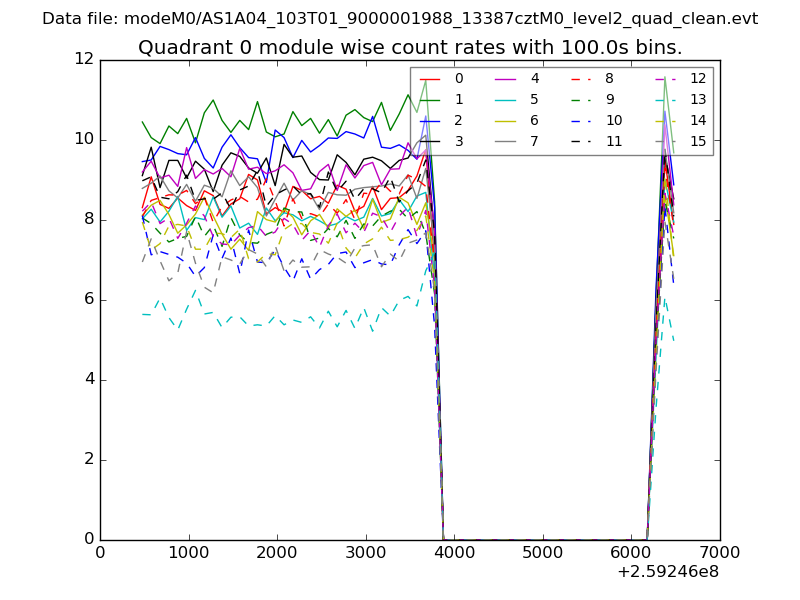 |
 |
| Module-wise count rates for Quadrant B Data is divided into 100 sec bins |
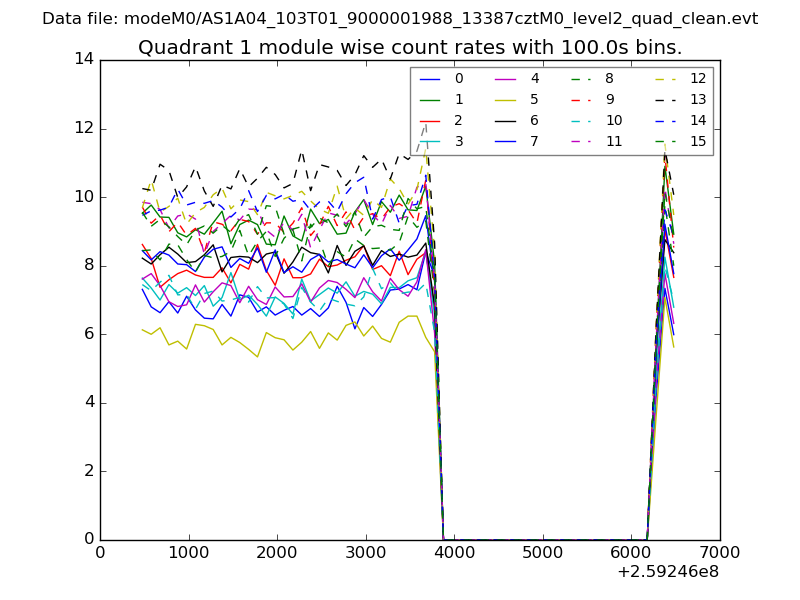 |
 |
| Module-wise count rates for Quadrant C Data is divided into 100 sec bins |
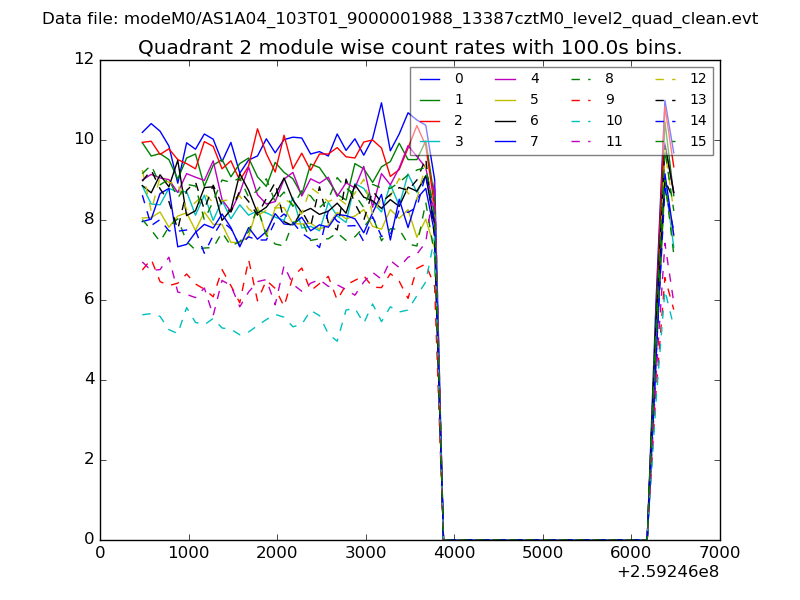 |
 |
| Module-wise count rates for Quadrant D Data is divided into 100 sec bins |
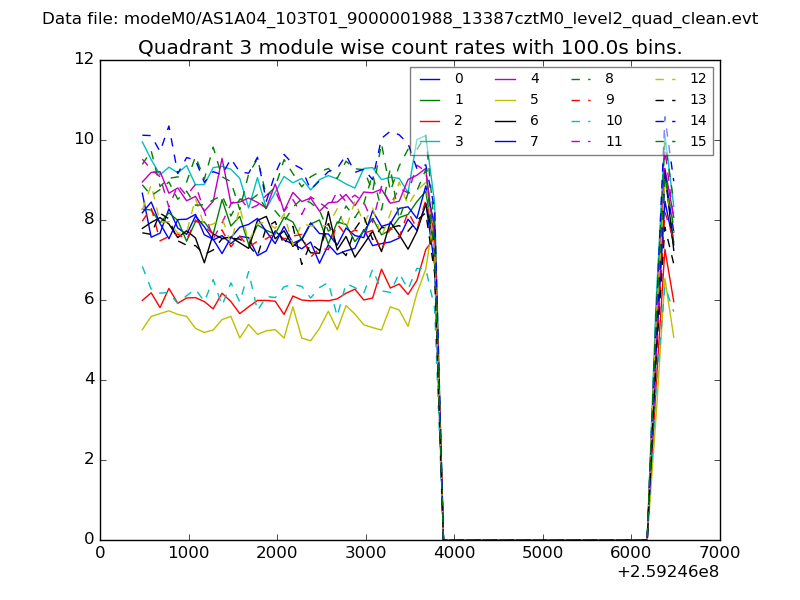 |
 |
| Parameter | Plot |
|---|---|
| CZT HV Monitor | 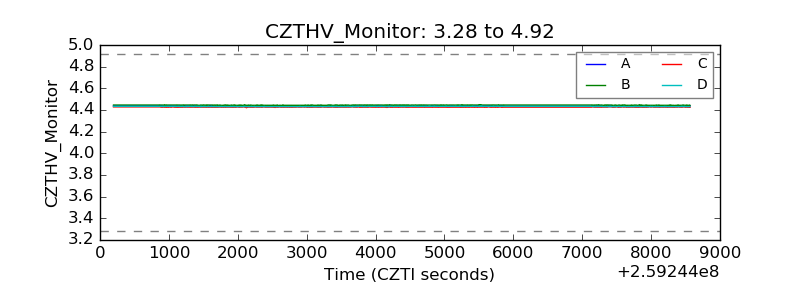 |
| D_VDD | 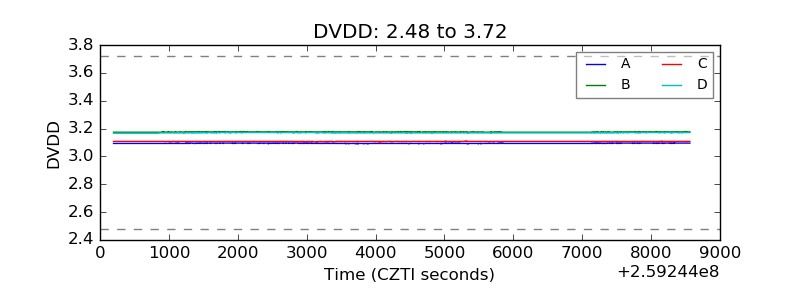 |
| Temperature 1 | 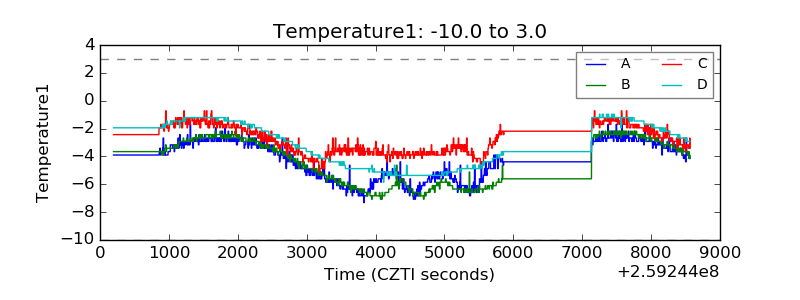 |
| Veto HV Monitor | 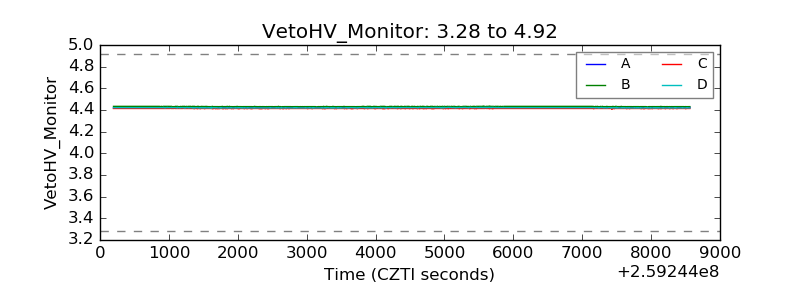 |
| Veto LLD | 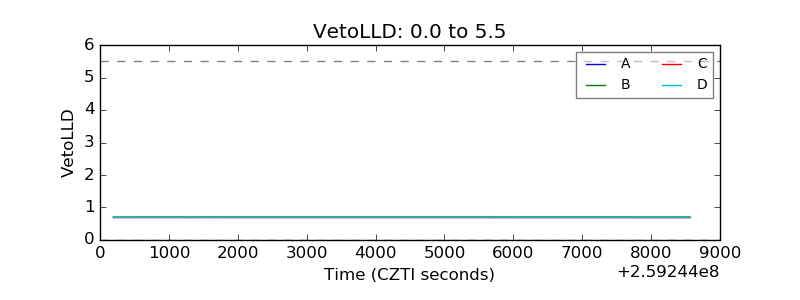 |
| Alpha Counter | 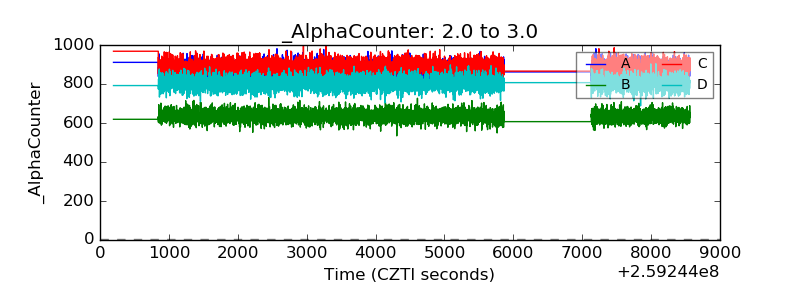 |
| _CPM_Rate | 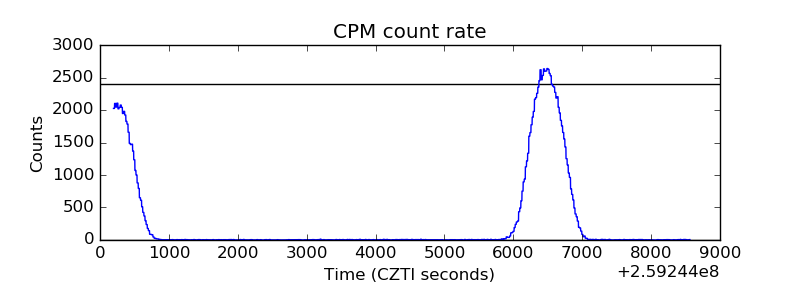 |
| CZT Counter | 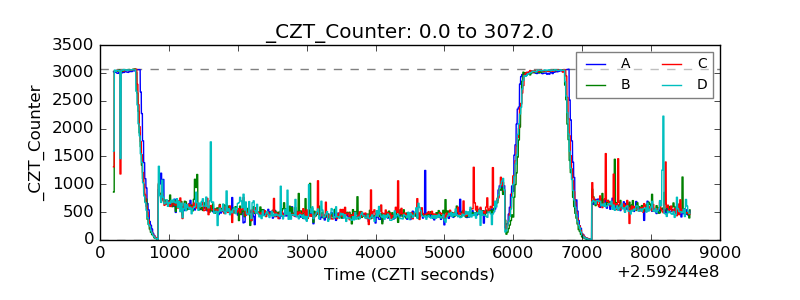 |
| +2.5 Volts monitor |  |
| +5 Volts monitor |  |
| _ROLL_ROT | 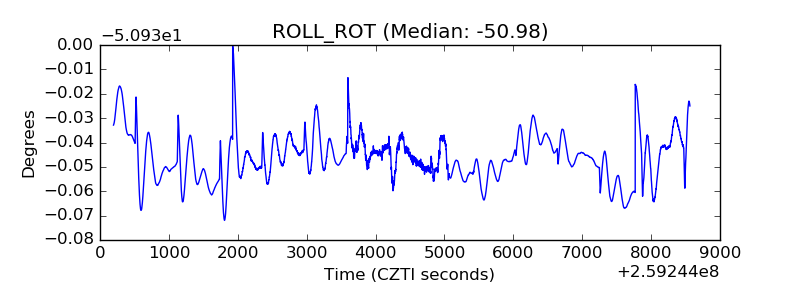 |
| _Roll_DEC | 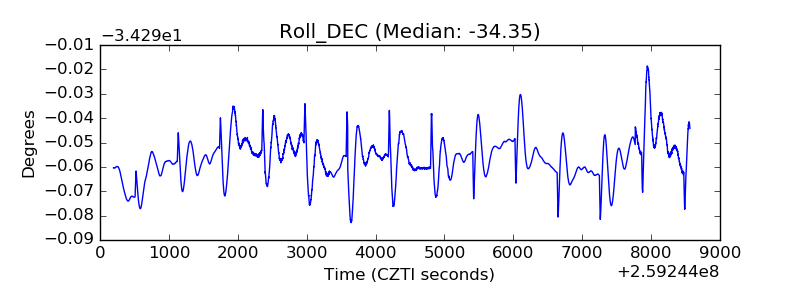 |
| _Roll_RA | 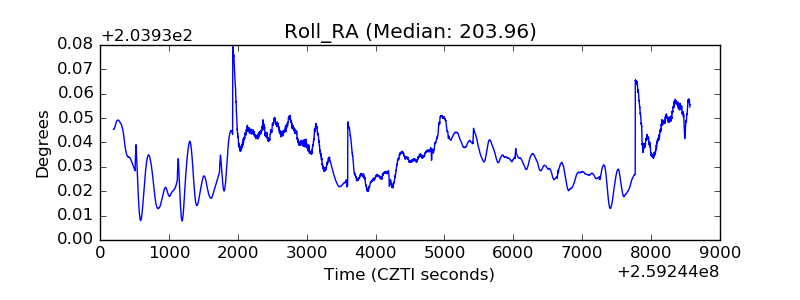 |
| Veto Counter | 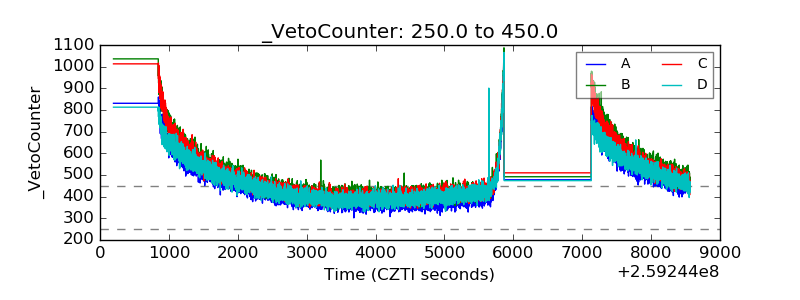 |