| Param | Original file | Final file |
|---|---|---|
| Filename | modeM0/AS1A04_103T01_9000001988_13388cztM0_level2.evt | modeM0/AS1A04_103T01_9000001988_13388cztM0_level2_quad_clean.evt |
| Size (bytes) | 486,973,440 | 92,430,720 |
| Size | 464.4 MB | 88.1 MB |
| Events in quadrant A | 3,343,412 | 603,337 |
| Events in quadrant B | 3,405,081 | 617,080 |
| Events in quadrant C | 3,419,447 | 592,765 |
| Events in quadrant D | 4,151,680 | 545,426 |
| Mode M0 | |||
|---|---|---|---|
| Quadrant | BADHDUFLAG | Total packets | Discarded packets |
| A | 0 | 14040 | 3 |
| B | 0 | 14184 | 2 |
| C | 0 | 14122 | 2 |
| D | 0 | 16454 | 2 |
| Mode SS | |||
|---|---|---|---|
| Quadrant | BADHDUFLAG | Total packets | Discarded packets |
| A | 0 | 128 | 0 |
| B | 0 | 128 | 0 |
| C | 0 | 128 | 0 |
| D | 0 | 128 | 0 |
| Mode M9 | |||
|---|---|---|---|
| Quadrant | BADHDUFLAG | Total packets | Discarded packets |
| A | 0 | 23 | 0 |
| B | 0 | 23 | 0 |
| C | 0 | 23 | 0 |
| D | 0 | 24 | 0 |
| Quadrant | Total seconds | Saturated seconds | Saturation percentage |
|---|---|---|---|
| A | 6312 | 70 | 1.108999% |
| B | 6312 | 73 | 1.156527% |
| C | 6312 | 60 | 0.950570% |
| D | 6312 | 372 | 5.893536% |
Noise dominated data is calculated using 1-second bins in cleaned event files. If a bin has >2000 counts, and if more than 50% of those come from <1% of pixels, then it is considered to be noise-dominated and hence unusable.
| Quadrant | # 1 sec bins | Bins with >0 counts | Bins with >2000 counts | High rate bins dominated by noise | Noise dominated (total time) | Noise dominated (detector-on time) | Marked lightcurve |
|---|---|---|---|---|---|---|---|
| A | 7638 | 6314 | 4 | 4 | 0.05% | 0.06% | 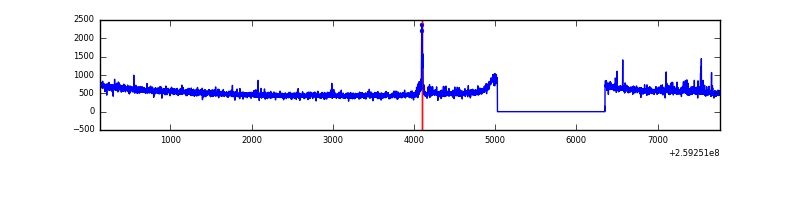 |
| B | 7638 | 6314 | 2 | 2 | 0.03% | 0.03% | 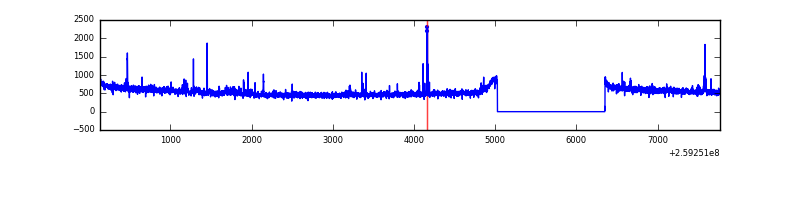 |
| C | 7638 | 6314 | 7 | 7 | 0.09% | 0.11% | 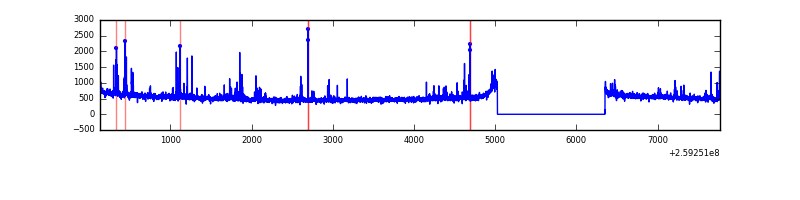 |
| D | 7638 | 6314 | 318 | 318 | 4.16% | 5.04% | 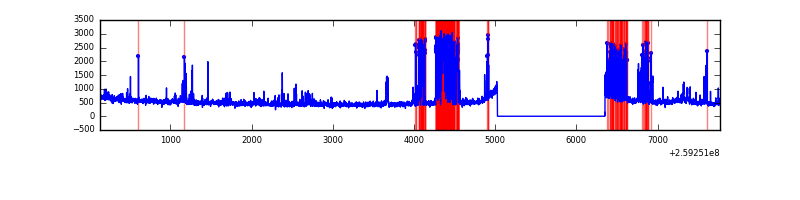 |
Top three noisy pixels from each quadrant. If the there are fewer than three noisy pixels in the level2.evt file, extra rows are filled as -1
| Pixel properties | Quadrant properties | ||||||
|---|---|---|---|---|---|---|---|
| Quadrant | DetID | PixID | Counts | Sigma | Mean | Median | Sigma |
| A | 15 | 69 | 43178 | 250.82 | 844 | 829 | 168.8 |
| A | 9 | 143 | 27394 | 157.34 | 844 | 829 | 168.8 |
| A | 1 | 162 | 14579 | 81.44 | 844 | 829 | 168.8 |
| B | 0 | 85 | 29334 | 182.31 | 848 | 831 | 156.3 |
| B | 3 | 64 | 21721 | 133.62 | 848 | 831 | 156.3 |
| B | 3 | 209 | 17397 | 105.96 | 848 | 831 | 156.3 |
| C | 14 | 220 | 167485 | 907.87 | 807 | 814 | 183.6 |
| C | 3 | 233 | 101629 | 549.15 | 807 | 814 | 183.6 |
| C | 13 | 61 | 5915 | 27.79 | 807 | 814 | 183.6 |
| D | 1 | 52 | 1061185 | 5657.36 | 783 | 761 | 187.4 |
| D | 13 | 249 | 68503 | 361.4 | 783 | 761 | 187.4 |
| D | 13 | 122 | 24724 | 127.84 | 783 | 761 | 187.4 |
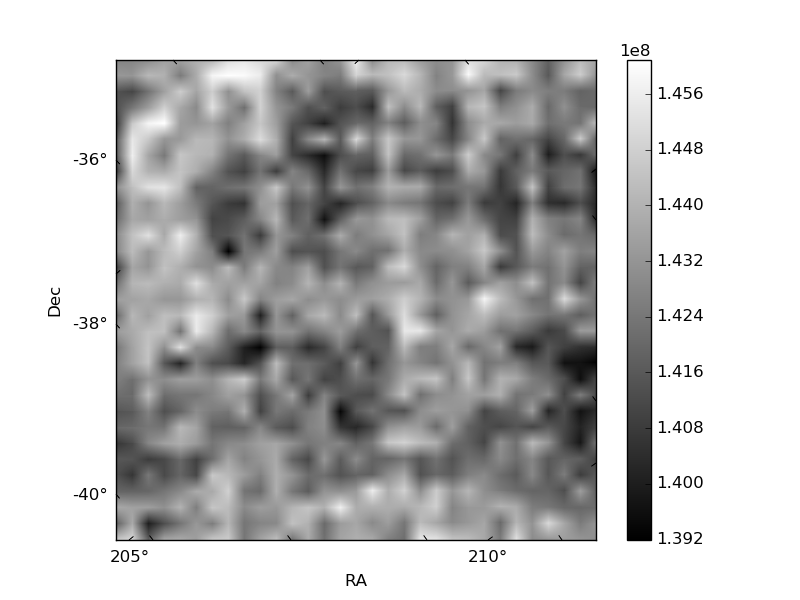
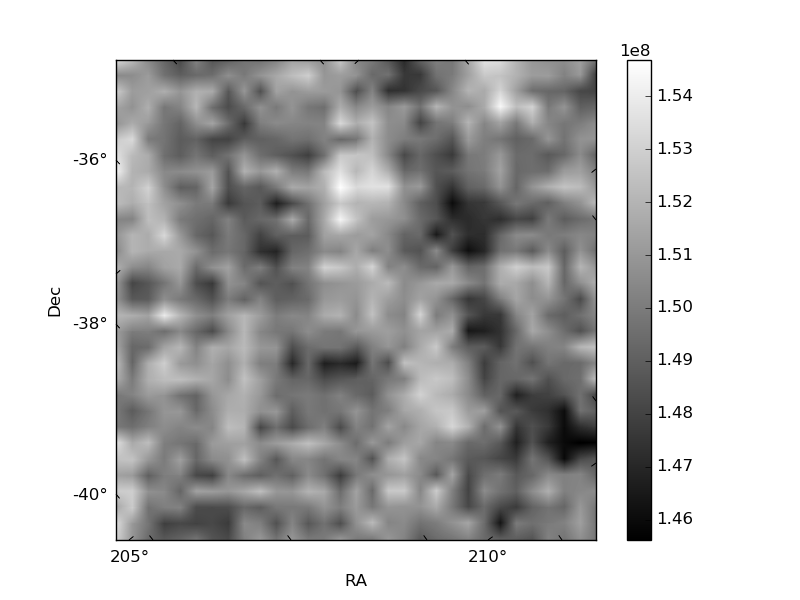
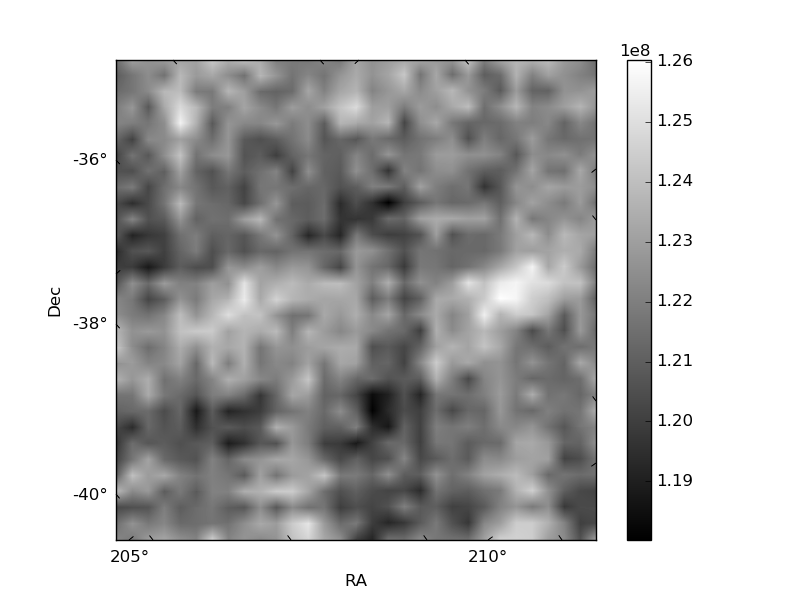
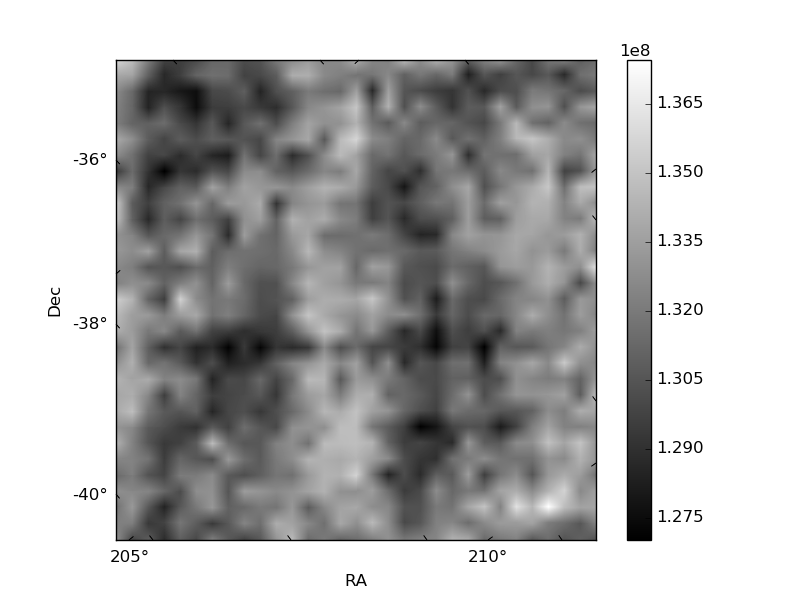
Histogram calculated using DETX and DETY for each event in the final _common_clean file
| Quadrant A | 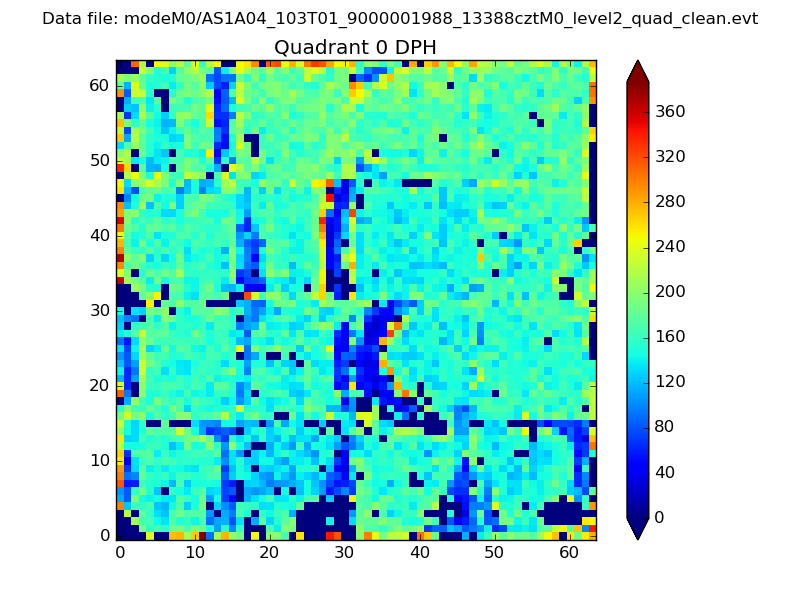 |
 |
Quadrant B |
|---|---|---|---|
| Quadrant D |  |
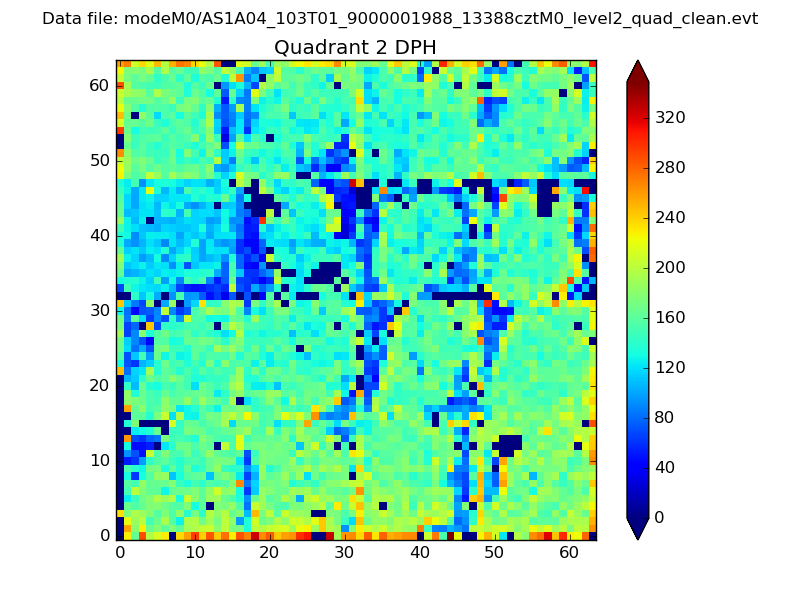 |
Quadrant C |
| Plot type | Count rate plots | Images |
|---|---|---|
| Comparison with Poisson distribution Blue bars denote a histogram of data divided into 1 sec bins. Red curve is a Poisson curve with rate = median count rate of data. |
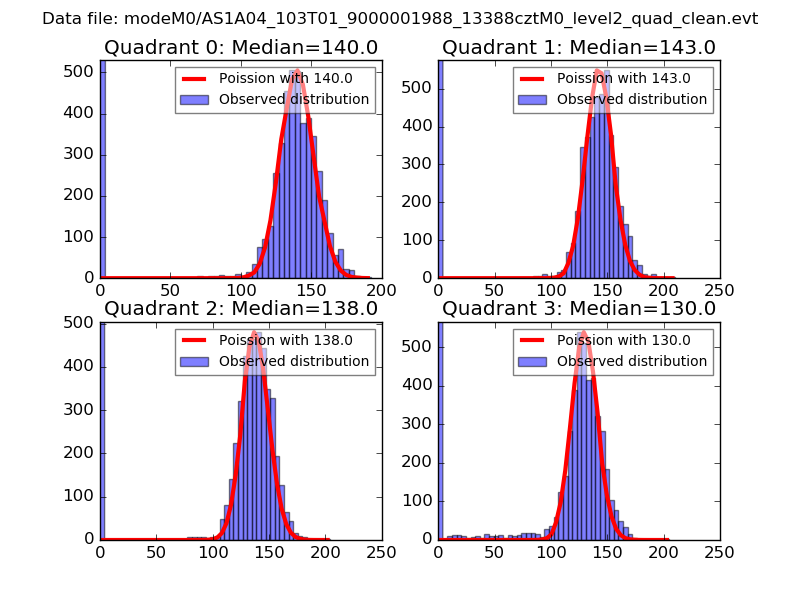 |
 |
| Quadrant-wise count rates Data is divided into 100 sec bins |
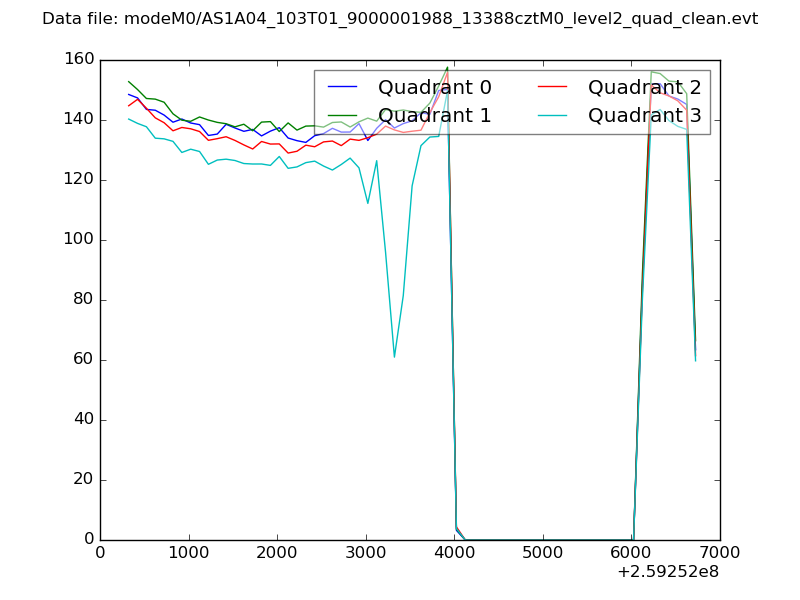 |
|
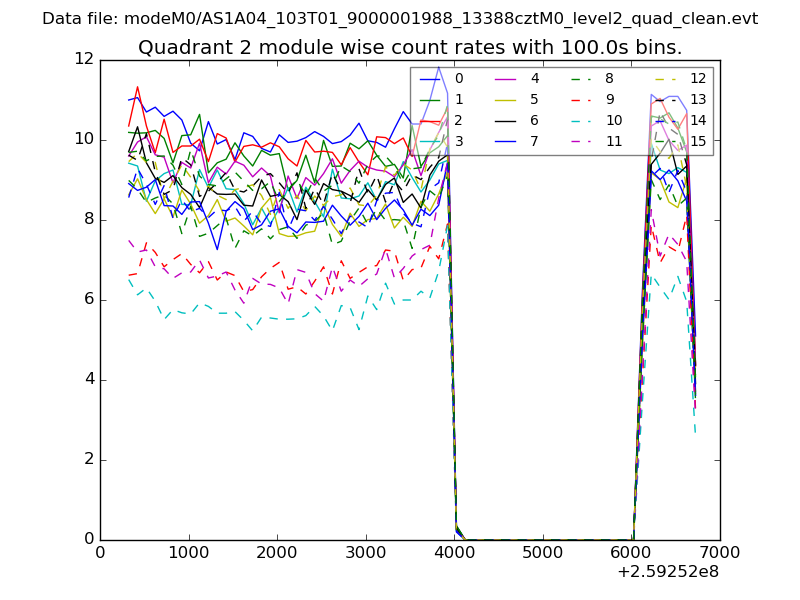
| Module-wise count rates for Quadrant A Data is divided into 100 sec bins |
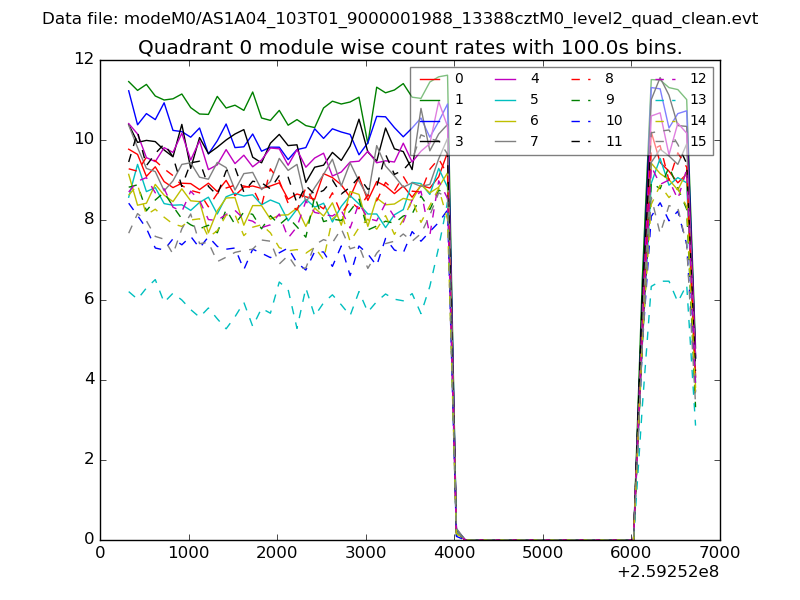 |
 |
| Module-wise count rates for Quadrant B Data is divided into 100 sec bins |
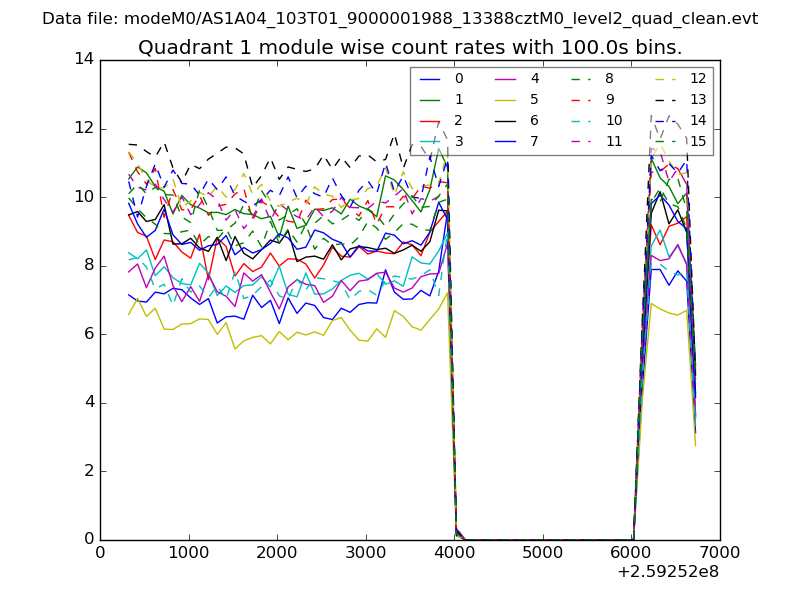 |
 |
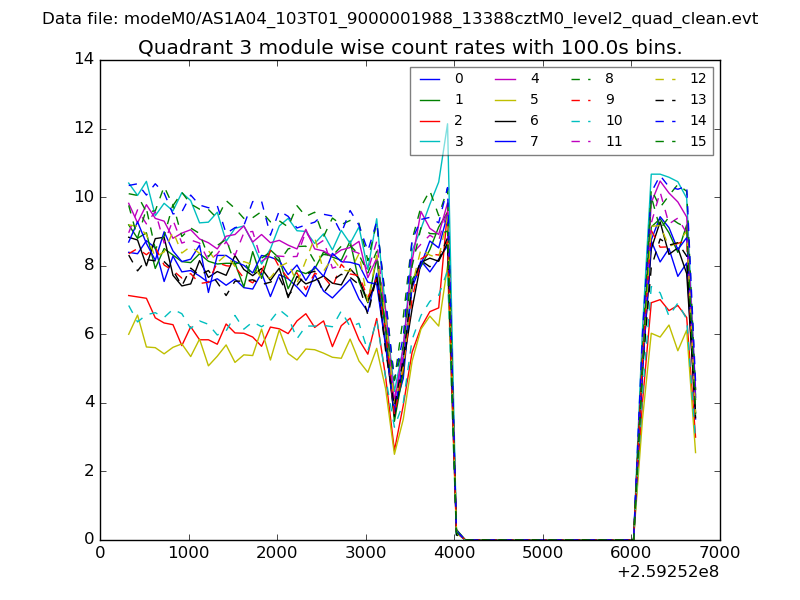
| Module-wise count rates for Quadrant C Data is divided into 100 sec bins |
 |
 |
| Module-wise count rates for Quadrant D Data is divided into 100 sec bins |
 |
 |
| Parameter | Plot |
|---|---|
| CZT HV Monitor |  |
| D_VDD | 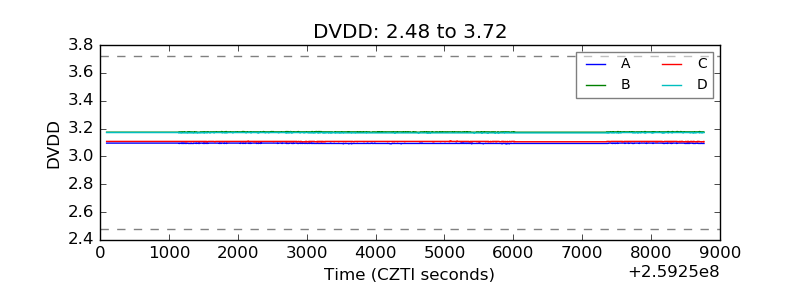 |
| Temperature 1 |  |
| Veto HV Monitor | 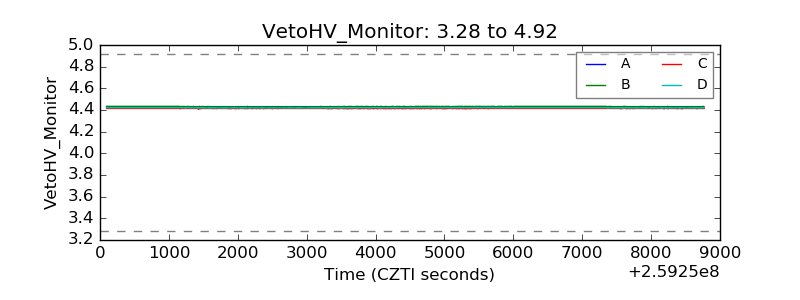 |
| Veto LLD | 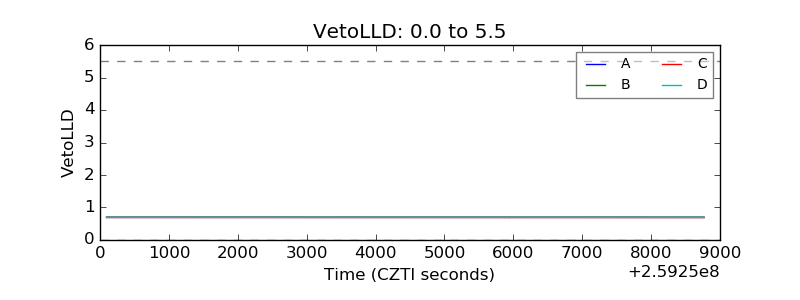 |
| Alpha Counter | 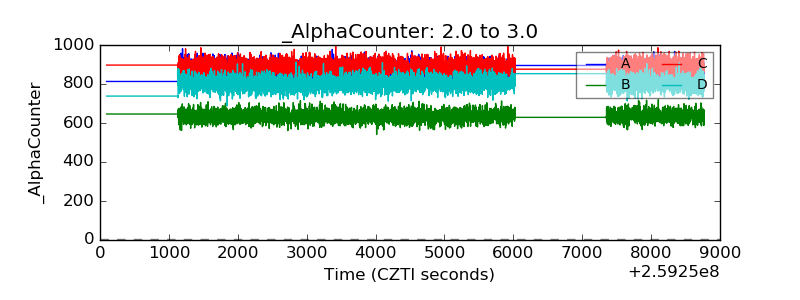 |
| _CPM_Rate | 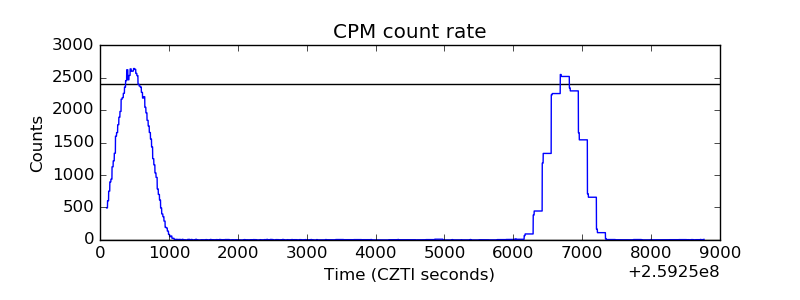 |
| CZT Counter | 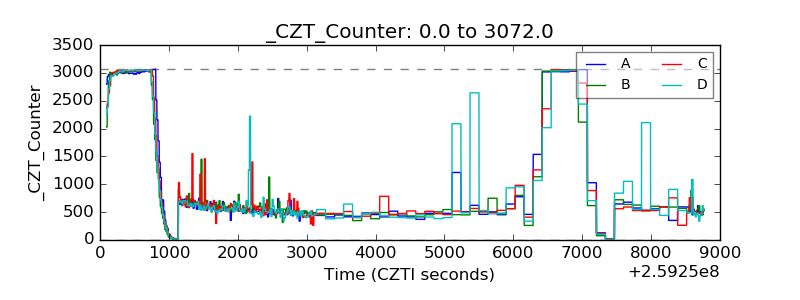 |
| +2.5 Volts monitor |  |
| +5 Volts monitor | 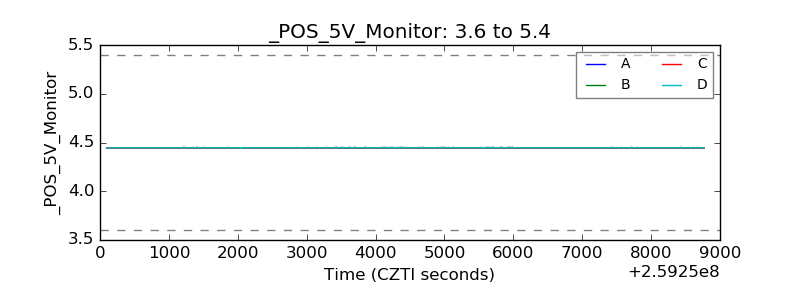 |
| _ROLL_ROT | 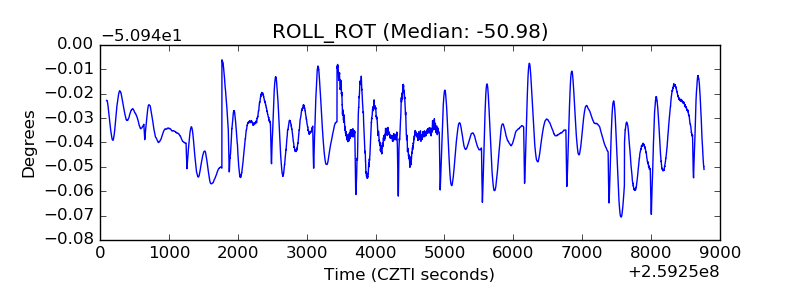 |
| _Roll_DEC | 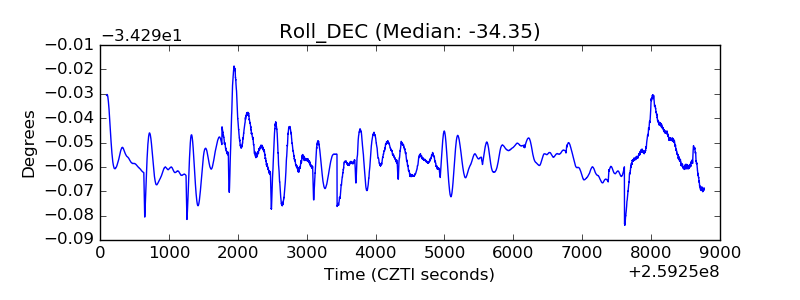 |
| _Roll_RA | 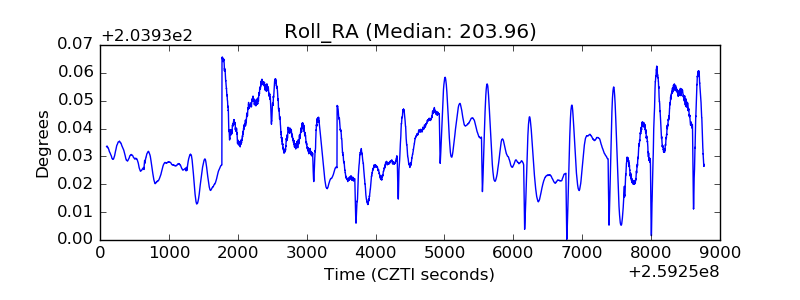 |
| Veto Counter | 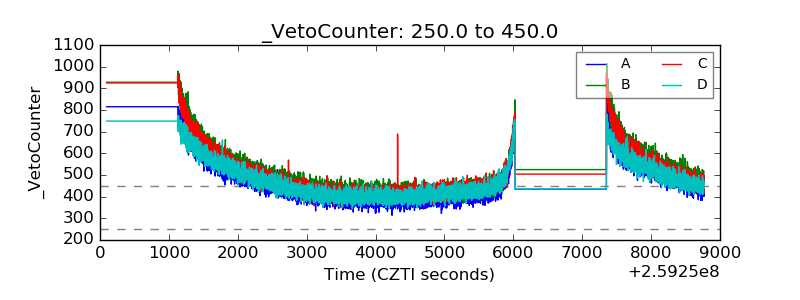 |