| Param | Original file | Final file |
|---|---|---|
| Filename | modeM0/AS1A04_103T01_9000001988_13389cztM0_level2.evt | modeM0/AS1A04_103T01_9000001988_13389cztM0_level2_quad_clean.evt |
| Size (bytes) | 492,336,000 | 99,901,440 |
| Size | 469.5 MB | 95.3 MB |
| Events in quadrant A | 3,262,566 | 659,033 |
| Events in quadrant B | 3,386,120 | 678,956 |
| Events in quadrant C | 3,299,472 | 648,237 |
| Events in quadrant D | 4,534,805 | 599,902 |
| Mode M0 | |||
|---|---|---|---|
| Quadrant | BADHDUFLAG | Total packets | Discarded packets |
| A | 0 | 13752 | 3 |
| B | 0 | 14033 | 2 |
| C | 0 | 13711 | 2 |
| D | 0 | 17698 | 2 |
| Mode SS | |||
|---|---|---|---|
| Quadrant | BADHDUFLAG | Total packets | Discarded packets |
| A | 0 | 128 | 0 |
| B | 0 | 128 | 0 |
| C | 0 | 128 | 0 |
| D | 0 | 128 | 0 |
| Mode M9 | |||
|---|---|---|---|
| Quadrant | BADHDUFLAG | Total packets | Discarded packets |
| A | 0 | 27 | 0 |
| B | 0 | 27 | 0 |
| C | 0 | 27 | 0 |
| D | 0 | 27 | 0 |
| Quadrant | Total seconds | Saturated seconds | Saturation percentage |
|---|---|---|---|
| A | 6304 | 107 | 1.697335% |
| B | 6304 | 121 | 1.919416% |
| C | 6304 | 75 | 1.189721% |
| D | 6304 | 391 | 6.202411% |
Noise dominated data is calculated using 1-second bins in cleaned event files. If a bin has >2000 counts, and if more than 50% of those come from <1% of pixels, then it is considered to be noise-dominated and hence unusable.
| Quadrant | # 1 sec bins | Bins with >0 counts | Bins with >2000 counts | High rate bins dominated by noise | Noise dominated (total time) | Noise dominated (detector-on time) | Marked lightcurve |
|---|---|---|---|---|---|---|---|
| A | 8970 | 6307 | 0 | 0 | 0.00% | 0.00% |  |
| B | 8970 | 6307 | 1 | 1 | 0.01% | 0.02% |  |
| C | 8970 | 6307 | 2 | 2 | 0.02% | 0.03% |  |
| D | 8970 | 6307 | 329 | 329 | 3.67% | 5.22% |  |
Top three noisy pixels from each quadrant. If the there are fewer than three noisy pixels in the level2.evt file, extra rows are filled as -1
| Pixel properties | Quadrant properties | ||||||
|---|---|---|---|---|---|---|---|
| Quadrant | DetID | PixID | Counts | Sigma | Mean | Median | Sigma |
| A | 9 | 143 | 31012 | 181.2 | 832 | 816 | 166.6 |
| A | 1 | 162 | 11683 | 65.21 | 832 | 816 | 166.6 |
| A | 8 | 15 | 10607 | 58.75 | 832 | 816 | 166.6 |
| B | 3 | 209 | 25302 | 157.02 | 837 | 817 | 155.9 |
| B | 10 | 245 | 24091 | 149.26 | 837 | 817 | 155.9 |
| B | 3 | 64 | 19598 | 120.44 | 837 | 817 | 155.9 |
| C | 14 | 220 | 95798 | 516.54 | 801 | 807 | 183.9 |
| C | 3 | 233 | 78314 | 421.46 | 801 | 807 | 183.9 |
| C | 13 | 61 | 5818 | 27.25 | 801 | 807 | 183.9 |
| D | 1 | 52 | 1519452 | 8189.26 | 776 | 755 | 185.4 |
| D | 2 | 234 | 21534 | 112.04 | 776 | 755 | 185.4 |
| D | 13 | 172 | 18679 | 96.65 | 776 | 755 | 185.4 |
Histogram calculated using DETX and DETY for each event in the final _common_clean file
| Quadrant A |  |
 |
Quadrant B |
|---|---|---|---|
| Quadrant D |  |
 |
Quadrant C |
| Plot type | Count rate plots | Images |
|---|---|---|
| Comparison with Poisson distribution Blue bars denote a histogram of data divided into 1 sec bins. Red curve is a Poisson curve with rate = median count rate of data. |
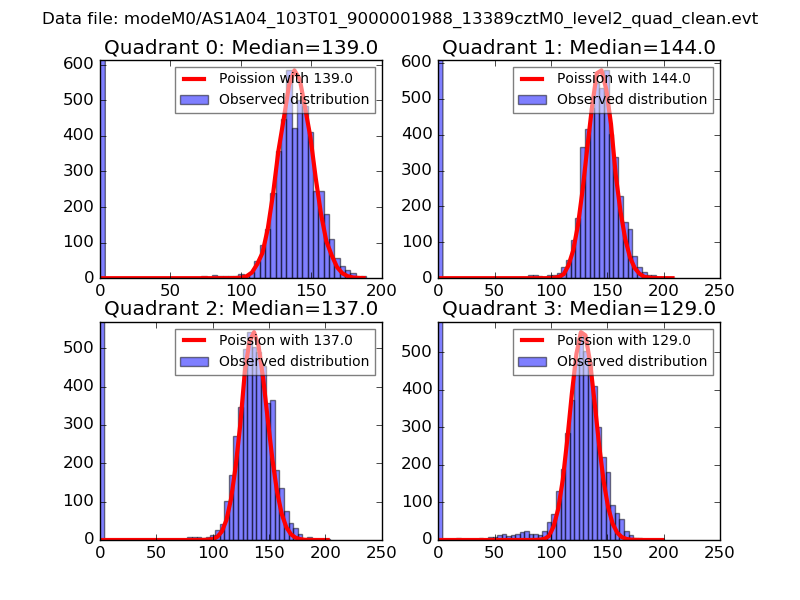 |
 |
| Quadrant-wise count rates Data is divided into 100 sec bins |
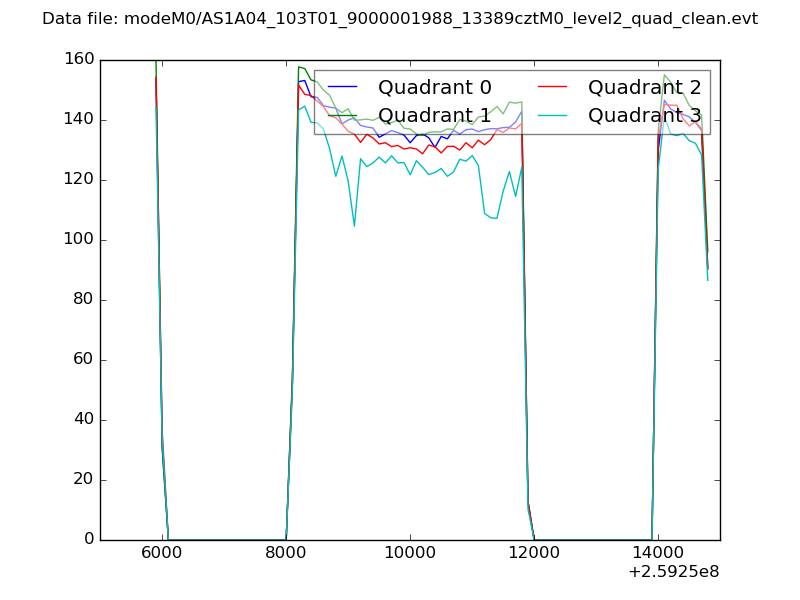 |
|
| Module-wise count rates for Quadrant A Data is divided into 100 sec bins |
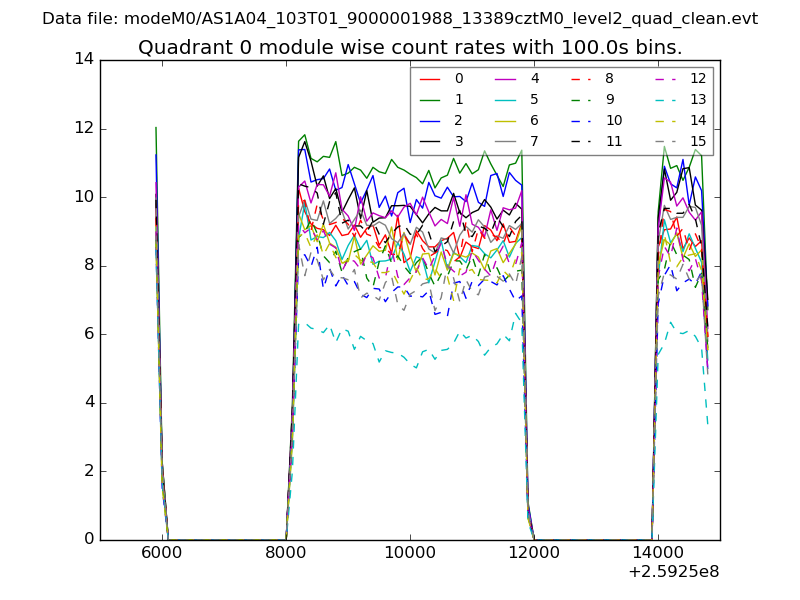 |
 |
| Module-wise count rates for Quadrant B Data is divided into 100 sec bins |
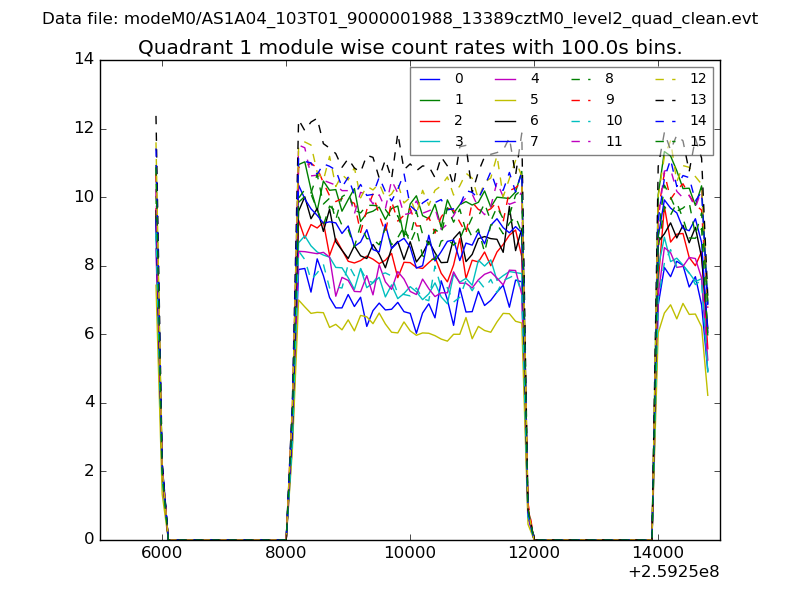 |
 |
| Module-wise count rates for Quadrant C Data is divided into 100 sec bins |
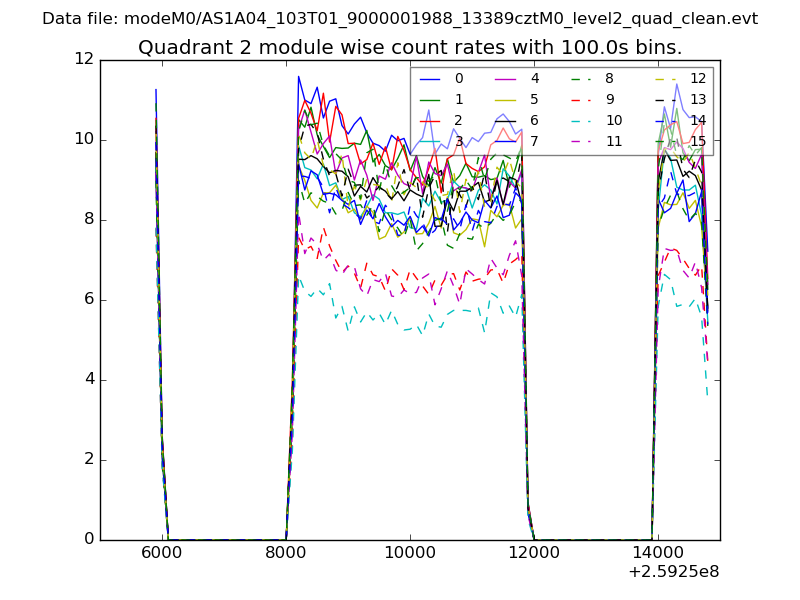 |
 |
| Module-wise count rates for Quadrant D Data is divided into 100 sec bins |
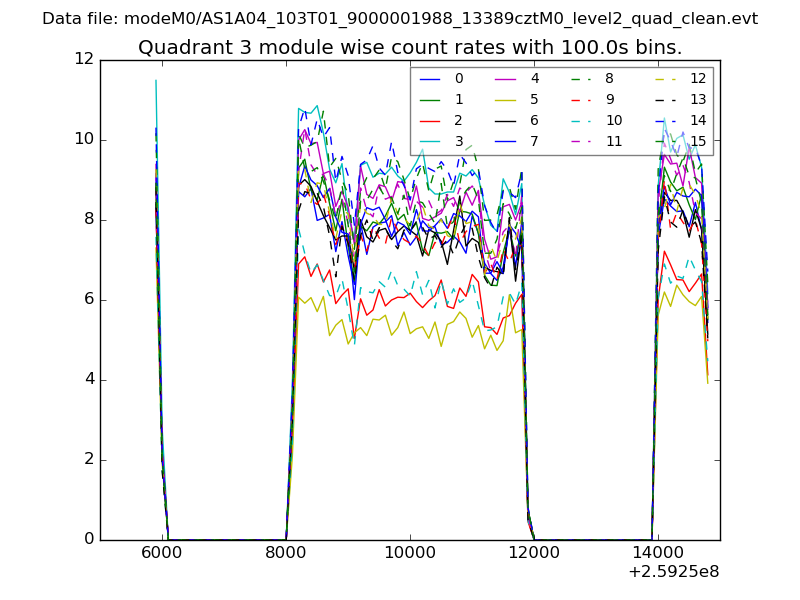 |
 |
| Parameter | Plot |
|---|---|
| CZT HV Monitor | 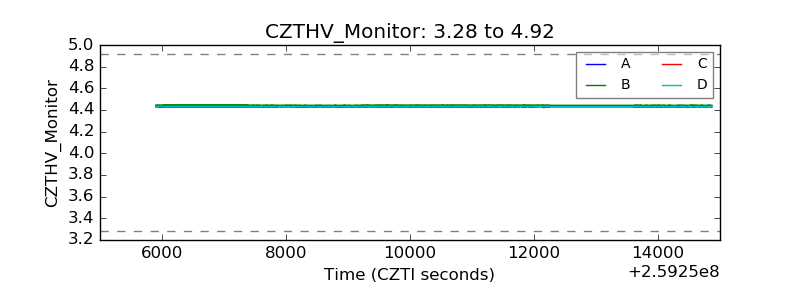 |
| D_VDD |  |
| Temperature 1 |  |
| Veto HV Monitor |  |
| Veto LLD |  |
| Alpha Counter | 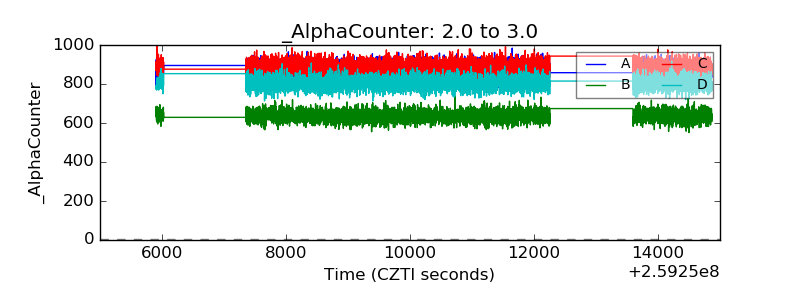 |
| _CPM_Rate | 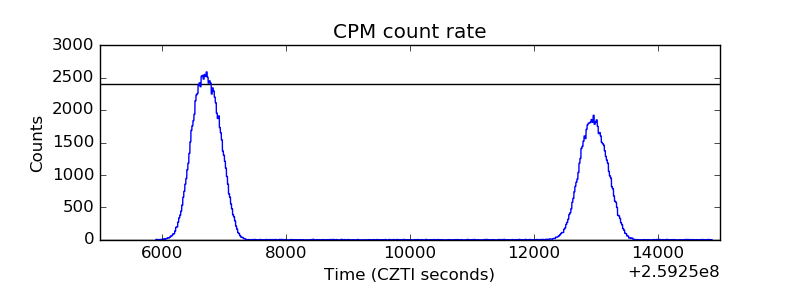 |
| CZT Counter |  |
| +2.5 Volts monitor |  |
| +5 Volts monitor |  |
| _ROLL_ROT | 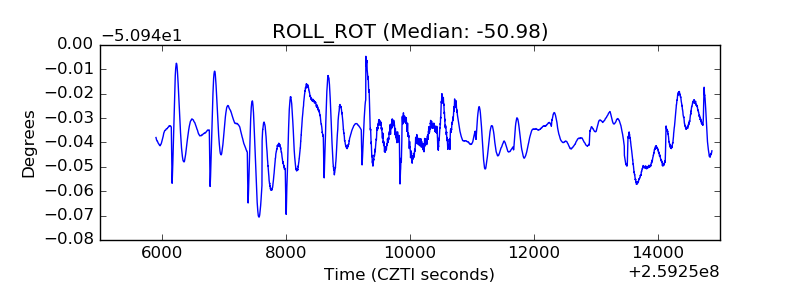 |
| _Roll_DEC | 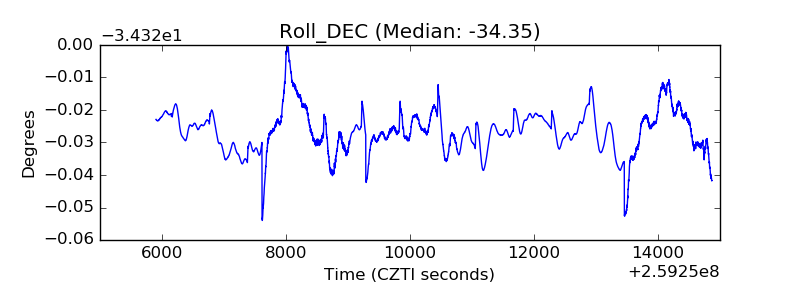 |
| _Roll_RA |  |
| Veto Counter | 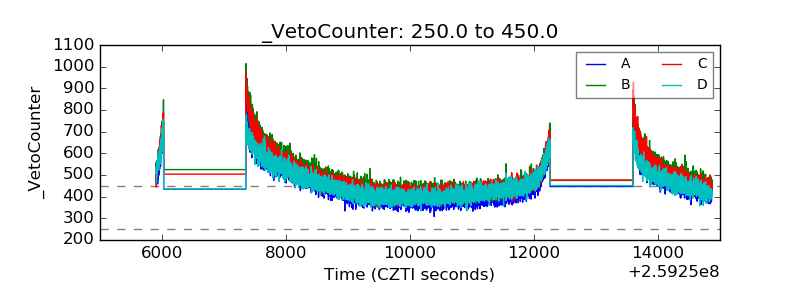 |