| Param | Original file | Final file |
|---|---|---|
| Filename | modeM0/AS1A04_103T01_9000001988_13390cztM0_level2.evt | modeM0/AS1A04_103T01_9000001988_13390cztM0_level2_quad_clean.evt |
| Size (bytes) | 488,540,160 | 105,713,280 |
| Size | 465.9 MB | 100.8 MB |
| Events in quadrant A | 3,348,691 | 690,922 |
| Events in quadrant B | 3,559,268 | 714,143 |
| Events in quadrant C | 3,685,751 | 679,644 |
| Events in quadrant D | 3,740,009 | 643,043 |
| Mode M0 | |||
|---|---|---|---|
| Quadrant | BADHDUFLAG | Total packets | Discarded packets |
| A | 0 | 14421 | 3 |
| B | 0 | 14936 | 2 |
| C | 0 | 15373 | 2 |
| D | 0 | 15855 | 2 |
| Mode SS | |||
|---|---|---|---|
| Quadrant | BADHDUFLAG | Total packets | Discarded packets |
| A | 0 | 140 | 0 |
| B | 0 | 140 | 0 |
| C | 0 | 140 | 0 |
| D | 0 | 140 | 0 |
| Mode M9 | |||
|---|---|---|---|
| Quadrant | BADHDUFLAG | Total packets | Discarded packets |
| A | 0 | 26 | 0 |
| B | 0 | 26 | 0 |
| C | 0 | 26 | 0 |
| D | 0 | 26 | 0 |
| Quadrant | Total seconds | Saturated seconds | Saturation percentage |
|---|---|---|---|
| A | 6801 | 73 | 1.073372% |
| B | 6801 | 123 | 1.808558% |
| C | 6801 | 62 | 0.911631% |
| D | 6801 | 91 | 1.338039% |
Noise dominated data is calculated using 1-second bins in cleaned event files. If a bin has >2000 counts, and if more than 50% of those come from <1% of pixels, then it is considered to be noise-dominated and hence unusable.
| Quadrant | # 1 sec bins | Bins with >0 counts | Bins with >2000 counts | High rate bins dominated by noise | Noise dominated (total time) | Noise dominated (detector-on time) | Marked lightcurve |
|---|---|---|---|---|---|---|---|
| A | 9387 | 6804 | 0 | 0 | 0.00% | 0.00% | 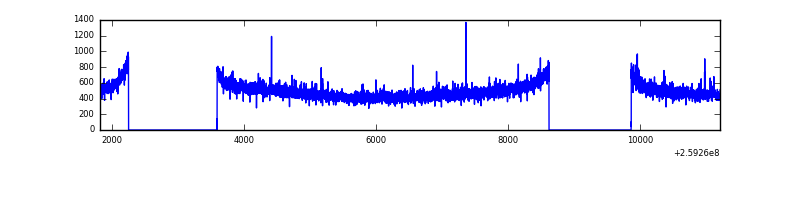 |
| B | 9387 | 6804 | 17 | 17 | 0.18% | 0.25% | 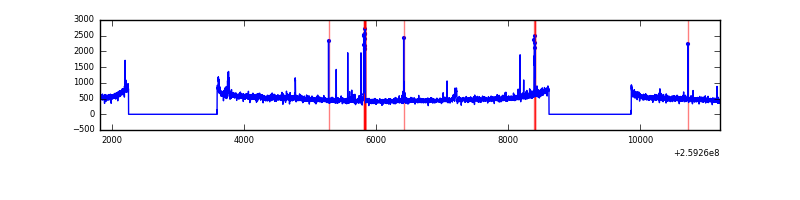 |
| C | 9387 | 6804 | 19 | 19 | 0.20% | 0.28% | 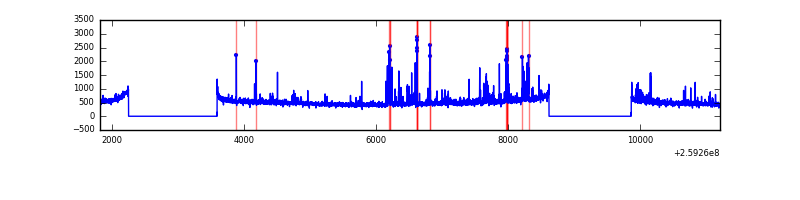 |
| D | 9387 | 6804 | 36 | 36 | 0.38% | 0.53% | 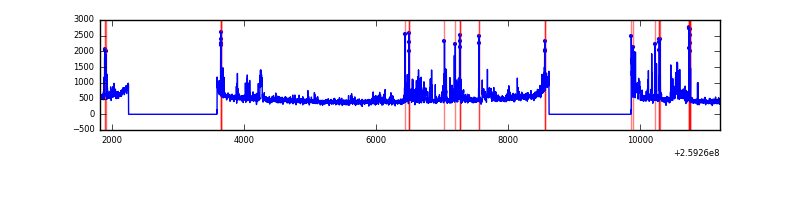 |
Top three noisy pixels from each quadrant. If the there are fewer than three noisy pixels in the level2.evt file, extra rows are filled as -1
| Pixel properties | Quadrant properties | ||||||
|---|---|---|---|---|---|---|---|
| Quadrant | DetID | PixID | Counts | Sigma | Mean | Median | Sigma |
| A | 1 | 162 | 18537 | 102.2 | 859 | 839 | 173.2 |
| A | 0 | 226 | 7674 | 39.47 | 859 | 839 | 173.2 |
| A | 1 | 178 | 7057 | 35.91 | 859 | 839 | 173.2 |
| B | 3 | 64 | 88557 | 535.96 | 866 | 845 | 163.7 |
| B | 4 | 80 | 26659 | 157.74 | 866 | 845 | 163.7 |
| B | 10 | 245 | 26600 | 157.37 | 866 | 845 | 163.7 |
| C | 14 | 220 | 334029 | 1740.45 | 833 | 838 | 191.4 |
| C | 3 | 233 | 101397 | 525.28 | 833 | 838 | 191.4 |
| C | 13 | 61 | 6104 | 27.51 | 833 | 838 | 191.4 |
| D | 1 | 52 | 578804 | 2973.92 | 818 | 796 | 194.4 |
| D | 2 | 136 | 25887 | 129.1 | 818 | 796 | 194.4 |
| D | 2 | 234 | 24613 | 122.54 | 818 | 796 | 194.4 |
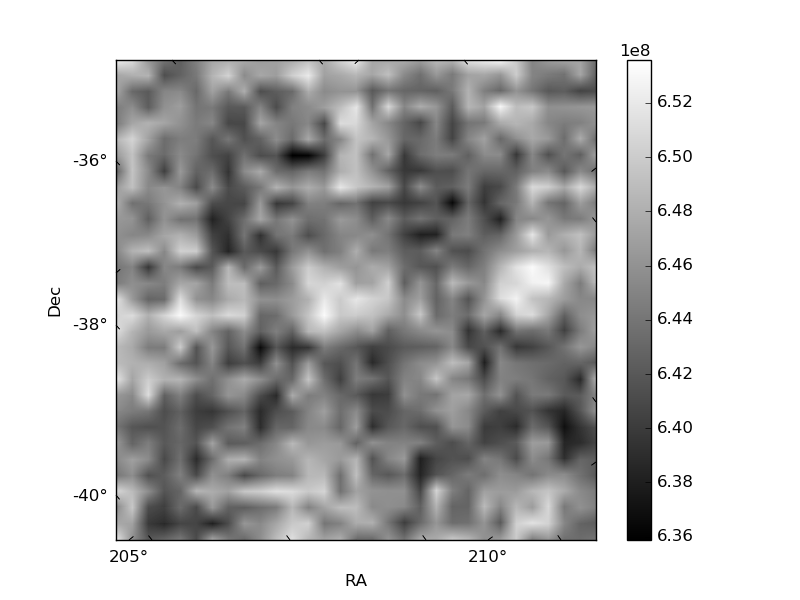
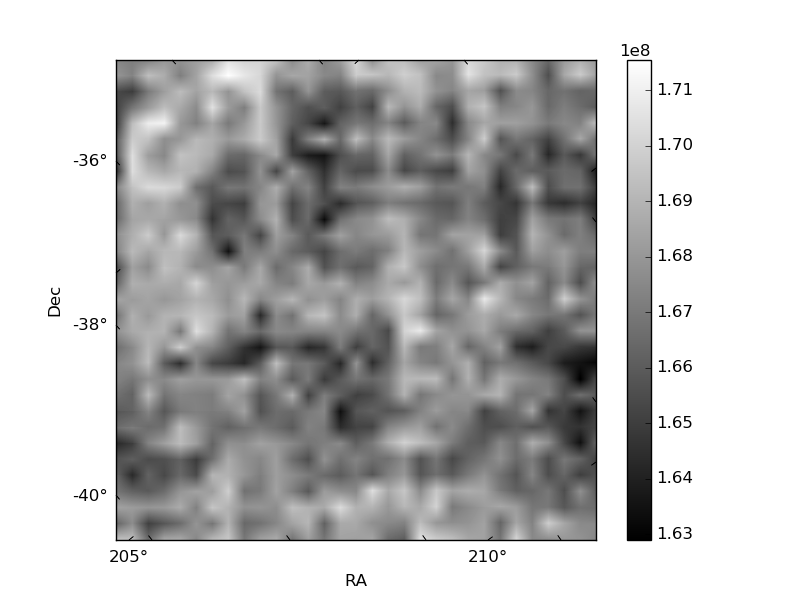
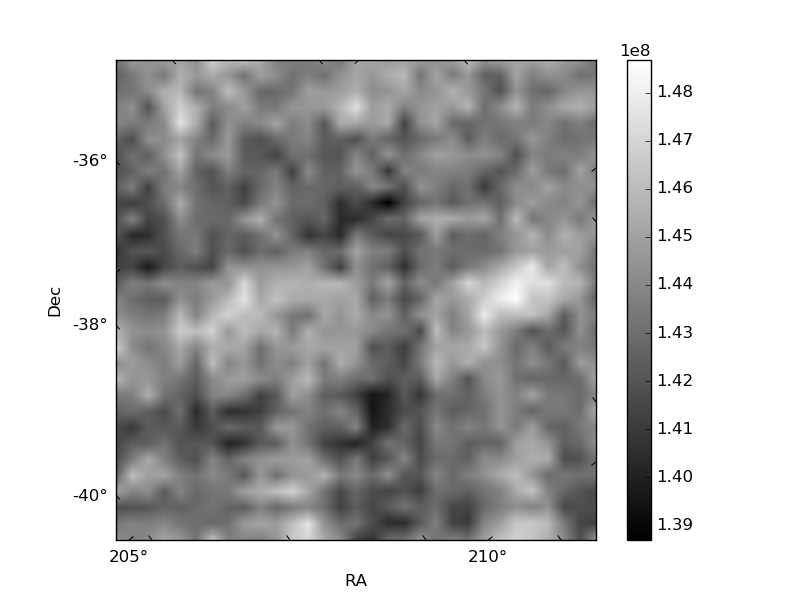
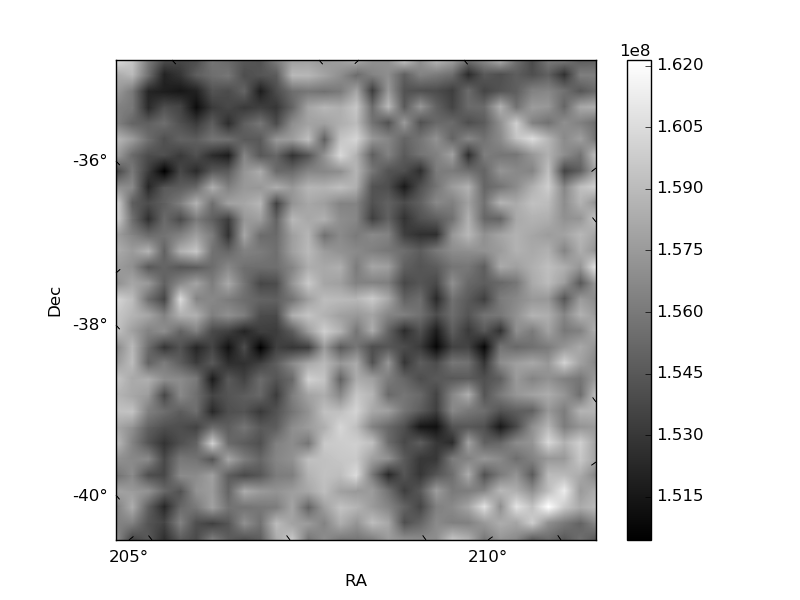
Histogram calculated using DETX and DETY for each event in the final _common_clean file
| Quadrant A | 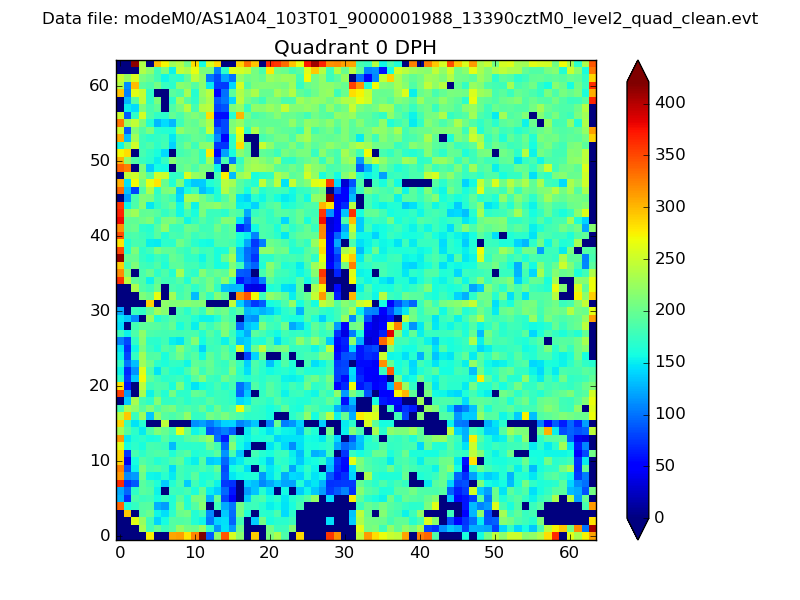 |
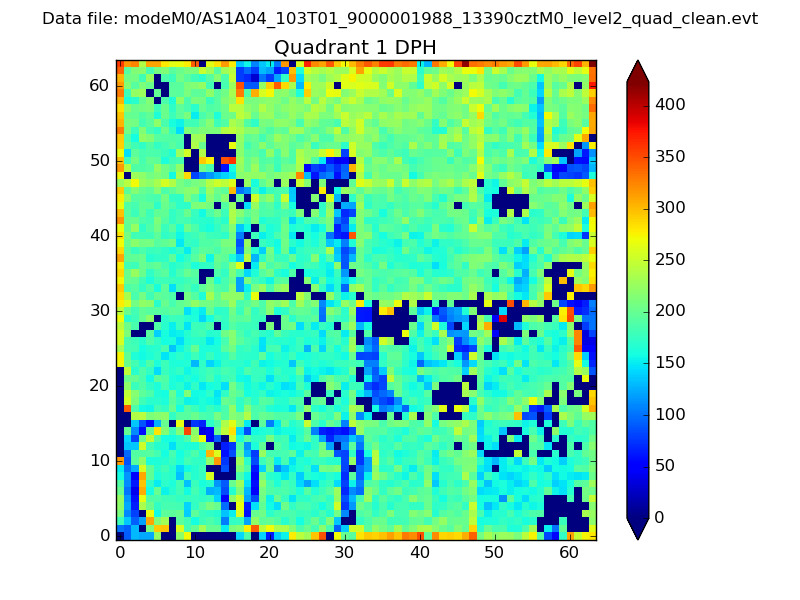 |
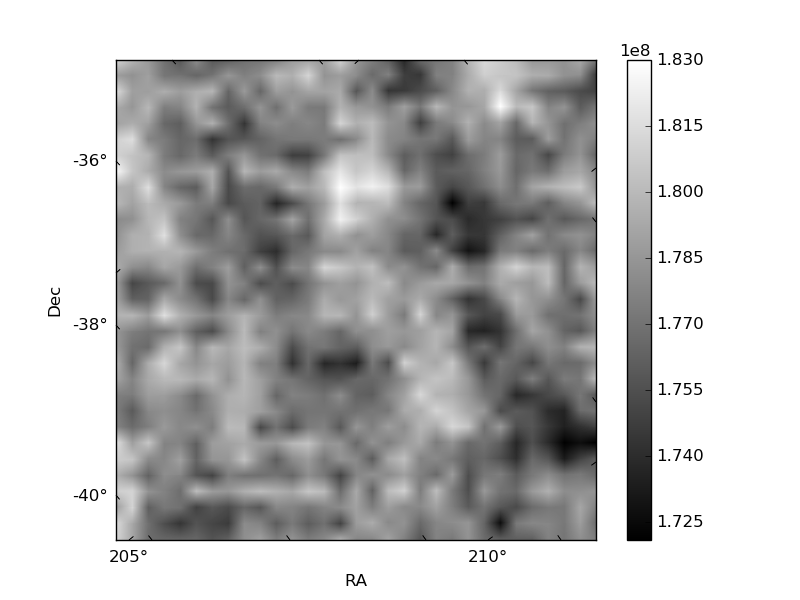
Quadrant B |
|---|---|---|---|
| Quadrant D | 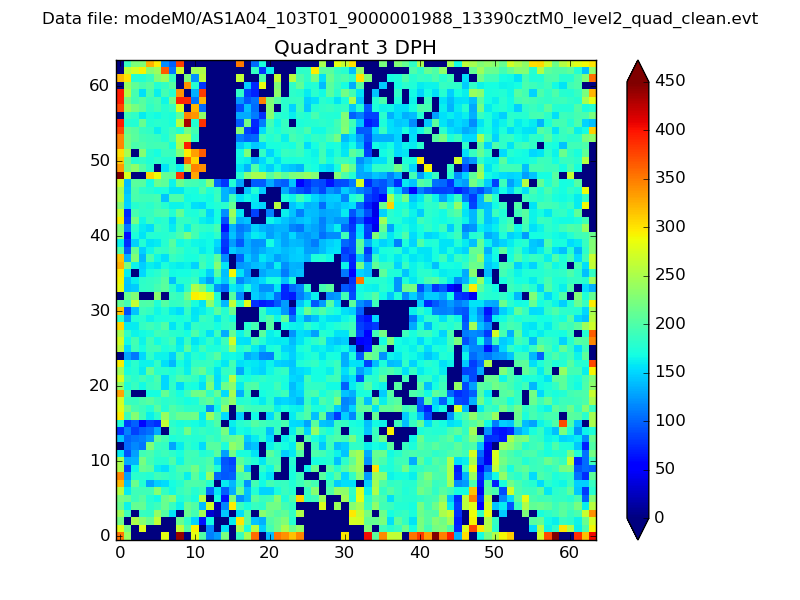 |
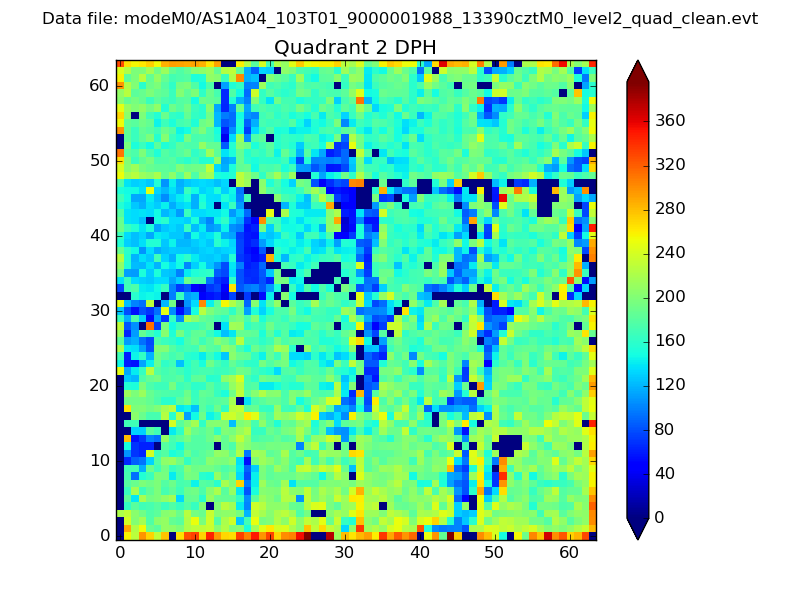 |
Quadrant C |
| Plot type | Count rate plots | Images |
|---|---|---|
| Comparison with Poisson distribution Blue bars denote a histogram of data divided into 1 sec bins. Red curve is a Poisson curve with rate = median count rate of data. |
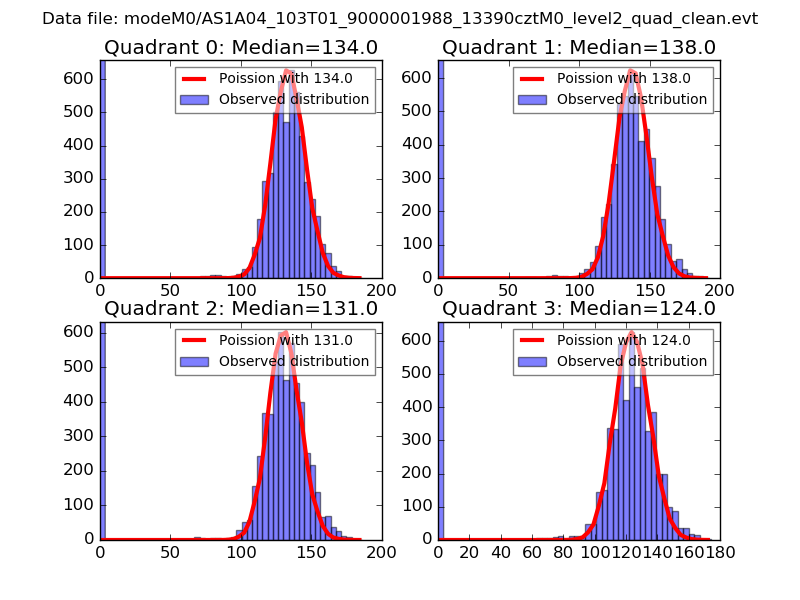 |
 |
| Quadrant-wise count rates Data is divided into 100 sec bins |
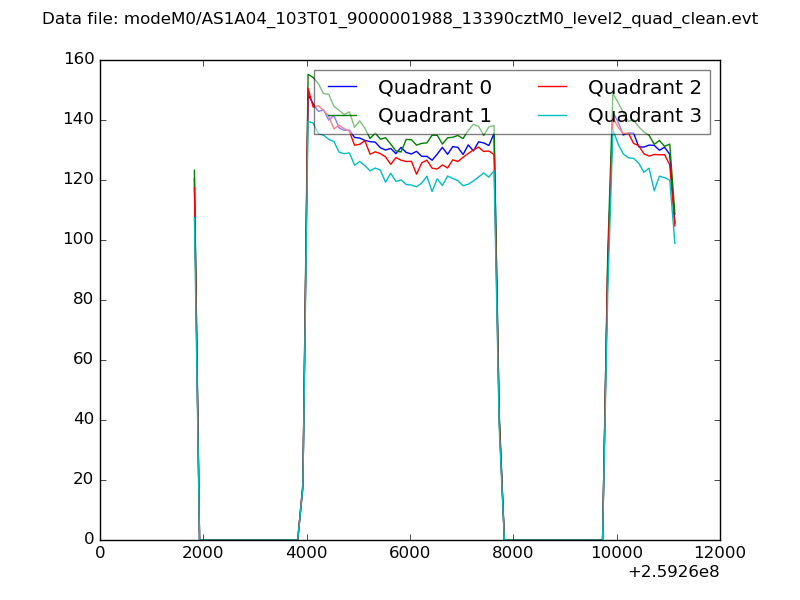 |
|
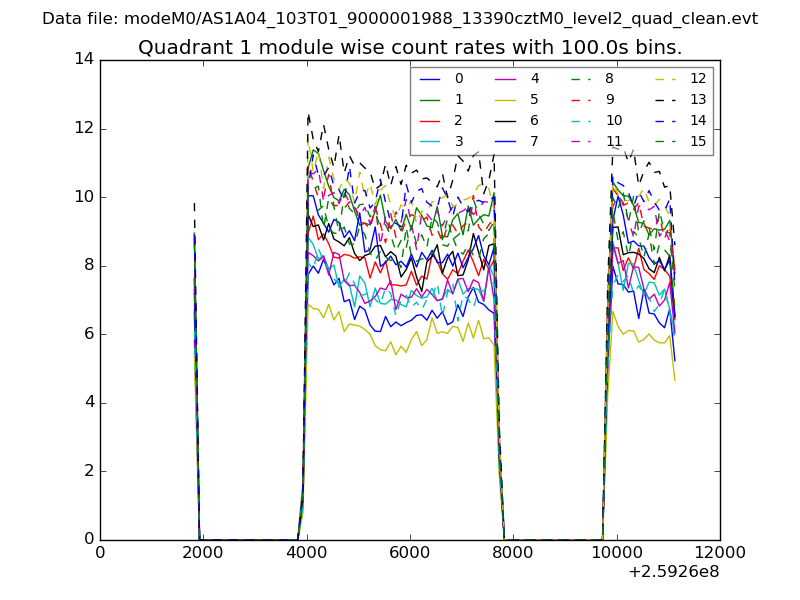
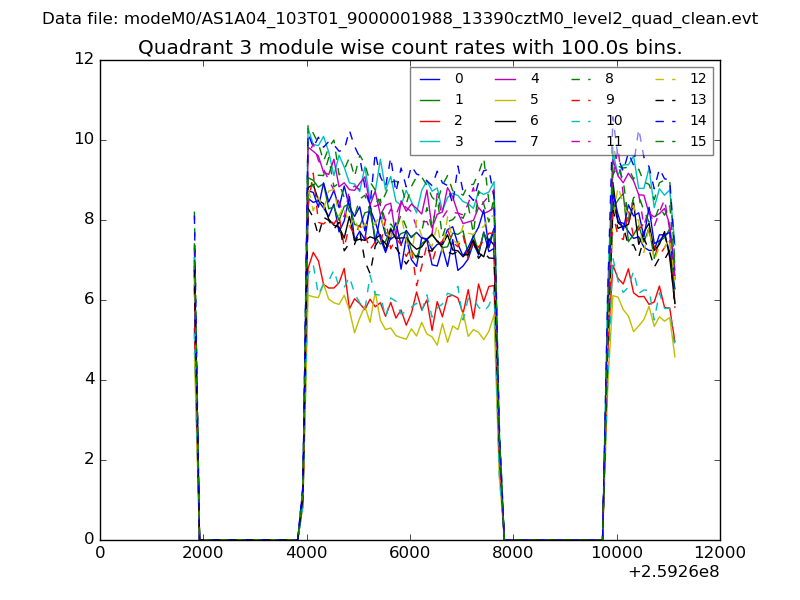
| Module-wise count rates for Quadrant A Data is divided into 100 sec bins |
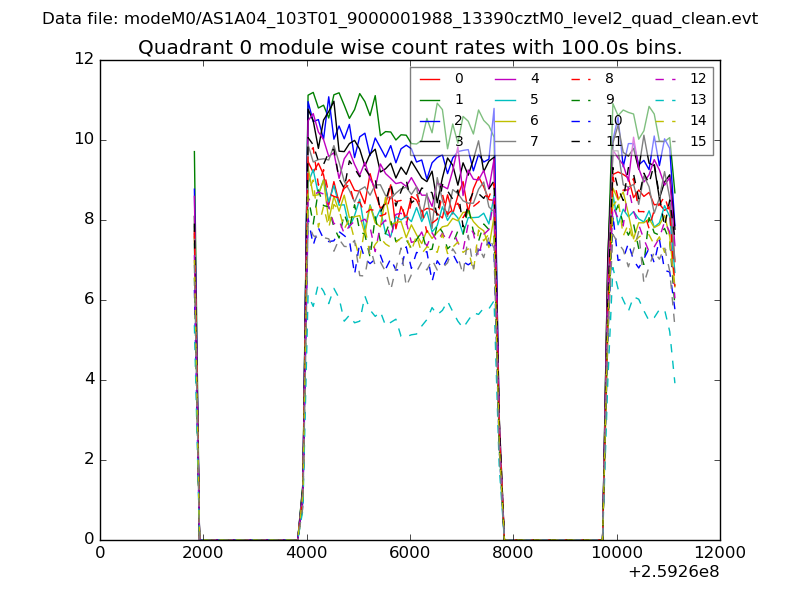 |
 |
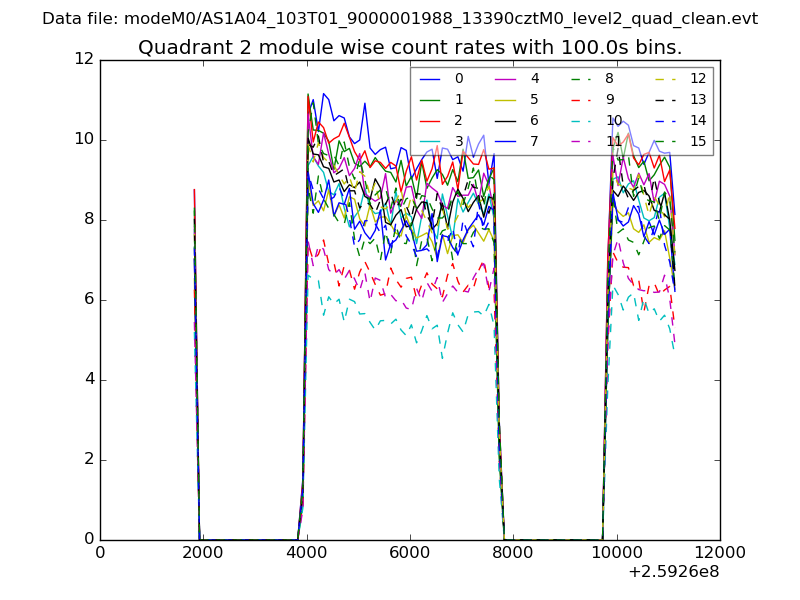
| Module-wise count rates for Quadrant B Data is divided into 100 sec bins |
 |
 |
| Module-wise count rates for Quadrant C Data is divided into 100 sec bins |
 |
 |
| Module-wise count rates for Quadrant D Data is divided into 100 sec bins |
 |
 |
| Parameter | Plot |
|---|---|
| CZT HV Monitor | 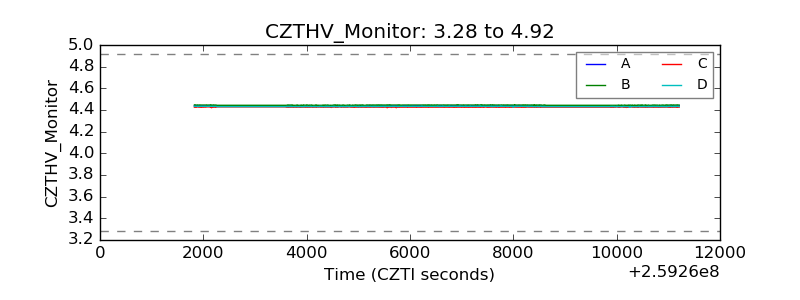 |
| D_VDD | 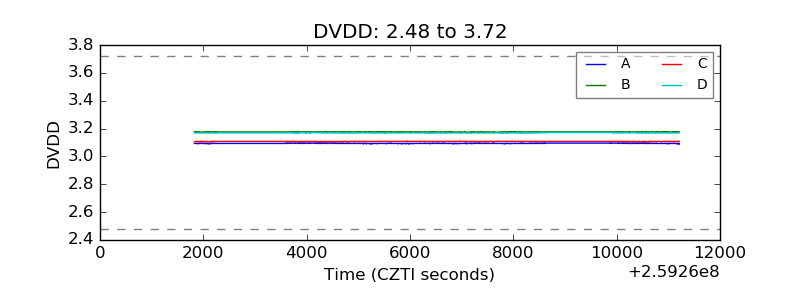 |
| Temperature 1 | 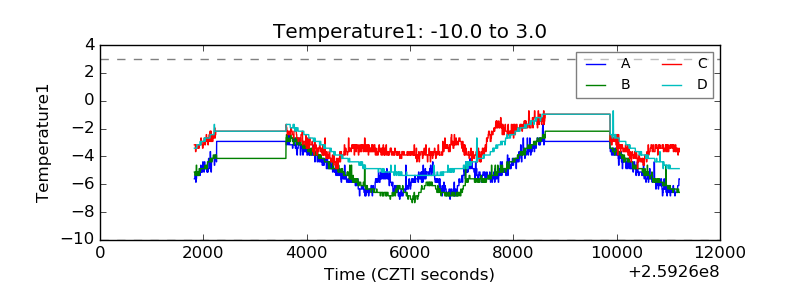 |
| Veto HV Monitor | 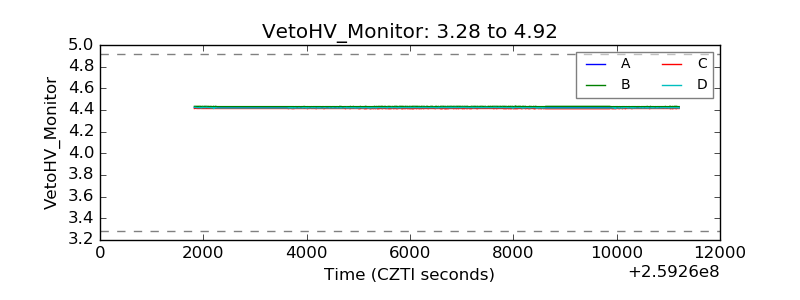 |
| Veto LLD | 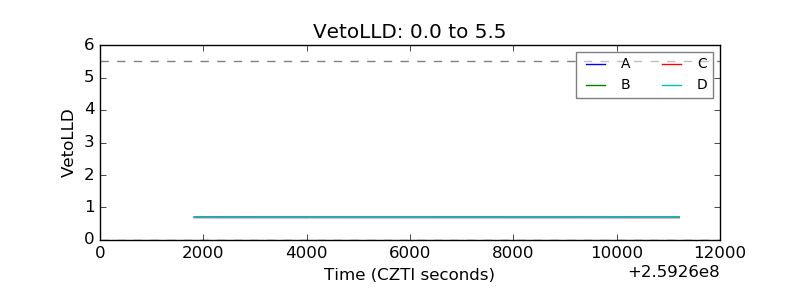 |
| Alpha Counter | 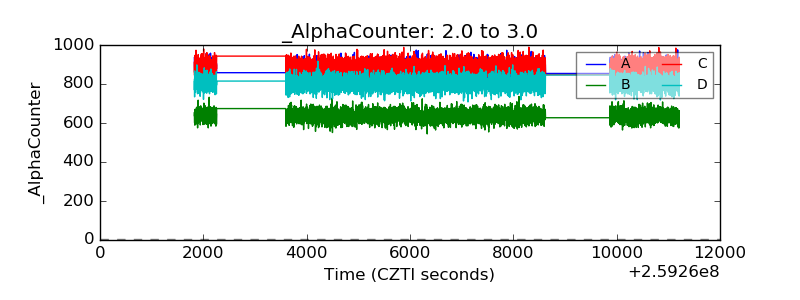 |
| _CPM_Rate | 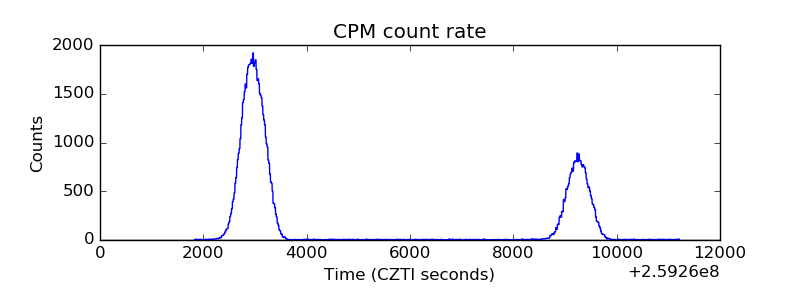 |
| CZT Counter |  |
| +2.5 Volts monitor |  |
| +5 Volts monitor |  |
| _ROLL_ROT | 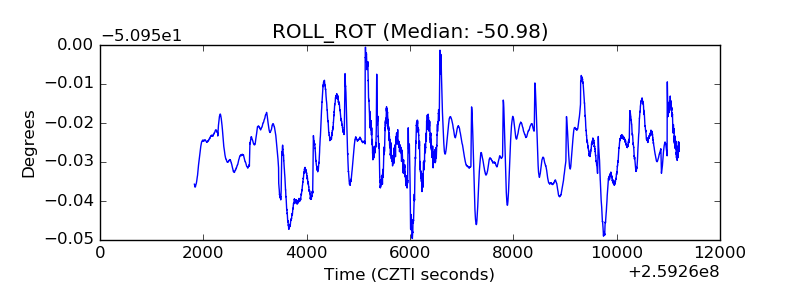 |
| _Roll_DEC | 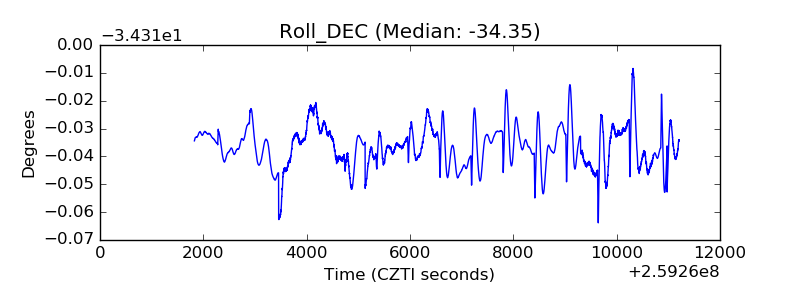 |
| _Roll_RA | 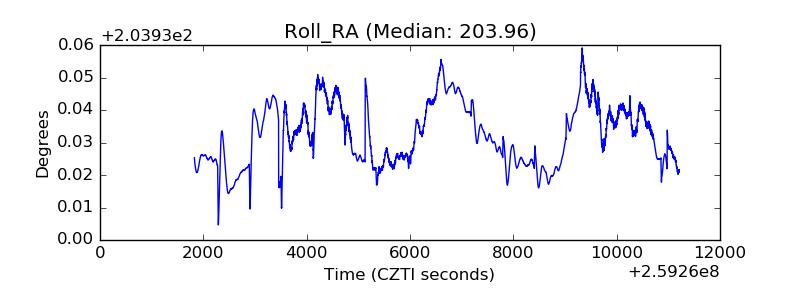 |
| Veto Counter | 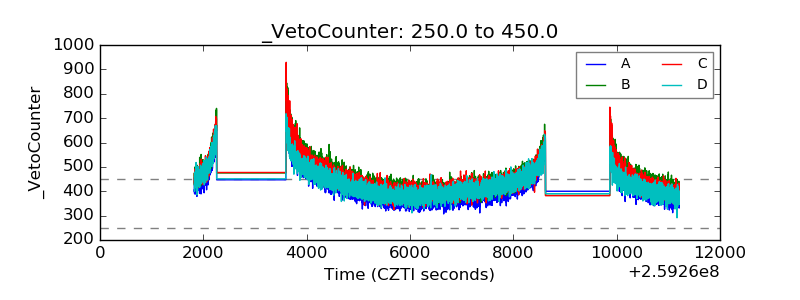 |