| Param | Original file | Final file |
|---|---|---|
| Filename | modeM0/AS1A04_103T01_9000001988_13391cztM0_level2.evt | modeM0/AS1A04_103T01_9000001988_13391cztM0_level2_quad_clean.evt |
| Size (bytes) | 534,695,040 | 107,740,800 |
| Size | 509.9 MB | 102.7 MB |
| Events in quadrant A | 3,752,588 | 689,468 |
| Events in quadrant B | 3,993,929 | 707,249 |
| Events in quadrant C | 3,937,457 | 680,591 |
| Events in quadrant D | 3,980,163 | 643,551 |
| Mode M0 | |||
|---|---|---|---|
| Quadrant | BADHDUFLAG | Total packets | Discarded packets |
| A | 0 | 16330 | 3 |
| B | 0 | 16985 | 2 |
| C | 0 | 16879 | 2 |
| D | 0 | 17423 | 2 |
| Mode SS | |||
|---|---|---|---|
| Quadrant | BADHDUFLAG | Total packets | Discarded packets |
| A | 0 | 160 | 0 |
| B | 0 | 160 | 0 |
| C | 0 | 160 | 0 |
| D | 0 | 160 | 0 |
| Mode M9 | |||
|---|---|---|---|
| Quadrant | BADHDUFLAG | Total packets | Discarded packets |
| A | 0 | 21 | 0 |
| B | 0 | 21 | 0 |
| C | 0 | 21 | 0 |
| D | 0 | 21 | 0 |
| Quadrant | Total seconds | Saturated seconds | Saturation percentage |
|---|---|---|---|
| A | 7795 | 60 | 0.769724% |
| B | 7795 | 131 | 1.680564% |
| C | 7795 | 40 | 0.513149% |
| D | 7795 | 82 | 1.051956% |
Noise dominated data is calculated using 1-second bins in cleaned event files. If a bin has >2000 counts, and if more than 50% of those come from <1% of pixels, then it is considered to be noise-dominated and hence unusable.
| Quadrant | # 1 sec bins | Bins with >0 counts | Bins with >2000 counts | High rate bins dominated by noise | Noise dominated (total time) | Noise dominated (detector-on time) | Marked lightcurve |
|---|---|---|---|---|---|---|---|
| A | 9931 | 7798 | 1 | 1 | 0.01% | 0.01% | 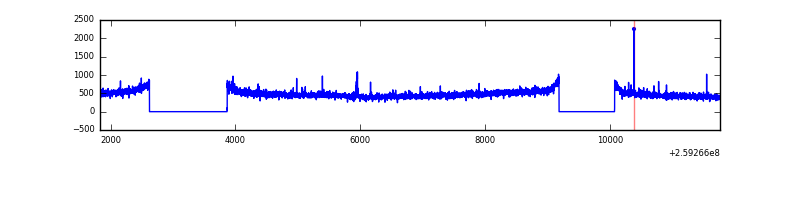 |
| B | 9931 | 7798 | 22 | 22 | 0.22% | 0.28% | 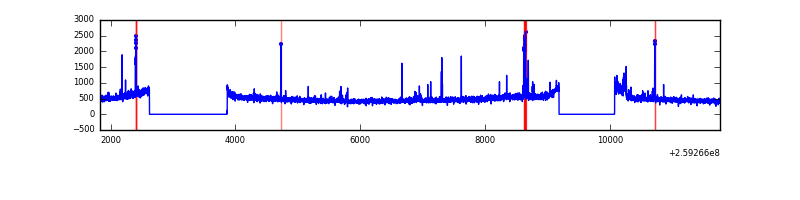 |
| C | 9931 | 7798 | 8 | 8 | 0.08% | 0.10% | 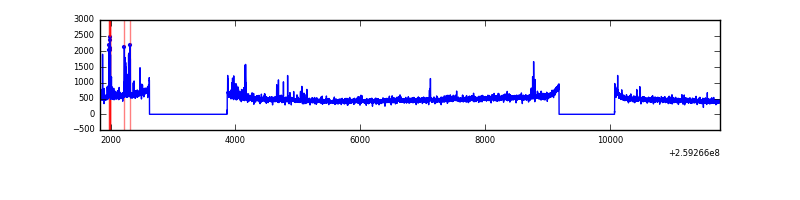 |
| D | 9931 | 7798 | 35 | 35 | 0.35% | 0.45% | 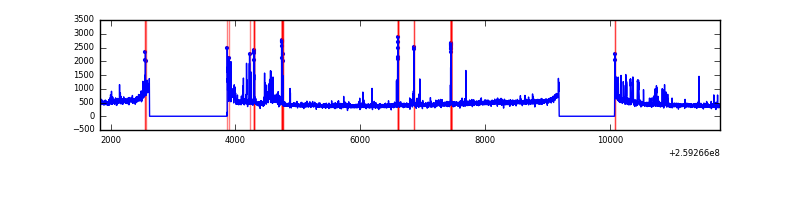 |
Top three noisy pixels from each quadrant. If the there are fewer than three noisy pixels in the level2.evt file, extra rows are filled as -1
| Pixel properties | Quadrant properties | ||||||
|---|---|---|---|---|---|---|---|
| Quadrant | DetID | PixID | Counts | Sigma | Mean | Median | Sigma |
| A | 15 | 222 | 30010 | 149.68 | 955 | 933 | 194.3 |
| A | 1 | 162 | 20385 | 100.13 | 955 | 933 | 194.3 |
| A | 15 | 69 | 16252 | 78.86 | 955 | 933 | 194.3 |
| B | 10 | 244 | 75558 | 408.88 | 962 | 938 | 182.5 |
| B | 10 | 245 | 58653 | 316.25 | 962 | 938 | 182.5 |
| B | 3 | 64 | 51694 | 278.12 | 962 | 938 | 182.5 |
| C | 14 | 220 | 182195 | 844.34 | 928 | 933 | 214.7 |
| C | 3 | 233 | 137199 | 634.75 | 928 | 933 | 214.7 |
| C | 13 | 61 | 6851 | 27.57 | 928 | 933 | 214.7 |
| D | 1 | 52 | 335780 | 1540.75 | 913 | 888 | 217.4 |
| D | 5 | 222 | 130656 | 597.03 | 913 | 888 | 217.4 |
| D | 2 | 234 | 27372 | 121.85 | 913 | 888 | 217.4 |
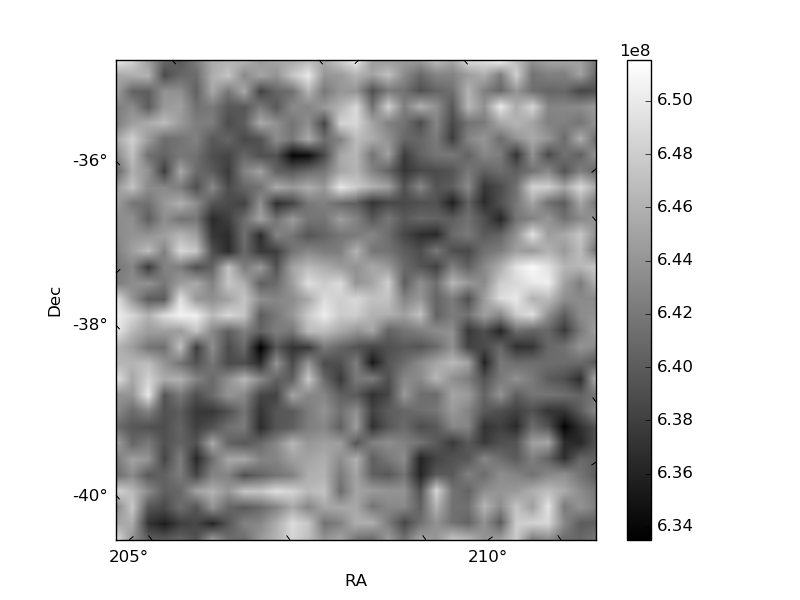
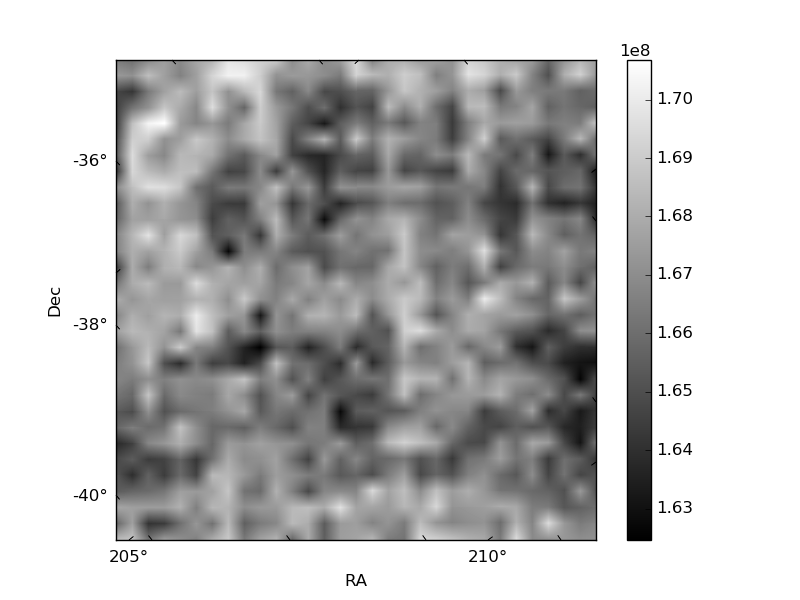
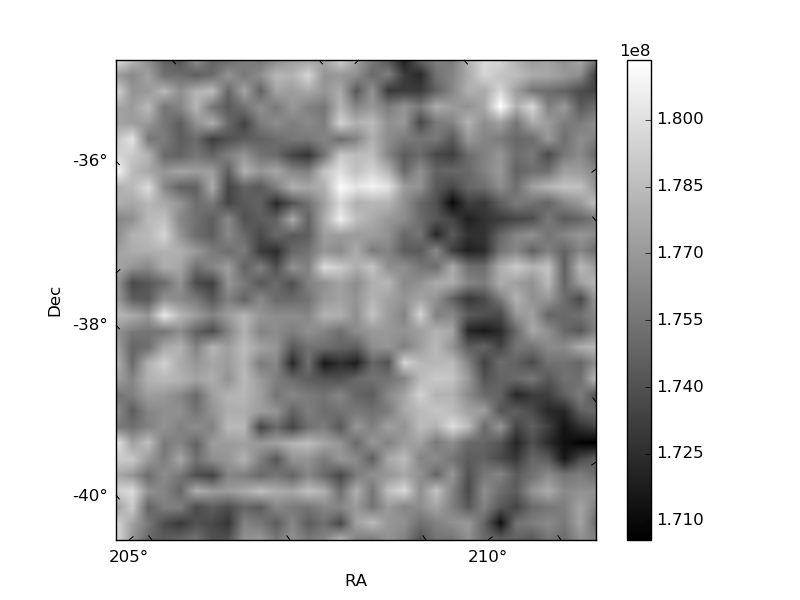
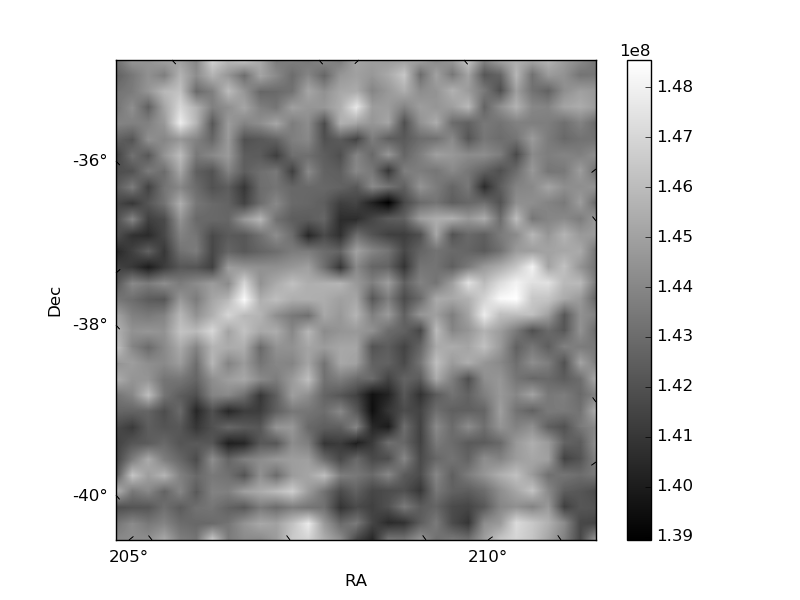
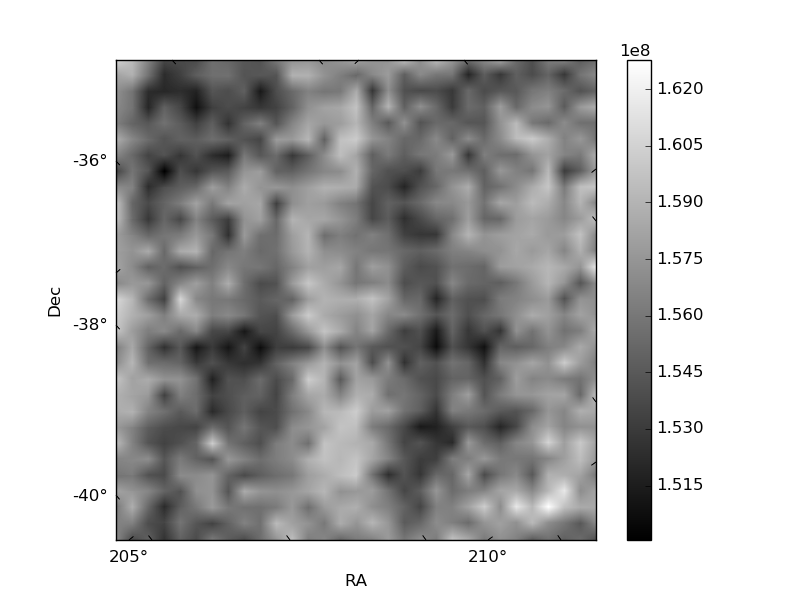
Histogram calculated using DETX and DETY for each event in the final _common_clean file
| Quadrant A | 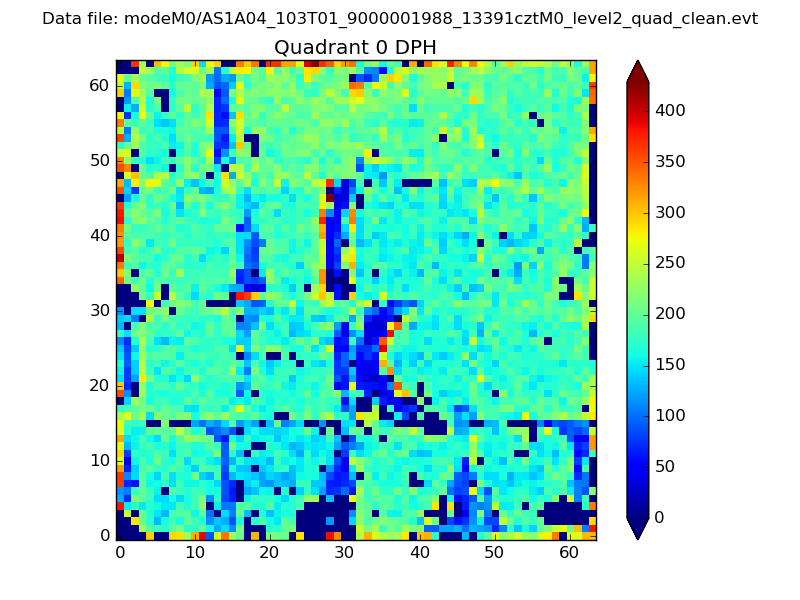 |
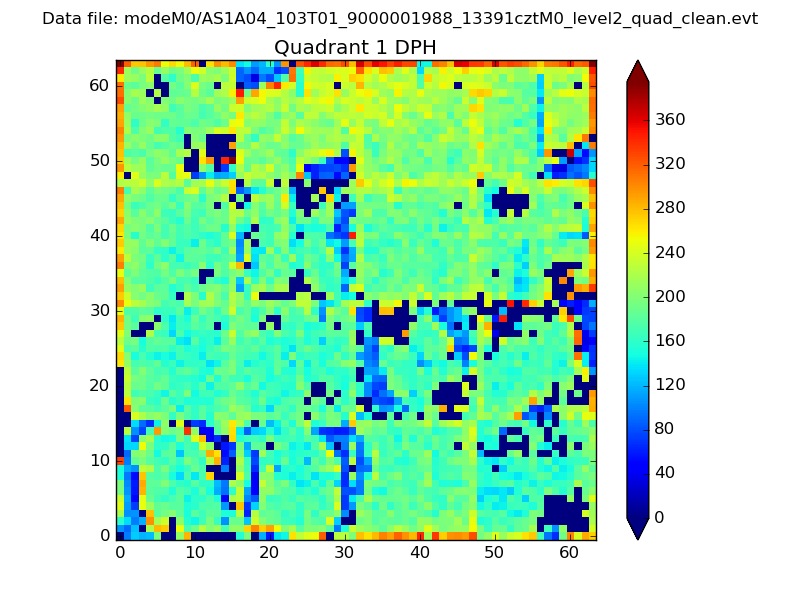 |
Quadrant B |
|---|---|---|---|
| Quadrant D | 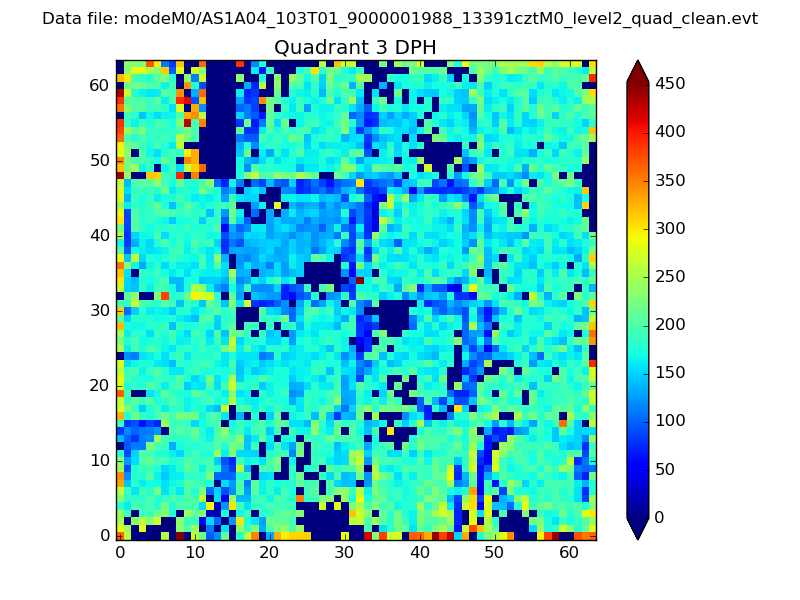 |
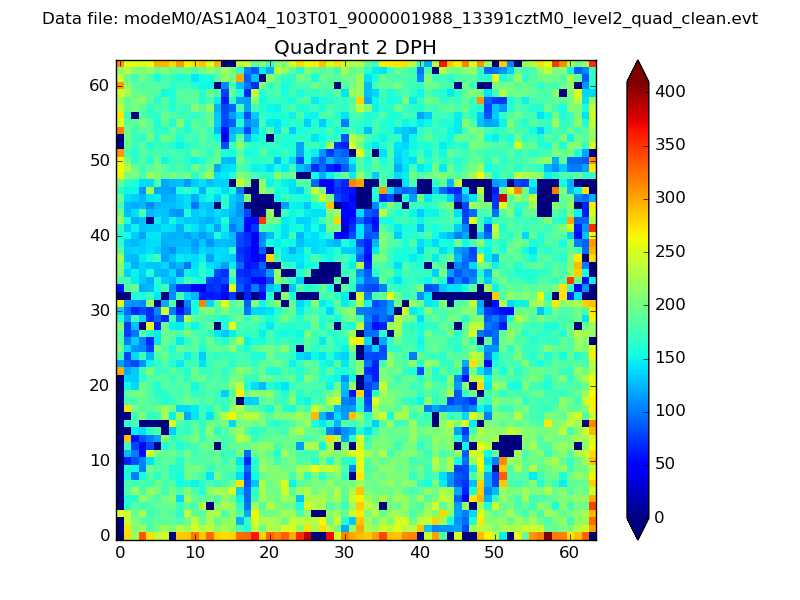 |
Quadrant C |
| Plot type | Count rate plots | Images |
|---|---|---|
| Comparison with Poisson distribution Blue bars denote a histogram of data divided into 1 sec bins. Red curve is a Poisson curve with rate = median count rate of data. |
 |
 |
| Quadrant-wise count rates Data is divided into 100 sec bins |
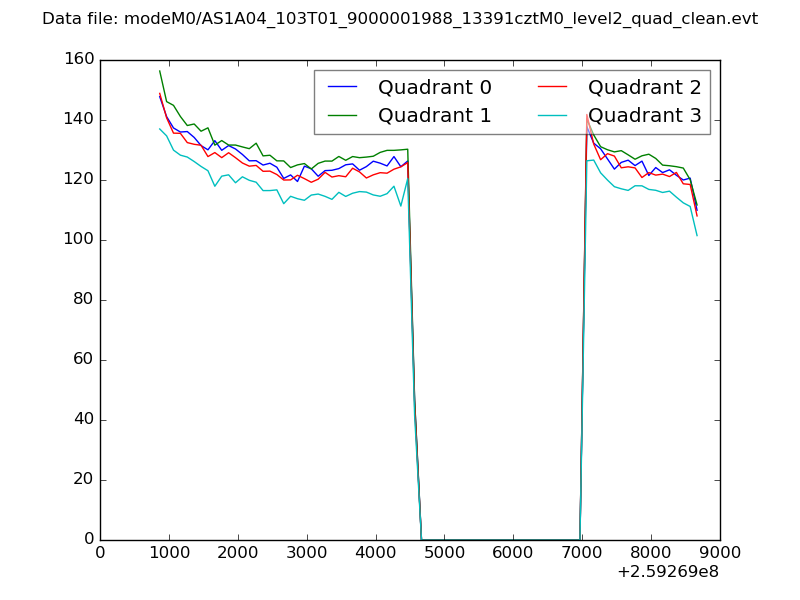 |
|
| Module-wise count rates for Quadrant A Data is divided into 100 sec bins |
 |
 |
| Module-wise count rates for Quadrant B Data is divided into 100 sec bins |
 |
 |
| Module-wise count rates for Quadrant C Data is divided into 100 sec bins |
 |
 |
| Module-wise count rates for Quadrant D Data is divided into 100 sec bins |
 |
 |
| Parameter | Plot |
|---|---|
| CZT HV Monitor |  |
| D_VDD | 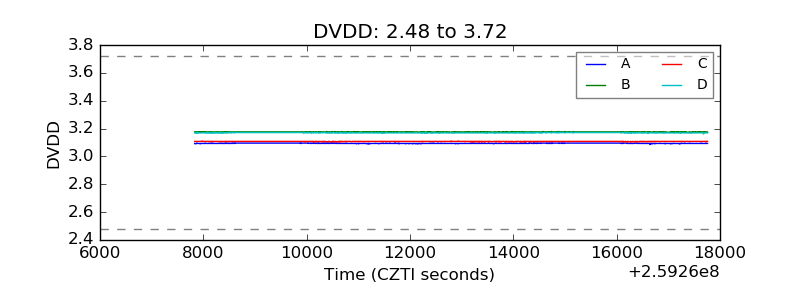 |
| Temperature 1 | 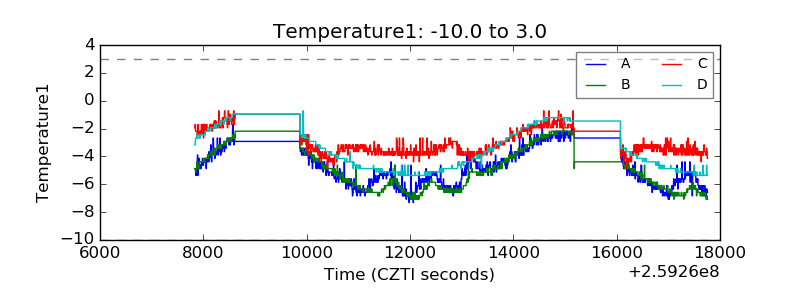 |
| Veto HV Monitor | 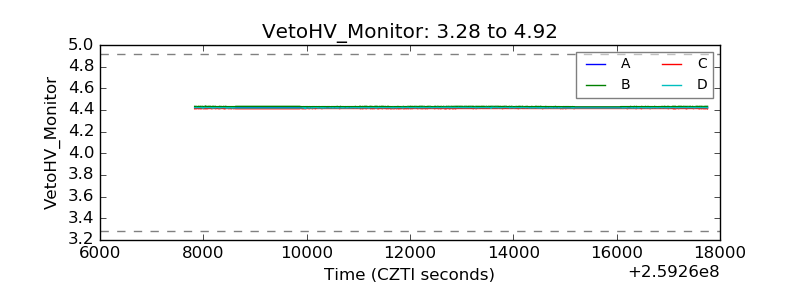 |
| Veto LLD | 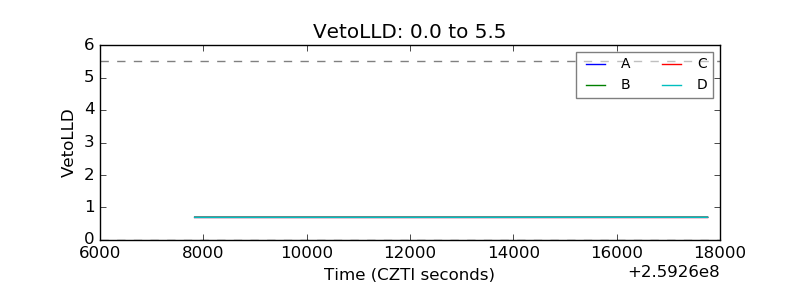 |
| Alpha Counter | 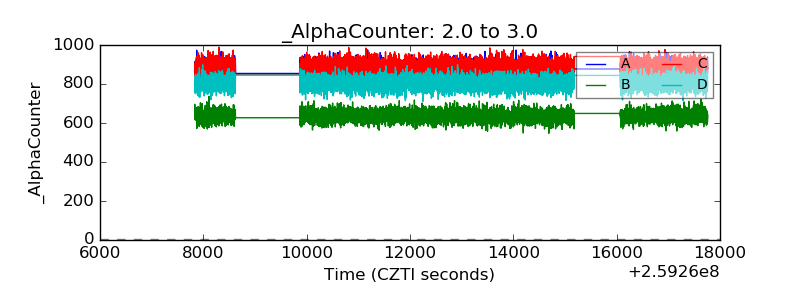 |
| _CPM_Rate | 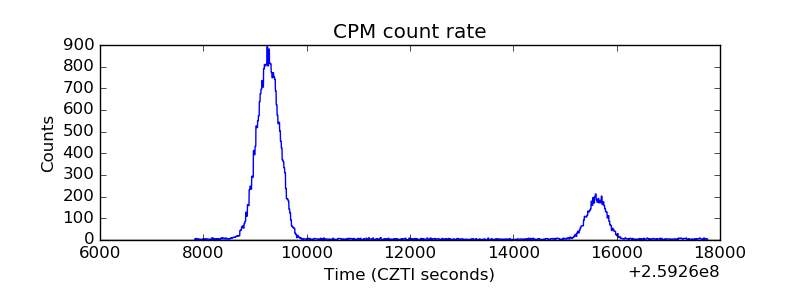 |
| CZT Counter | 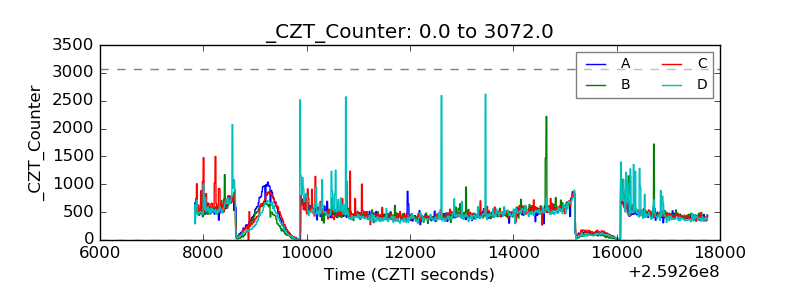 |
| +2.5 Volts monitor |  |
| +5 Volts monitor |  |
| _ROLL_ROT | 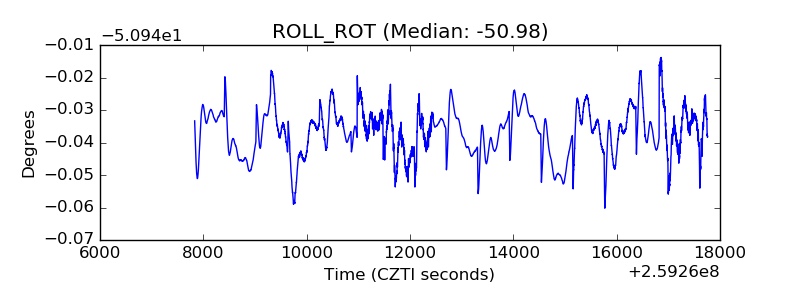 |
| _Roll_DEC | 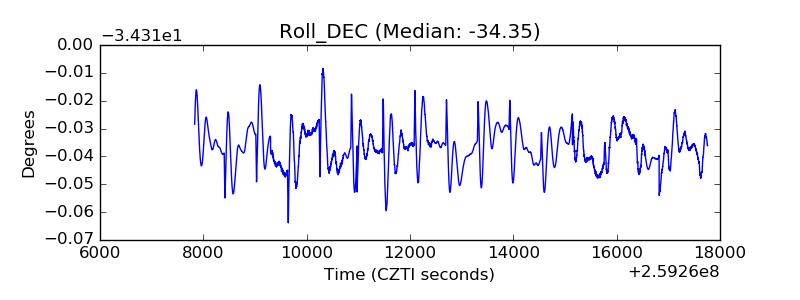 |
| _Roll_RA | 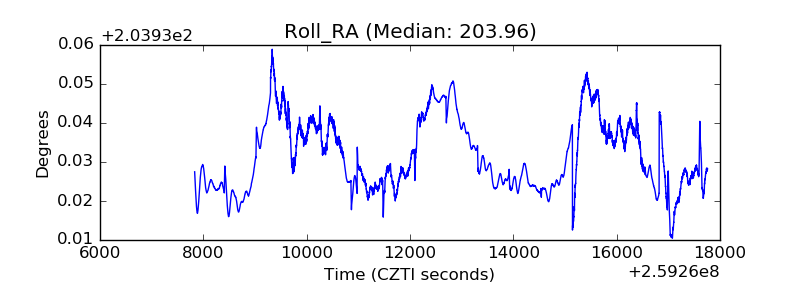 |
| Veto Counter |  |