| Param | Original file | Final file |
|---|---|---|
| Filename | modeM0/AS1A04_103T01_9000001988_13393cztM0_level2.evt | modeM0/AS1A04_103T01_9000001988_13393cztM0_level2_quad_clean.evt |
| Size (bytes) | 562,343,040 | 109,414,080 |
| Size | 536.3 MB | 104.3 MB |
| Events in quadrant A | 3,635,244 | 710,646 |
| Events in quadrant B | 4,916,459 | 679,407 |
| Events in quadrant C | 4,108,085 | 703,745 |
| Events in quadrant D | 3,834,508 | 670,411 |
| Mode M0 | |||
|---|---|---|---|
| Quadrant | BADHDUFLAG | Total packets | Discarded packets |
| A | 0 | 16332 | 3 |
| B | 0 | 19930 | 2 |
| C | 0 | 17454 | 2 |
| D | 0 | 16949 | 2 |
| Mode SS | |||
|---|---|---|---|
| Quadrant | BADHDUFLAG | Total packets | Discarded packets |
| A | 0 | 162 | 0 |
| B | 0 | 162 | 0 |
| C | 0 | 162 | 0 |
| D | 0 | 162 | 0 |
| Mode M9 | |||
|---|---|---|---|
| Quadrant | BADHDUFLAG | Total packets | Discarded packets |
| A | 0 | 7 | 0 |
| B | 0 | 7 | 0 |
| C | 0 | 7 | 0 |
| D | 0 | 7 | 0 |
| Quadrant | Total seconds | Saturated seconds | Saturation percentage |
|---|---|---|---|
| A | 7901 | 35 | 0.442982% |
| B | 7901 | 630 | 7.973674% |
| C | 7901 | 75 | 0.949247% |
| D | 7901 | 57 | 0.721428% |
Noise dominated data is calculated using 1-second bins in cleaned event files. If a bin has >2000 counts, and if more than 50% of those come from <1% of pixels, then it is considered to be noise-dominated and hence unusable.
| Quadrant | # 1 sec bins | Bins with >0 counts | Bins with >2000 counts | High rate bins dominated by noise | Noise dominated (total time) | Noise dominated (detector-on time) | Marked lightcurve |
|---|---|---|---|---|---|---|---|
| A | 8602 | 7903 | 1 | 1 | 0.01% | 0.01% |  |
| B | 8602 | 7903 | 391 | 391 | 4.55% | 4.95% |  |
| C | 8602 | 7903 | 31 | 31 | 0.36% | 0.39% |  |
| D | 8602 | 7904 | 47 | 47 | 0.55% | 0.59% |  |
Top three noisy pixels from each quadrant. If the there are fewer than three noisy pixels in the level2.evt file, extra rows are filled as -1
| Pixel properties | Quadrant properties | ||||||
|---|---|---|---|---|---|---|---|
| Quadrant | DetID | PixID | Counts | Sigma | Mean | Median | Sigma |
| A | 15 | 69 | 14983 | 72.86 | 938 | 915 | 193.1 |
| A | 1 | 162 | 10926 | 51.85 | 938 | 915 | 193.1 |
| A | 0 | 226 | 8336 | 38.43 | 938 | 915 | 193.1 |
| B | 3 | 64 | 1273261 | 7420.28 | 897 | 874 | 171.5 |
| B | 4 | 142 | 69179 | 398.34 | 897 | 874 | 171.5 |
| B | 0 | 214 | 30582 | 173.25 | 897 | 874 | 171.5 |
| C | 14 | 220 | 403957 | 1886.11 | 919 | 922 | 213.7 |
| C | 3 | 233 | 115695 | 537.11 | 919 | 922 | 213.7 |
| C | 13 | 61 | 6486 | 26.04 | 919 | 922 | 213.7 |
| D | 1 | 52 | 163123 | 747.85 | 903 | 876 | 217.0 |
| D | 8 | 195 | 114204 | 522.37 | 903 | 876 | 217.0 |
| D | 2 | 136 | 110825 | 506.79 | 903 | 876 | 217.0 |
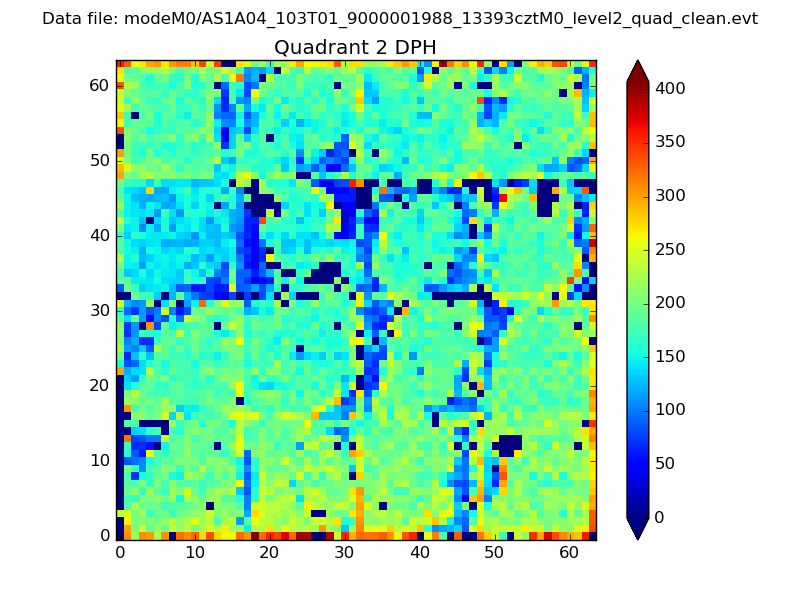
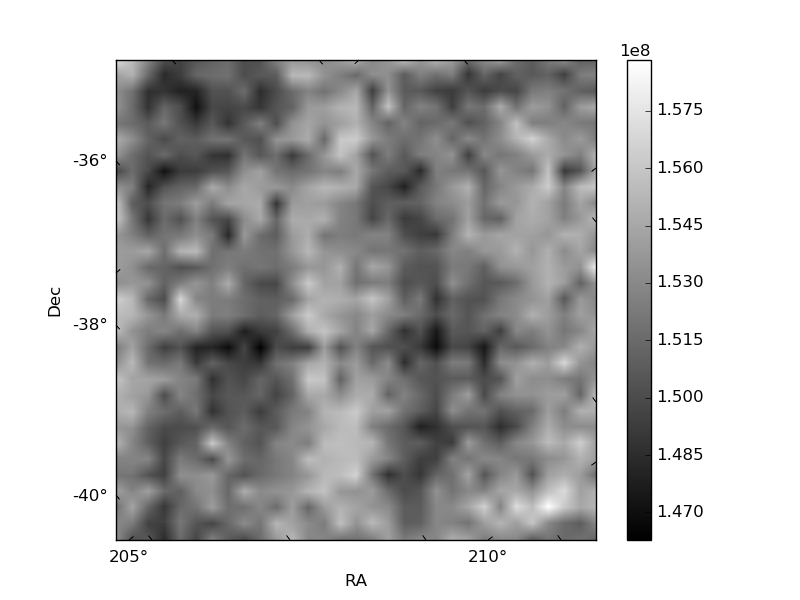
Histogram calculated using DETX and DETY for each event in the final _common_clean file
| Quadrant A | 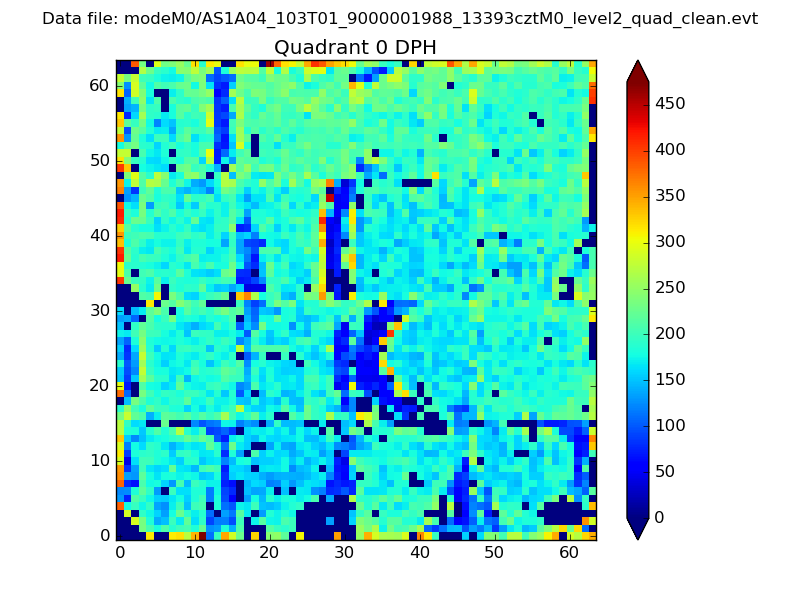 |
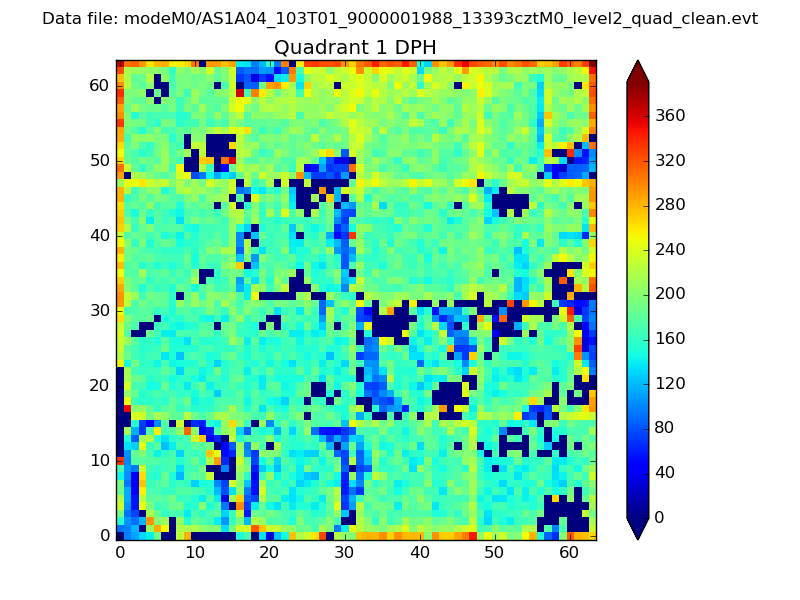 |
Quadrant B |
|---|---|---|---|
| Quadrant D | 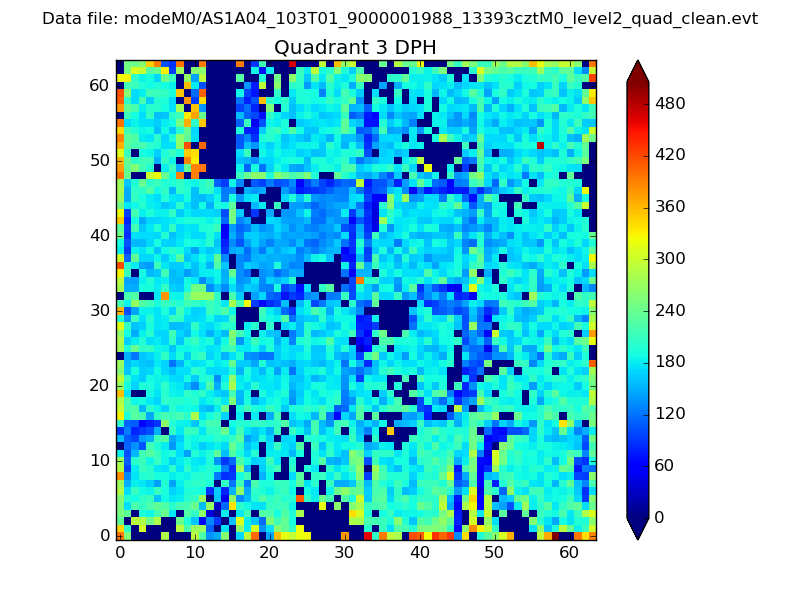 |
 |
Quadrant C |
| Plot type | Count rate plots | Images |
|---|---|---|
| Comparison with Poisson distribution Blue bars denote a histogram of data divided into 1 sec bins. Red curve is a Poisson curve with rate = median count rate of data. |
 |
 |
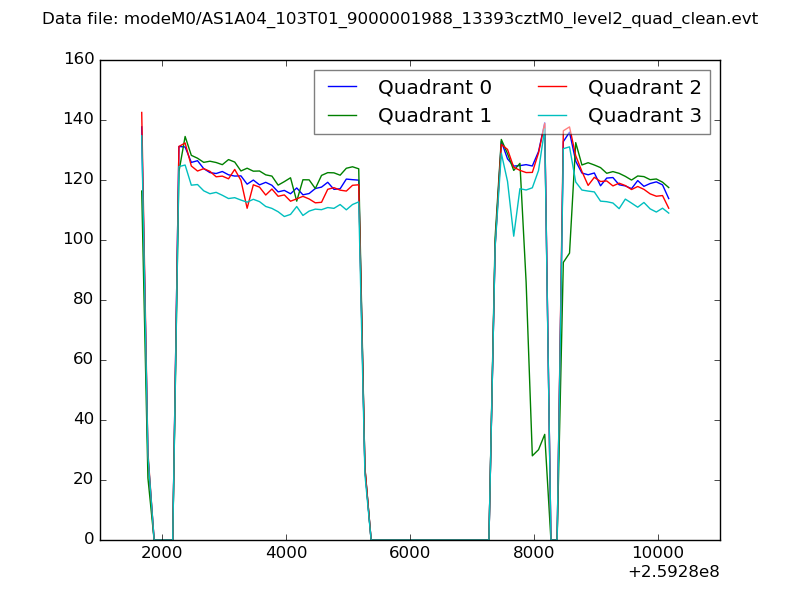
| Quadrant-wise count rates Data is divided into 100 sec bins |
 |
|
| Module-wise count rates for Quadrant A Data is divided into 100 sec bins |
 |
 |
| Module-wise count rates for Quadrant B Data is divided into 100 sec bins |
 |
 |
| Module-wise count rates for Quadrant C Data is divided into 100 sec bins |
 |
 |
| Module-wise count rates for Quadrant D Data is divided into 100 sec bins |
 |
 |
| Parameter | Plot |
|---|---|
| CZT HV Monitor | 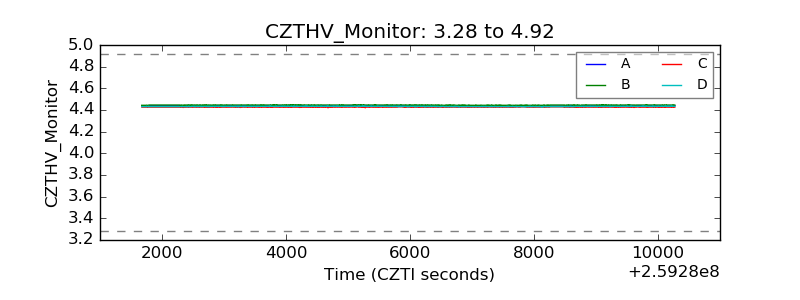 |
| D_VDD | 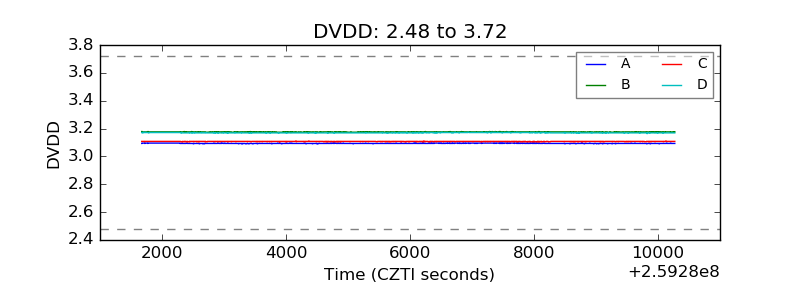 |
| Temperature 1 |  |
| Veto HV Monitor | 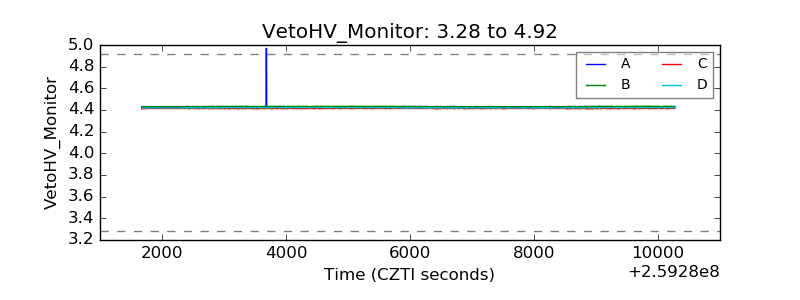 |
| Veto LLD | 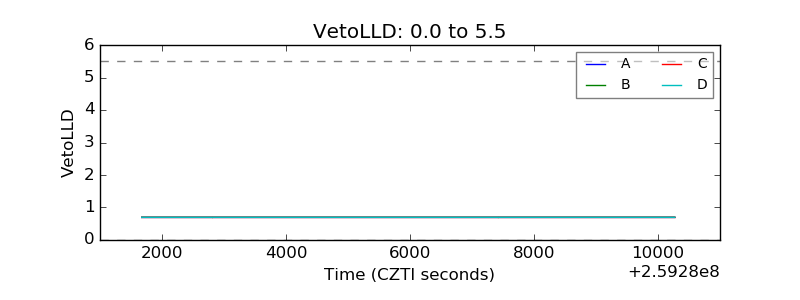 |
| Alpha Counter | 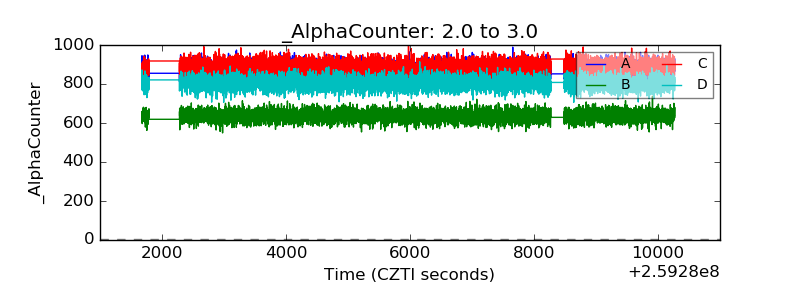 |
| _CPM_Rate | 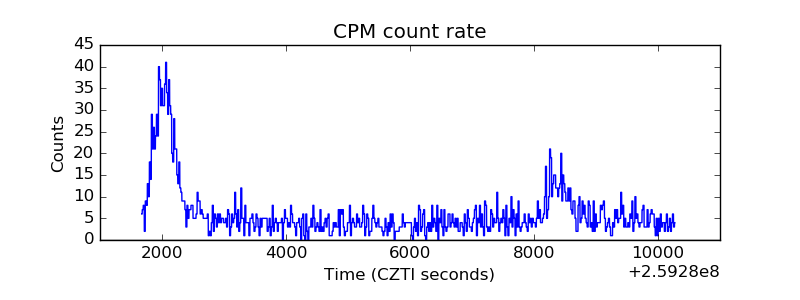 |
| CZT Counter | 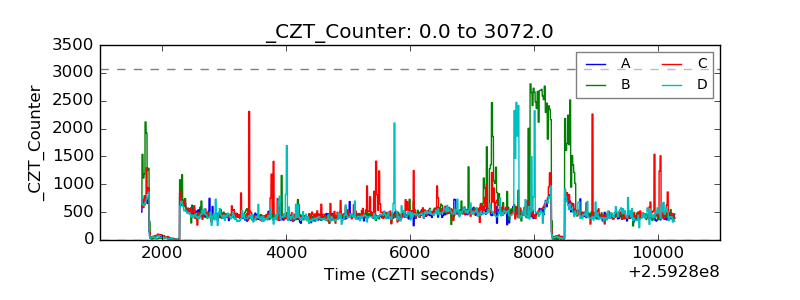 |
| +2.5 Volts monitor |  |
| +5 Volts monitor |  |
| _ROLL_ROT |  |
| _Roll_DEC |  |
| _Roll_RA | 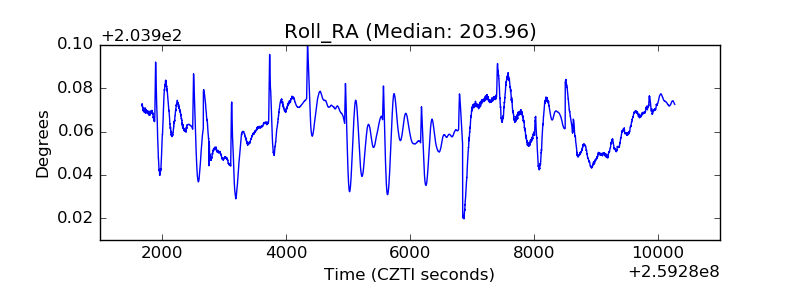 |
| Veto Counter | 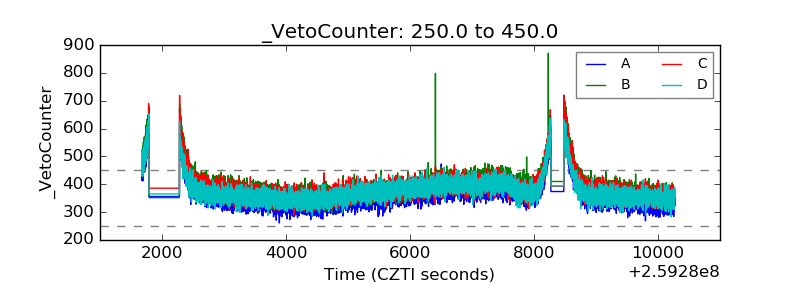 |