| Param | Original file | Final file |
|---|---|---|
| Filename | modeM0/AS1A04_103T01_9000001988_13394cztM0_level2.evt | modeM0/AS1A04_103T01_9000001988_13394cztM0_level2_quad_clean.evt |
| Size (bytes) | 621,745,920 | 119,404,800 |
| Size | 592.9 MB | 113.9 MB |
| Events in quadrant A | 3,866,098 | 776,702 |
| Events in quadrant B | 5,025,190 | 749,797 |
| Events in quadrant C | 4,318,557 | 770,772 |
| Events in quadrant D | 5,047,965 | 733,163 |
| Mode M0 | |||
|---|---|---|---|
| Quadrant | BADHDUFLAG | Total packets | Discarded packets |
| A | 0 | 17302 | 3 |
| B | 0 | 20551 | 2 |
| C | 0 | 18144 | 2 |
| D | 0 | 20723 | 2 |
| Mode SS | |||
|---|---|---|---|
| Quadrant | BADHDUFLAG | Total packets | Discarded packets |
| A | 0 | 174 | 0 |
| B | 0 | 174 | 0 |
| C | 0 | 174 | 0 |
| D | 0 | 174 | 0 |
| Mode M9 | |||
|---|---|---|---|
| Quadrant | BADHDUFLAG | Total packets | Discarded packets |
| A | 0 | 5 | 0 |
| B | 0 | 5 | 0 |
| C | 0 | 5 | 0 |
| D | 0 | 5 | 0 |
| Quadrant | Total seconds | Saturated seconds | Saturation percentage |
|---|---|---|---|
| A | 8433 | 68 | 0.806356% |
| B | 8433 | 607 | 7.197913% |
| C | 8433 | 120 | 1.422981% |
| D | 8433 | 202 | 2.395352% |
Noise dominated data is calculated using 1-second bins in cleaned event files. If a bin has >2000 counts, and if more than 50% of those come from <1% of pixels, then it is considered to be noise-dominated and hence unusable.
| Quadrant | # 1 sec bins | Bins with >0 counts | Bins with >2000 counts | High rate bins dominated by noise | Noise dominated (total time) | Noise dominated (detector-on time) | Marked lightcurve |
|---|---|---|---|---|---|---|---|
| A | 8919 | 8434 | 0 | 0 | 0.00% | 0.00% | 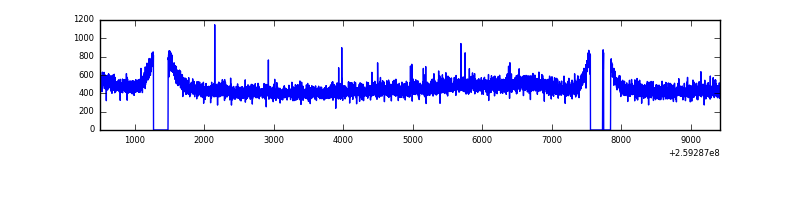 |
| B | 8919 | 8434 | 367 | 367 | 4.11% | 4.35% | 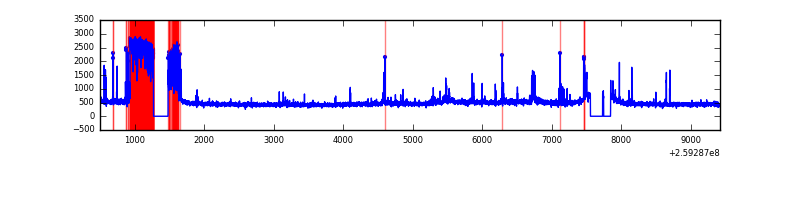 |
| C | 8919 | 8434 | 21 | 21 | 0.24% | 0.25% | 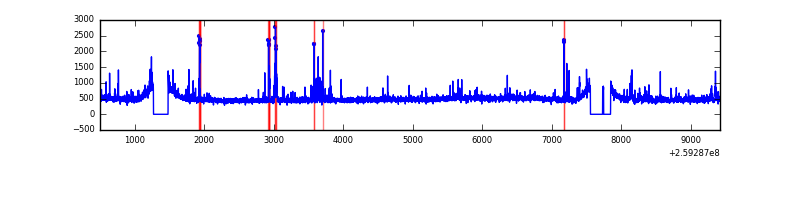 |
| D | 8919 | 8436 | 120 | 120 | 1.35% | 1.42% | 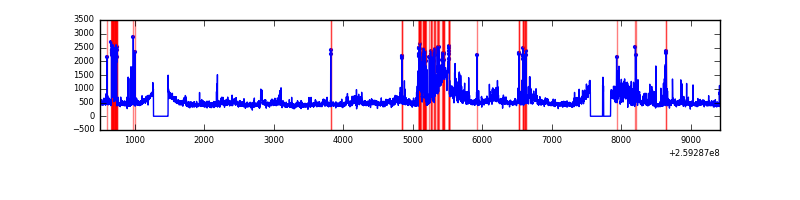 |
Top three noisy pixels from each quadrant. If the there are fewer than three noisy pixels in the level2.evt file, extra rows are filled as -1
| Pixel properties | Quadrant properties | ||||||
|---|---|---|---|---|---|---|---|
| Quadrant | DetID | PixID | Counts | Sigma | Mean | Median | Sigma |
| A | 0 | 226 | 8763 | 37.6 | 1004 | 980 | 207.0 |
| A | 12 | 194 | 7604 | 32.0 | 1004 | 980 | 207.0 |
| A | 1 | 162 | 7451 | 31.26 | 1004 | 980 | 207.0 |
| B | 3 | 64 | 1116363 | 5991.14 | 965 | 938 | 186.2 |
| B | 4 | 173 | 42777 | 224.72 | 965 | 938 | 186.2 |
| B | 4 | 142 | 42165 | 221.44 | 965 | 938 | 186.2 |
| C | 14 | 220 | 270983 | 1180.26 | 982 | 985 | 228.8 |
| C | 3 | 233 | 195688 | 851.12 | 982 | 985 | 228.8 |
| C | 14 | 234 | 22251 | 92.96 | 982 | 985 | 228.8 |
| D | 1 | 52 | 920136 | 3976.03 | 964 | 935 | 231.2 |
| D | 8 | 195 | 426472 | 1840.67 | 964 | 935 | 231.2 |
| D | 2 | 234 | 29517 | 123.63 | 964 | 935 | 231.2 |
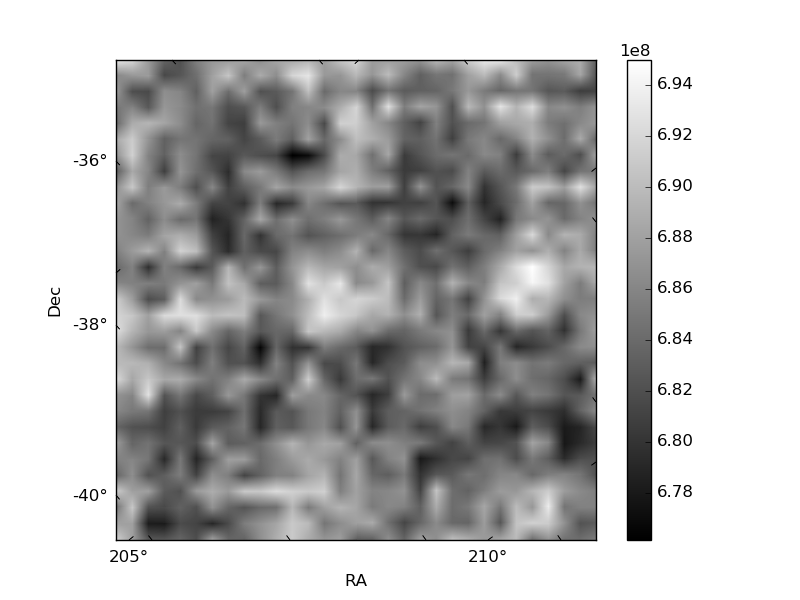
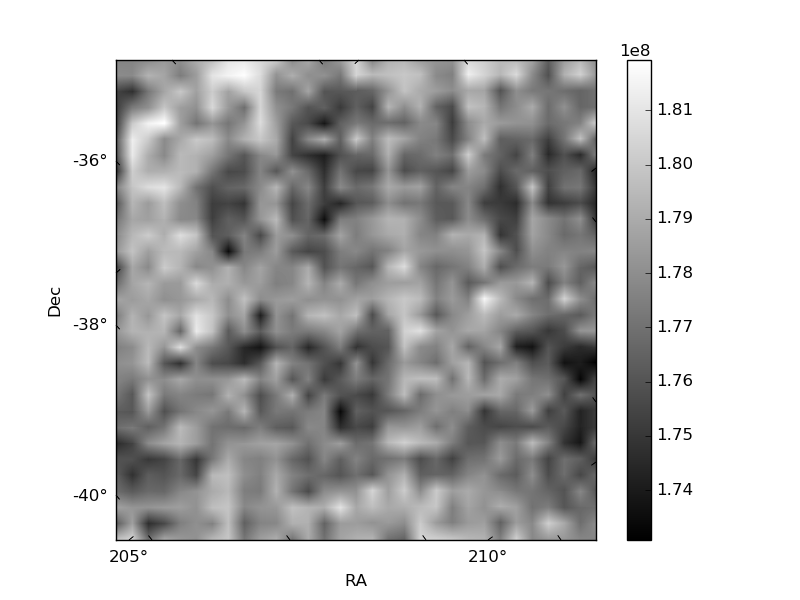
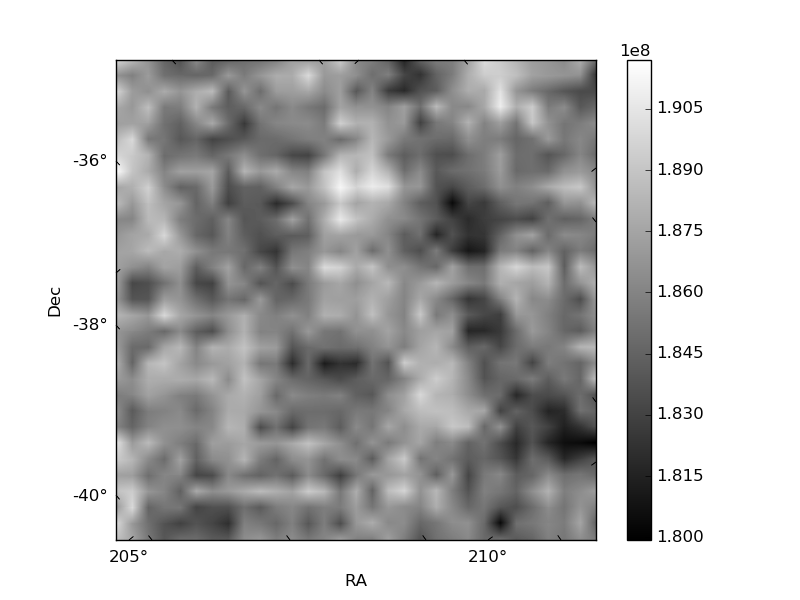
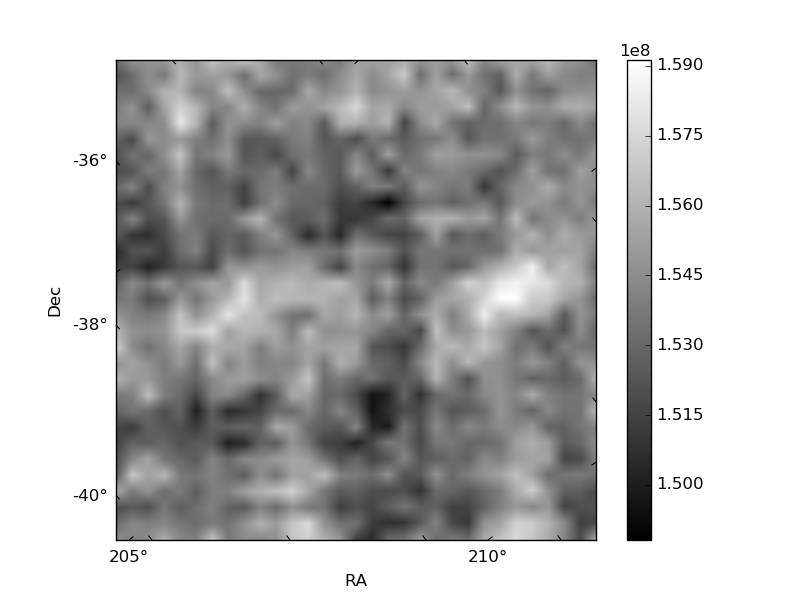
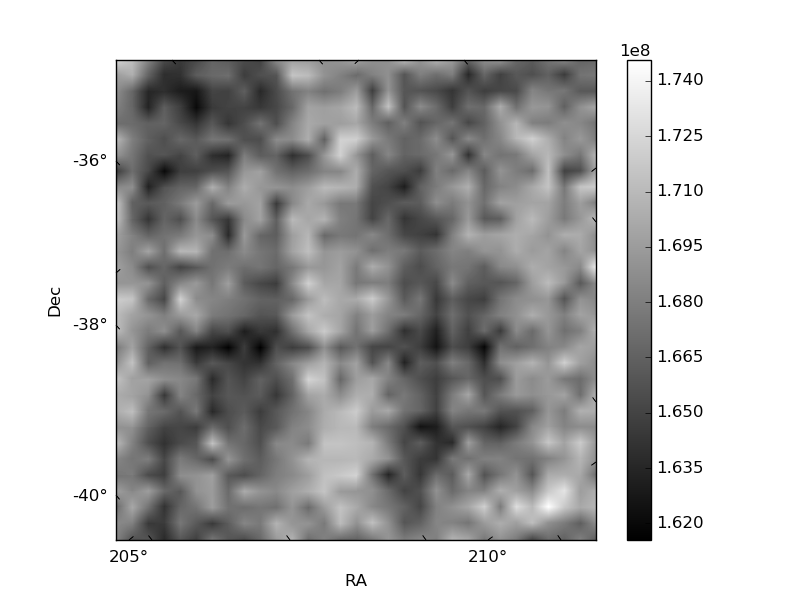
Histogram calculated using DETX and DETY for each event in the final _common_clean file
| Quadrant A | 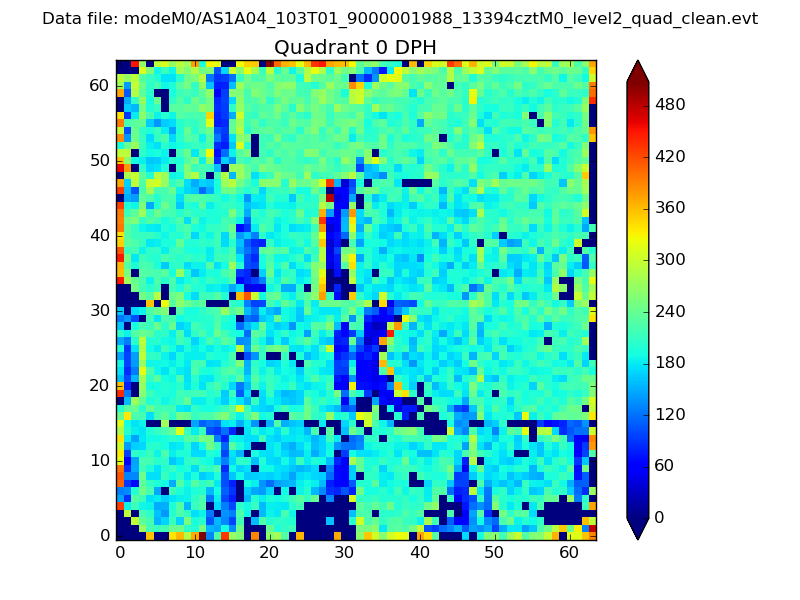 |
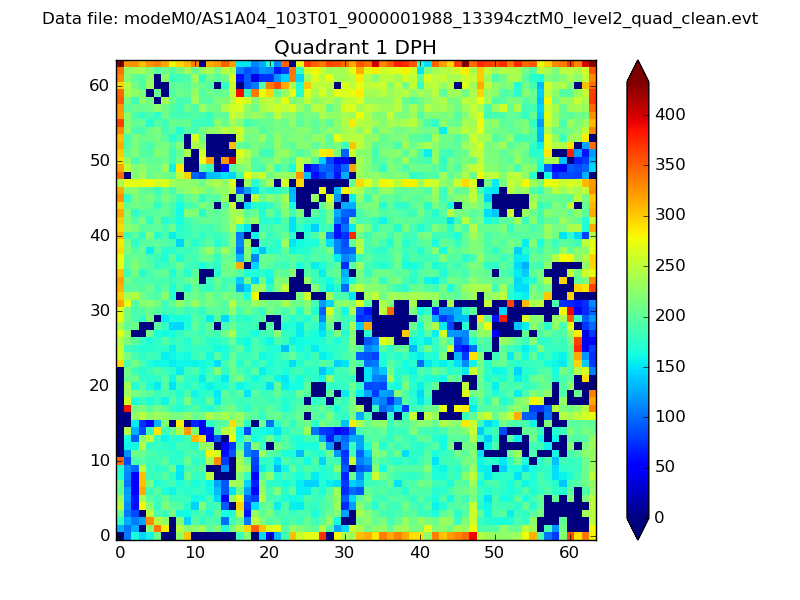 |
Quadrant B |
|---|---|---|---|
| Quadrant D | 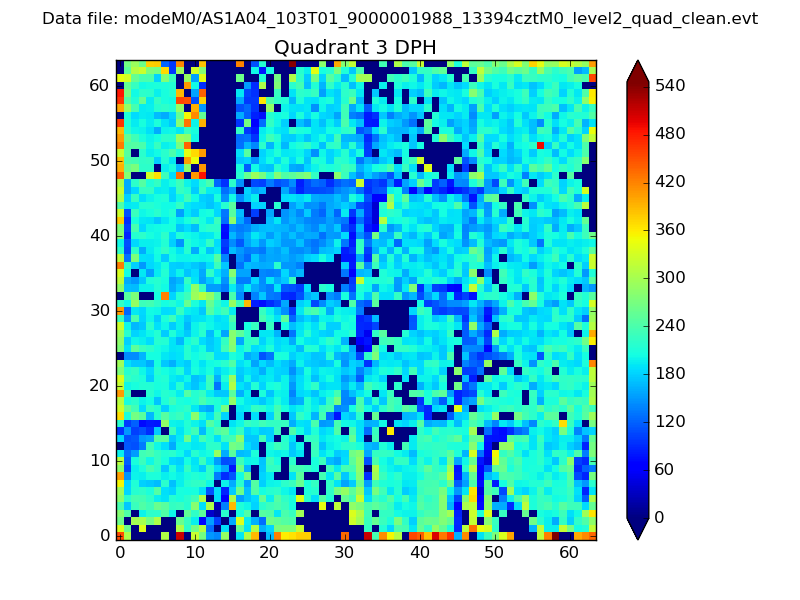 |
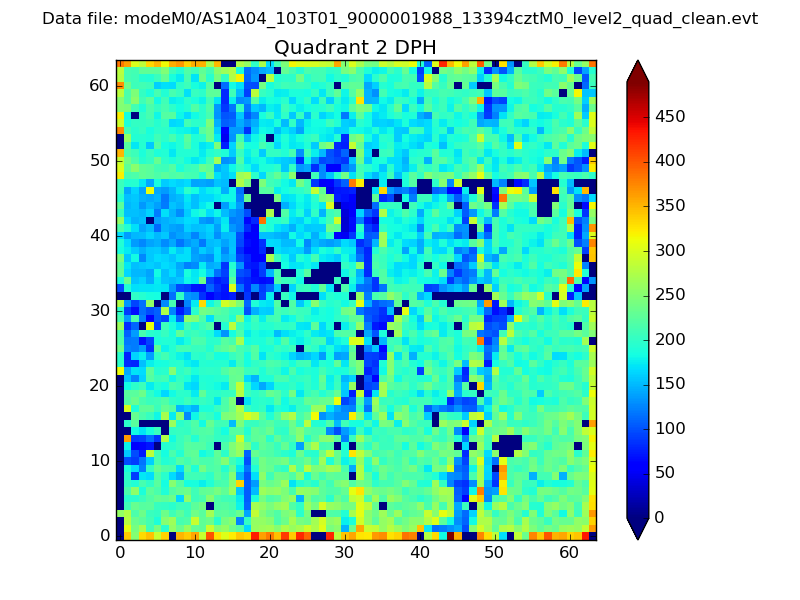 |
Quadrant C |
| Plot type | Count rate plots | Images |
|---|---|---|
| Comparison with Poisson distribution Blue bars denote a histogram of data divided into 1 sec bins. Red curve is a Poisson curve with rate = median count rate of data. |
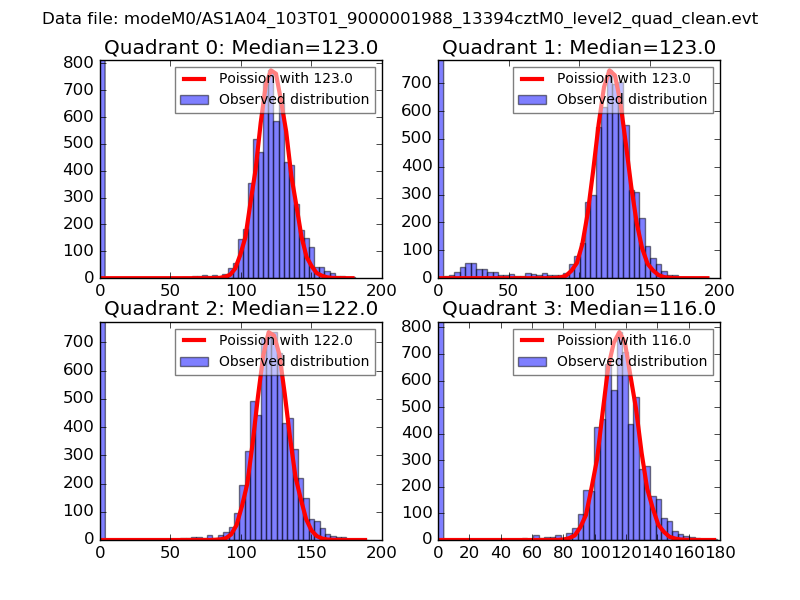 |
 |
| Quadrant-wise count rates Data is divided into 100 sec bins |
 |
|
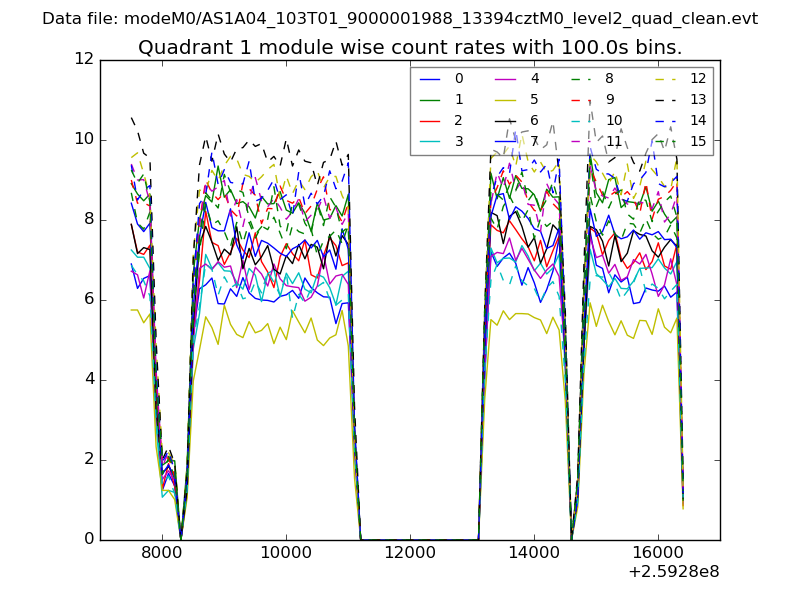
| Module-wise count rates for Quadrant A Data is divided into 100 sec bins |
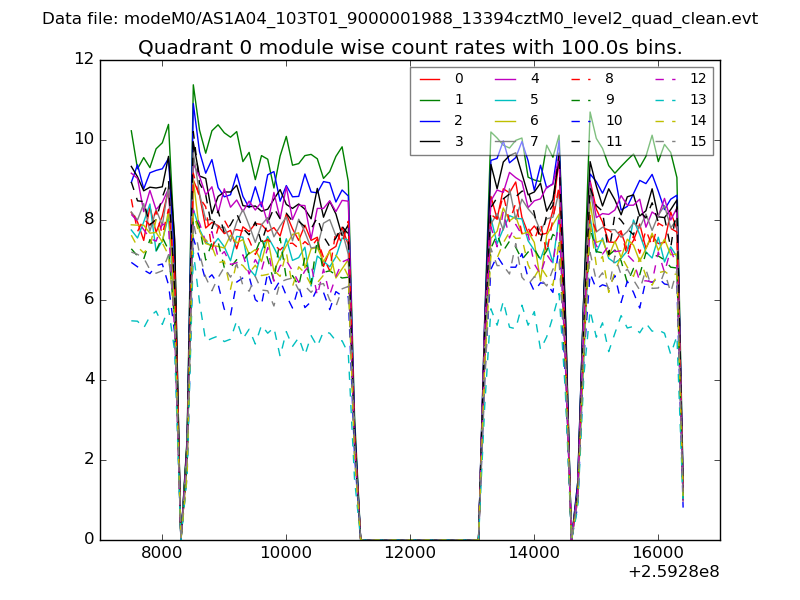 |
 |
| Module-wise count rates for Quadrant B Data is divided into 100 sec bins |
 |
 |
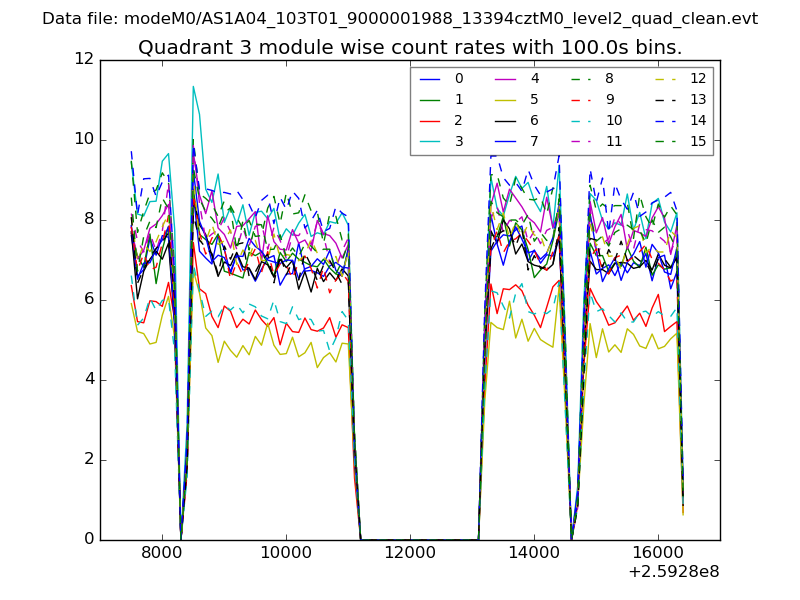
| Module-wise count rates for Quadrant C Data is divided into 100 sec bins |
 |
 |
| Module-wise count rates for Quadrant D Data is divided into 100 sec bins |
 |
 |
| Parameter | Plot |
|---|---|
| CZT HV Monitor |  |
| D_VDD | 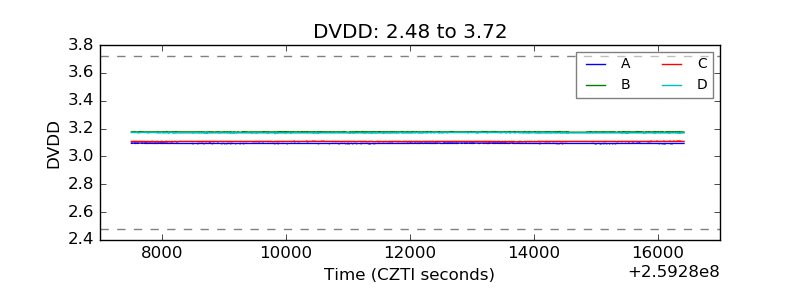 |
| Temperature 1 | 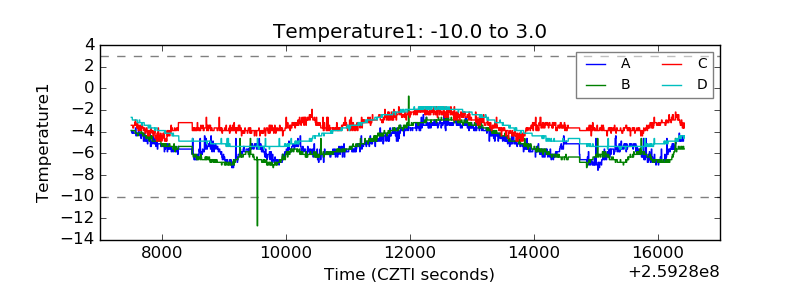 |
| Veto HV Monitor | 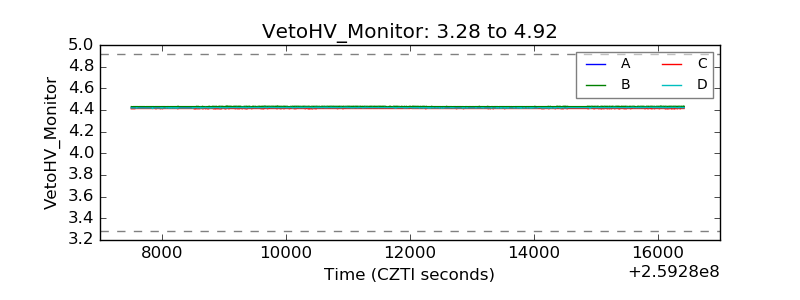 |
| Veto LLD | 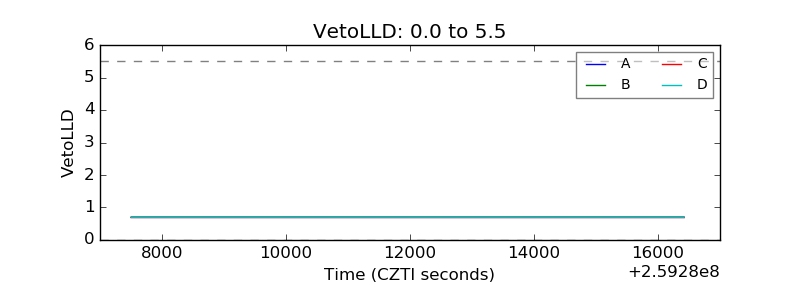 |
| Alpha Counter | 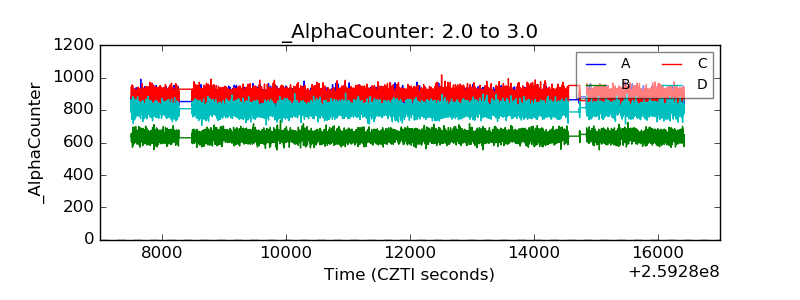 |
| _CPM_Rate | 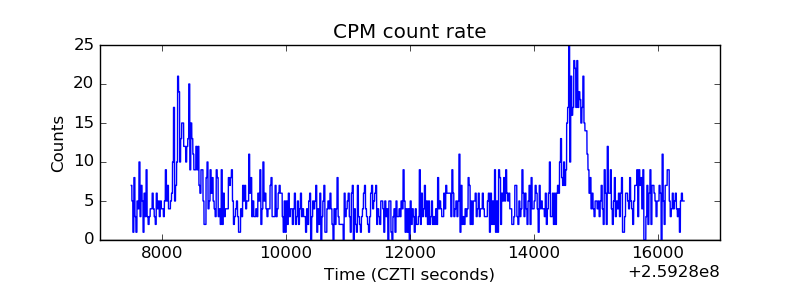 |
| CZT Counter | 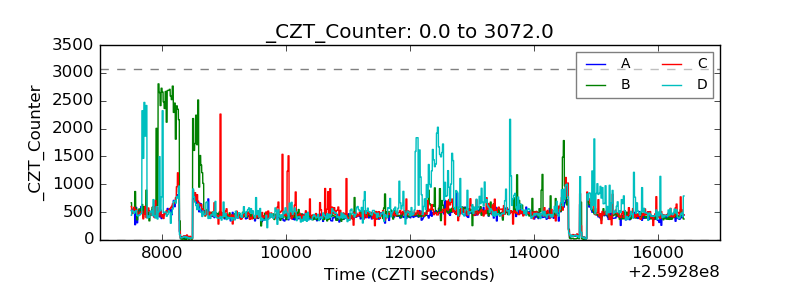 |
| +2.5 Volts monitor |  |
| +5 Volts monitor |  |
| _ROLL_ROT | 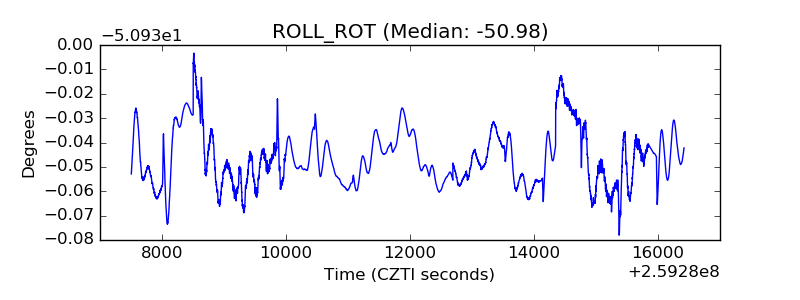 |
| _Roll_DEC | 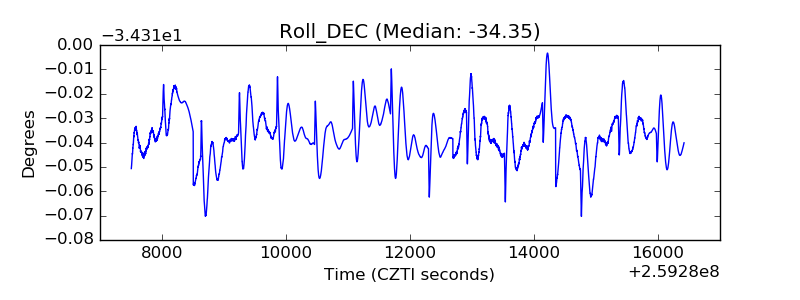 |
| _Roll_RA | 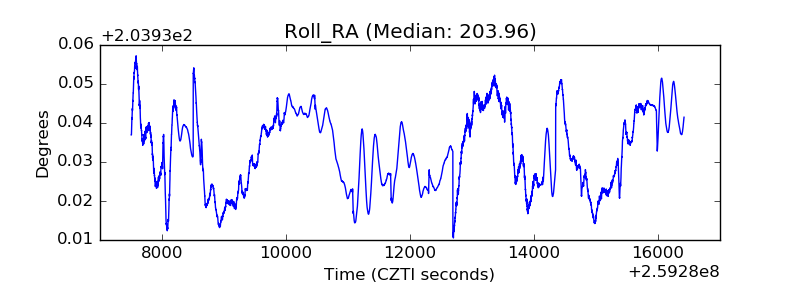 |
| Veto Counter | 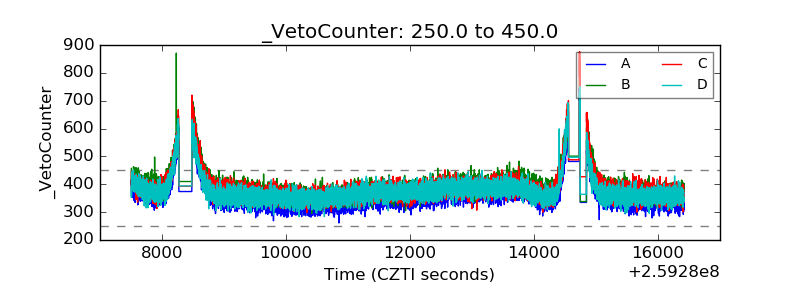 |