| Param | Original file | Final file |
|---|---|---|
| Filename | modeM0/AS1A04_103T01_9000001988_13396cztM0_level2.evt | modeM0/AS1A04_103T01_9000001988_13396cztM0_level2_quad_clean.evt |
| Size (bytes) | 862,211,520 | 156,329,280 |
| Size | 822.3 MB | 149.1 MB |
| Events in quadrant A | 5,559,682 | 984,055 |
| Events in quadrant B | 6,650,814 | 995,086 |
| Events in quadrant C | 6,486,182 | 976,423 |
| Events in quadrant D | 6,587,028 | 932,623 |
| Mode M0 | |||
|---|---|---|---|
| Quadrant | BADHDUFLAG | Total packets | Discarded packets |
| A | 0 | 24860 | 4 |
| B | 0 | 27848 | 3 |
| C | 0 | 27130 | 3 |
| D | 0 | 27794 | 3 |
| Mode SS | |||
|---|---|---|---|
| Quadrant | BADHDUFLAG | Total packets | Discarded packets |
| A | 0 | 250 | 0 |
| B | 0 | 250 | 0 |
| C | 0 | 250 | 0 |
| D | 0 | 250 | 0 |
| Mode M9 | |||
|---|---|---|---|
| Quadrant | BADHDUFLAG | Total packets | Discarded packets |
| A | 0 | 10 | 0 |
| B | 0 | 10 | 0 |
| C | 0 | 10 | 0 |
| D | 0 | 10 | 0 |
| Quadrant | Total seconds | Saturated seconds | Saturation percentage |
|---|---|---|---|
| A | 12232 | 126 | 1.030085% |
| B | 12232 | 441 | 3.605298% |
| C | 12232 | 218 | 1.782211% |
| D | 12233 | 132 | 1.079048% |
Noise dominated data is calculated using 1-second bins in cleaned event files. If a bin has >2000 counts, and if more than 50% of those come from <1% of pixels, then it is considered to be noise-dominated and hence unusable.
| Quadrant | # 1 sec bins | Bins with >0 counts | Bins with >2000 counts | High rate bins dominated by noise | Noise dominated (total time) | Noise dominated (detector-on time) | Marked lightcurve |
|---|---|---|---|---|---|---|---|
| A | 13278 | 12233 | 0 | 0 | 0.00% | 0.00% | 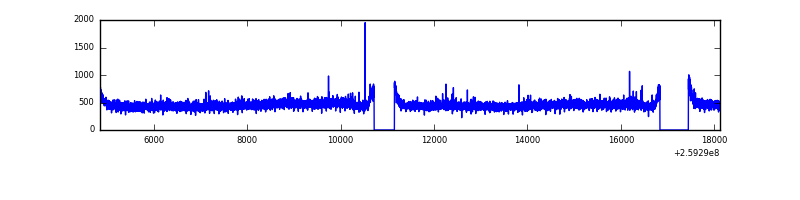 |
| B | 13278 | 12233 | 171 | 171 | 1.29% | 1.40% | 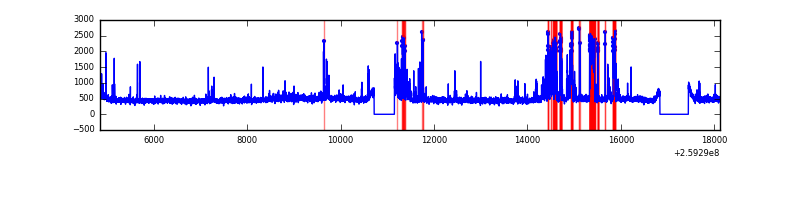 |
| C | 13278 | 12233 | 74 | 74 | 0.56% | 0.60% | 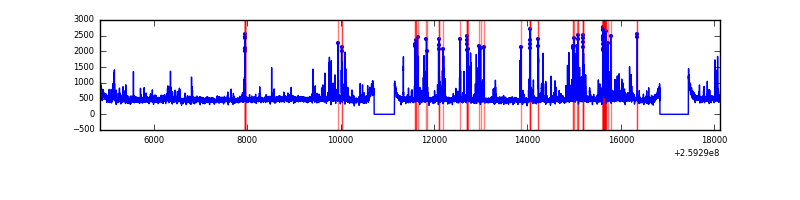 |
| D | 13279 | 12234 | 28 | 28 | 0.21% | 0.23% | 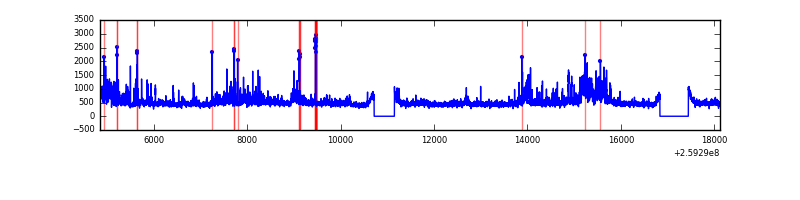 |
Top three noisy pixels from each quadrant. If the there are fewer than three noisy pixels in the level2.evt file, extra rows are filled as -1
| Pixel properties | Quadrant properties | ||||||
|---|---|---|---|---|---|---|---|
| Quadrant | DetID | PixID | Counts | Sigma | Mean | Median | Sigma |
| A | 1 | 162 | 23144 | 74.18 | 1436 | 1404 | 293.1 |
| A | 0 | 226 | 12621 | 38.27 | 1436 | 1404 | 293.1 |
| A | 12 | 194 | 10875 | 32.32 | 1436 | 1404 | 293.1 |
| B | 3 | 64 | 617754 | 2232.87 | 1431 | 1391 | 276.0 |
| B | 10 | 245 | 201682 | 725.58 | 1431 | 1391 | 276.0 |
| B | 4 | 142 | 139059 | 498.72 | 1431 | 1391 | 276.0 |
| C | 14 | 220 | 772201 | 2371.07 | 1407 | 1412 | 325.1 |
| C | 3 | 233 | 204824 | 625.73 | 1407 | 1412 | 325.1 |
| C | 14 | 234 | 22848 | 65.94 | 1407 | 1412 | 325.1 |
| D | 8 | 195 | 711939 | 2124.34 | 1393 | 1352 | 334.5 |
| D | 1 | 52 | 343012 | 1021.41 | 1393 | 1352 | 334.5 |
| D | 5 | 222 | 229343 | 681.59 | 1393 | 1352 | 334.5 |
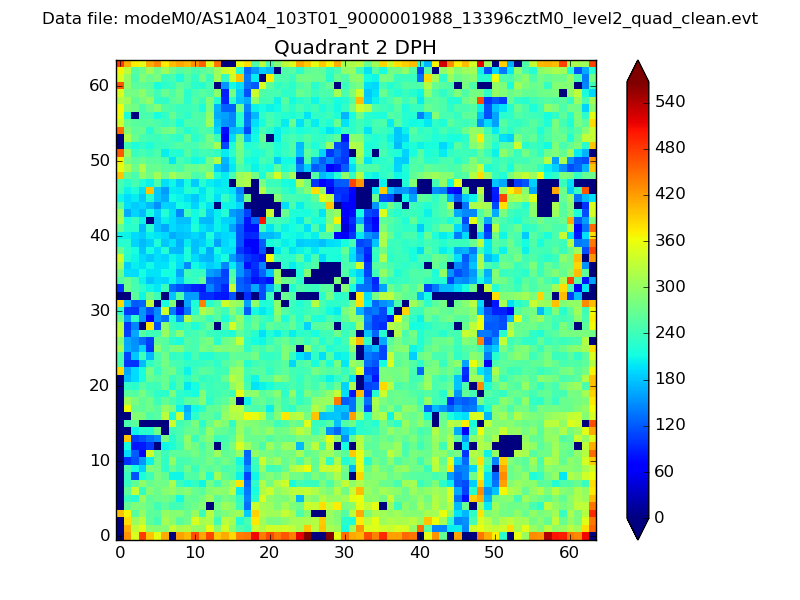
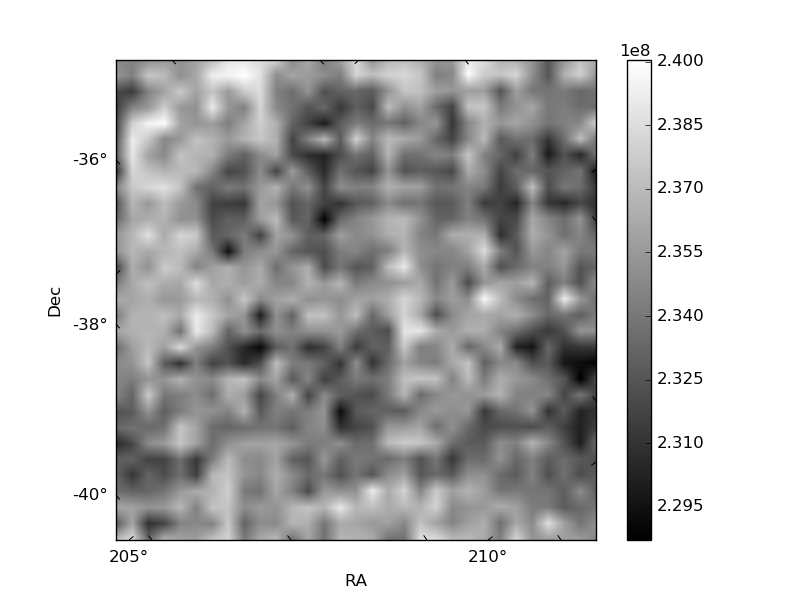
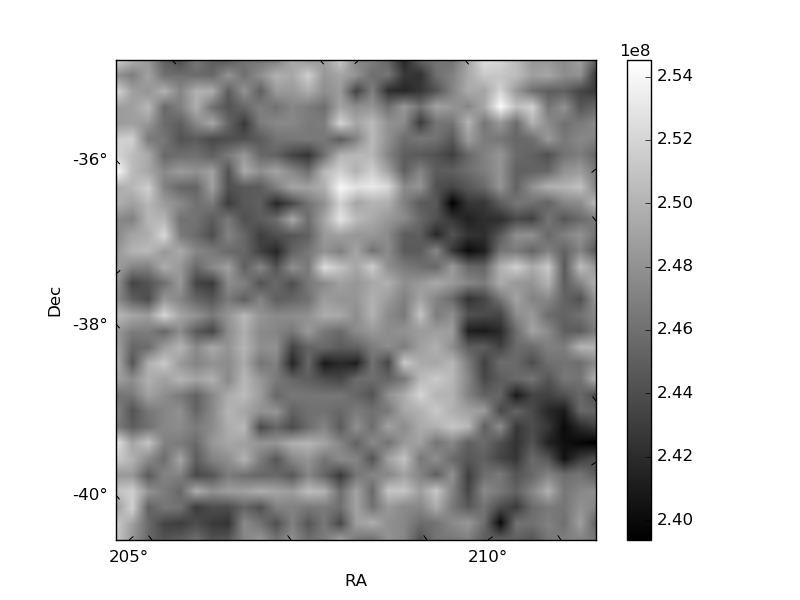
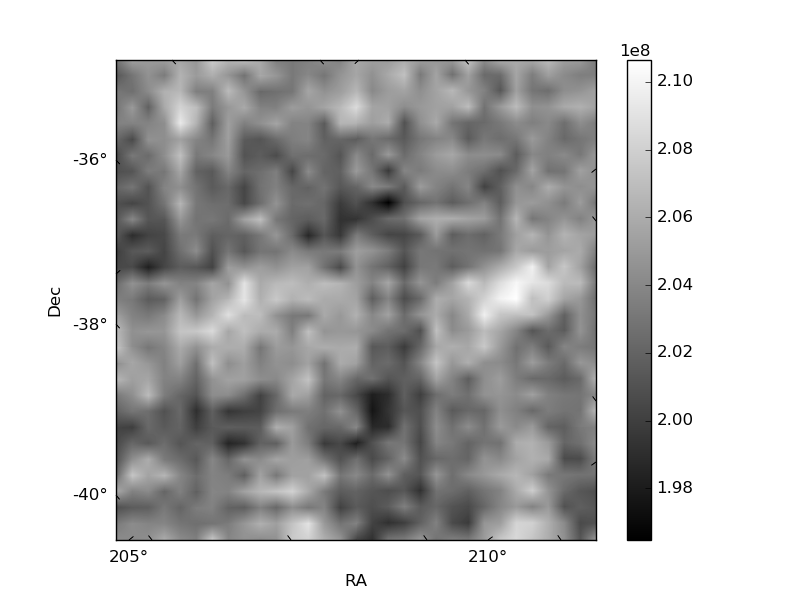
Histogram calculated using DETX and DETY for each event in the final _common_clean file
| Quadrant A |  |
 |
Quadrant B |
|---|---|---|---|
| Quadrant D | 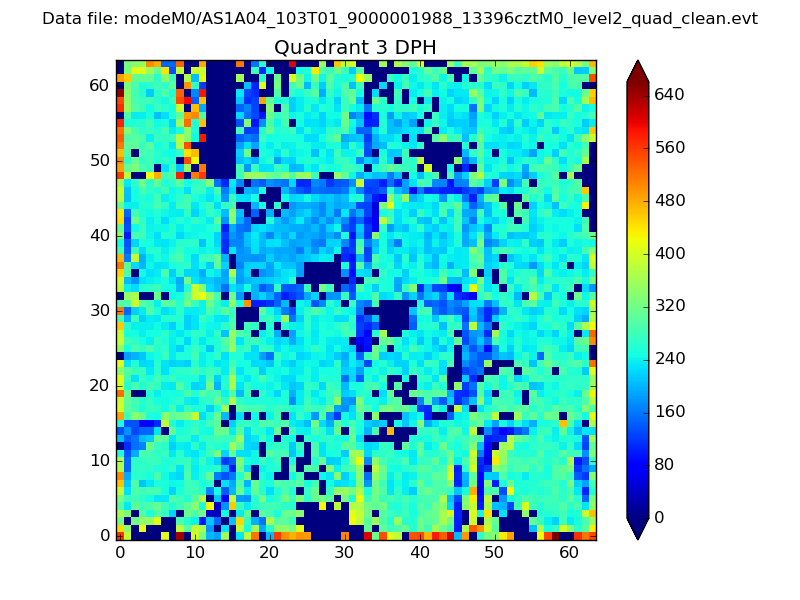 |
 |
Quadrant C |
| Plot type | Count rate plots | Images |
|---|---|---|
| Comparison with Poisson distribution Blue bars denote a histogram of data divided into 1 sec bins. Red curve is a Poisson curve with rate = median count rate of data. |
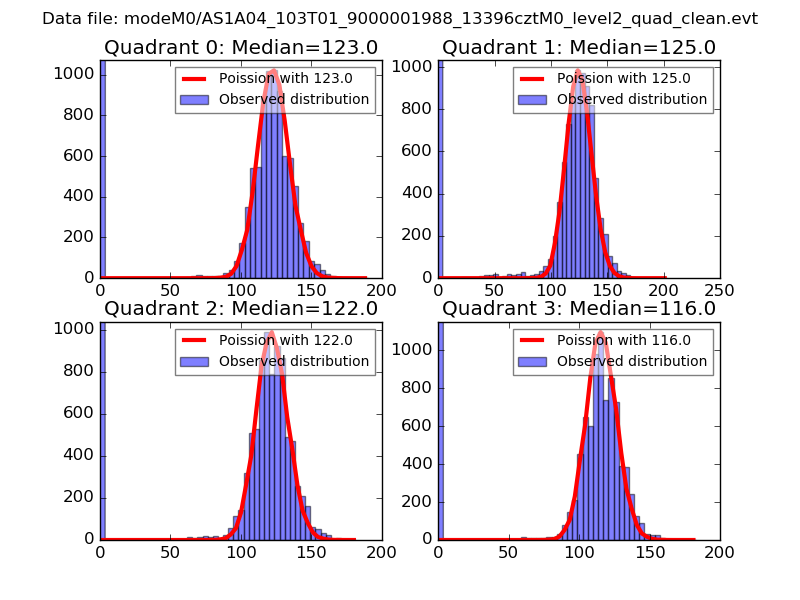 |
 |
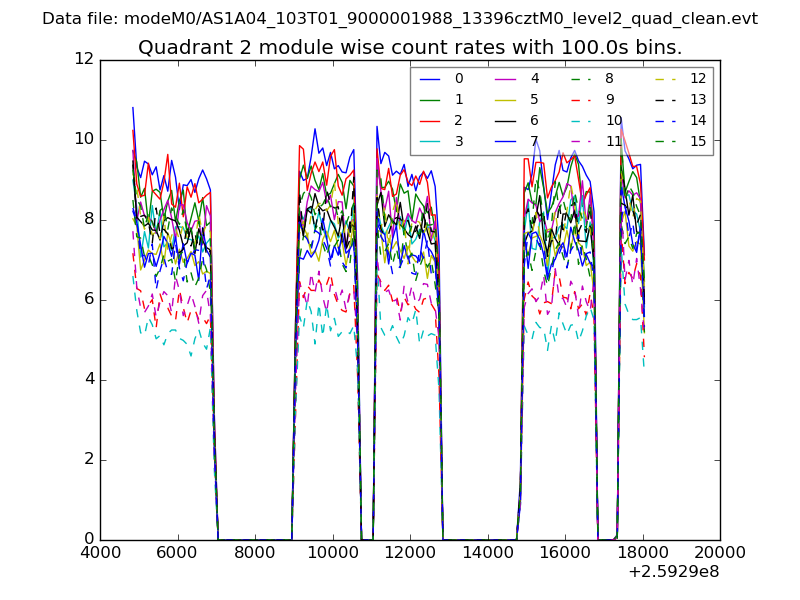
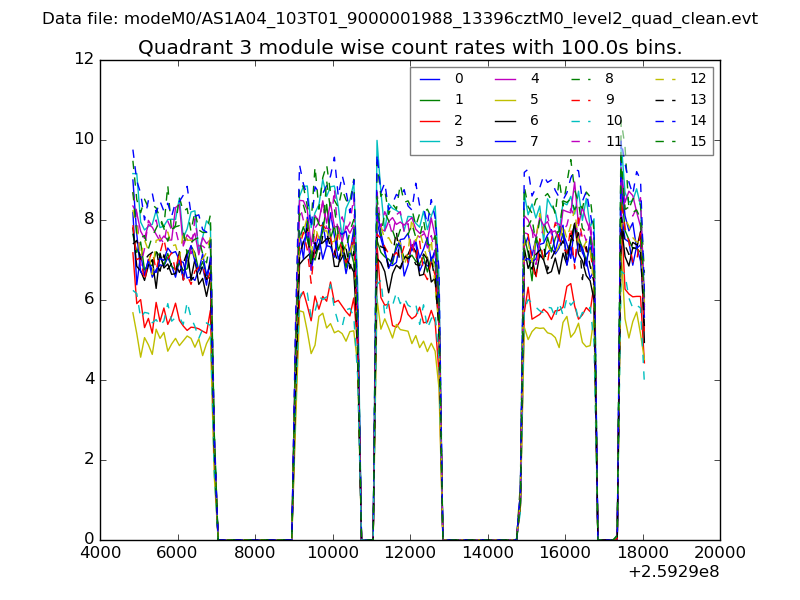
| Quadrant-wise count rates Data is divided into 100 sec bins |
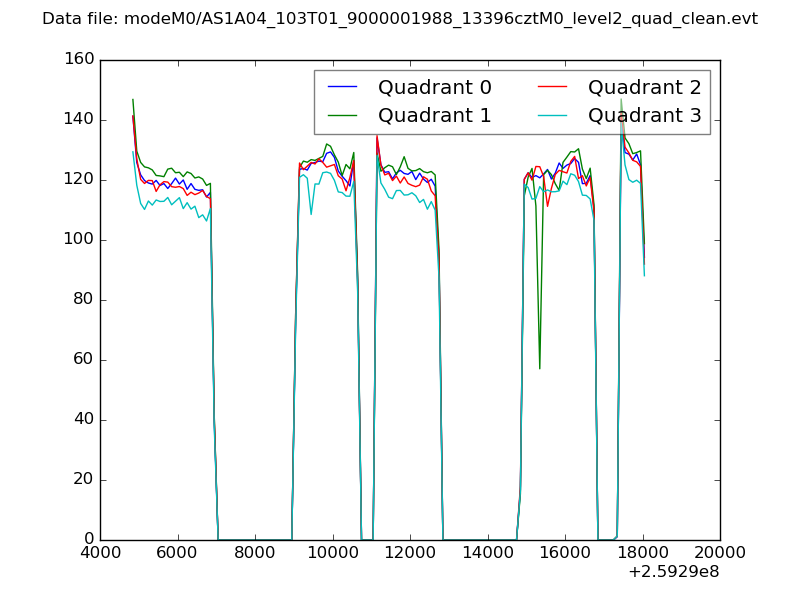 |
|
| Module-wise count rates for Quadrant A Data is divided into 100 sec bins |
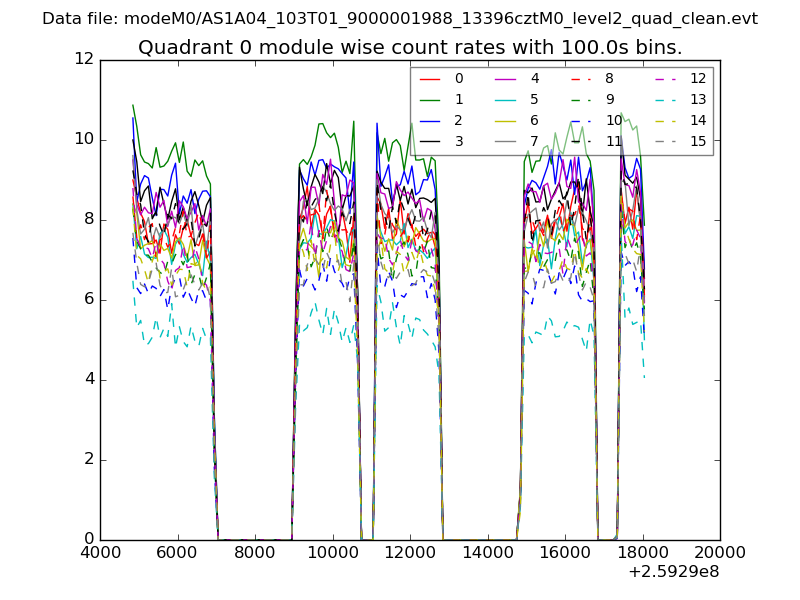 |
 |
| Module-wise count rates for Quadrant B Data is divided into 100 sec bins |
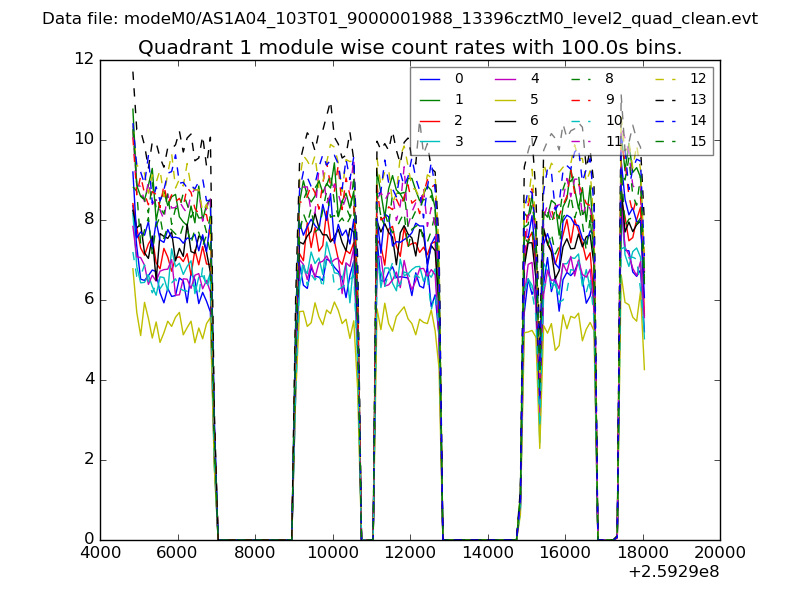 |
 |
| Module-wise count rates for Quadrant C Data is divided into 100 sec bins |
 |
 |
| Module-wise count rates for Quadrant D Data is divided into 100 sec bins |
 |
 |
| Parameter | Plot |
|---|---|
| CZT HV Monitor |  |
| D_VDD | 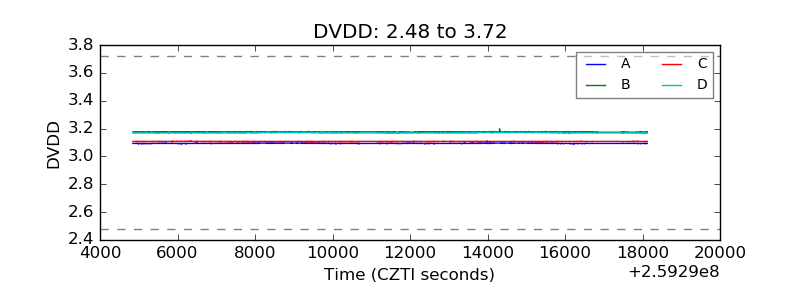 |
| Temperature 1 | 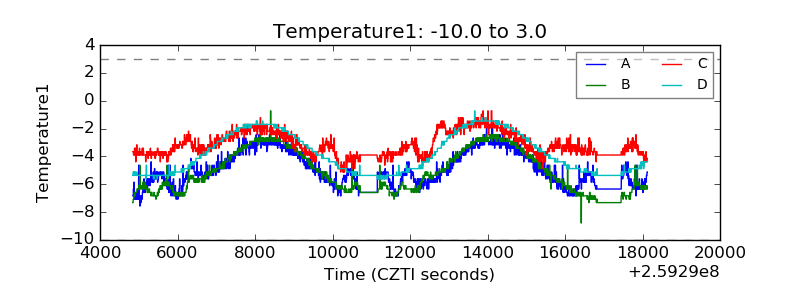 |
| Veto HV Monitor | 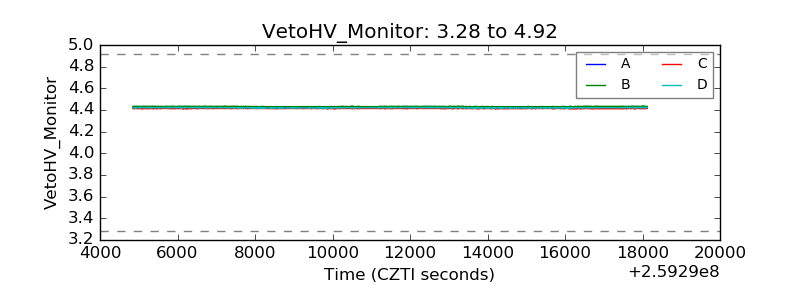 |
| Veto LLD | 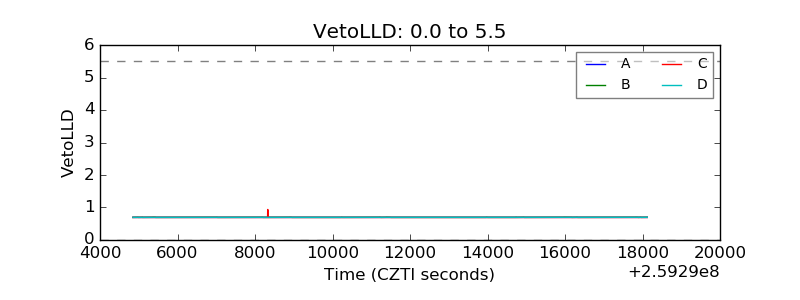 |
| Alpha Counter | 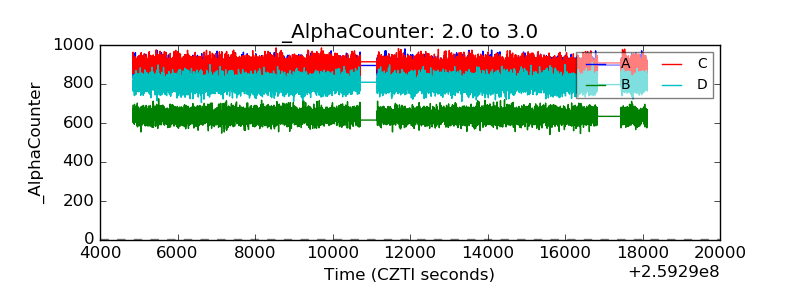 |
| _CPM_Rate | 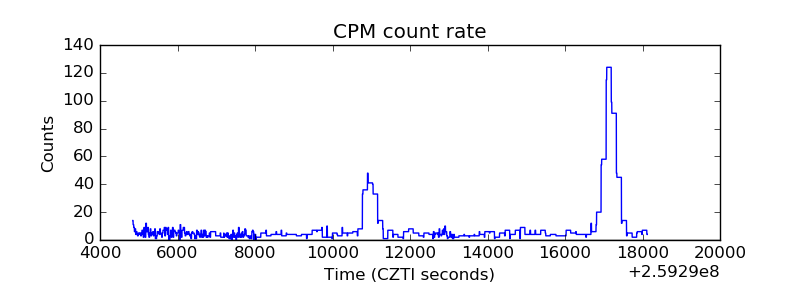 |
| CZT Counter | 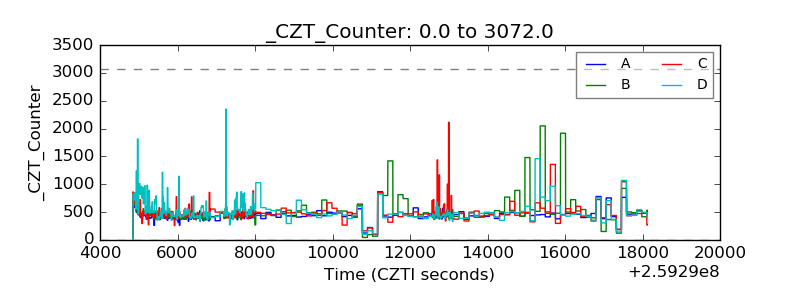 |
| +2.5 Volts monitor |  |
| +5 Volts monitor |  |
| _ROLL_ROT | 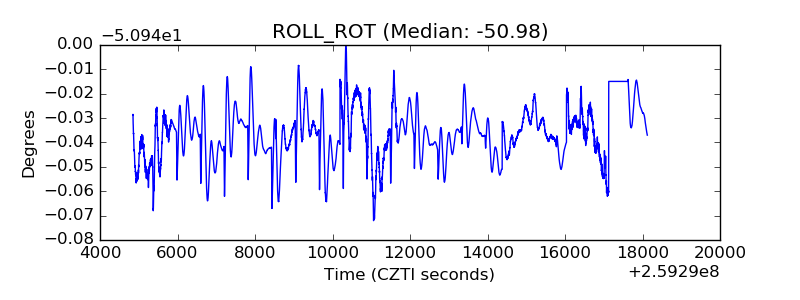 |
| _Roll_DEC | 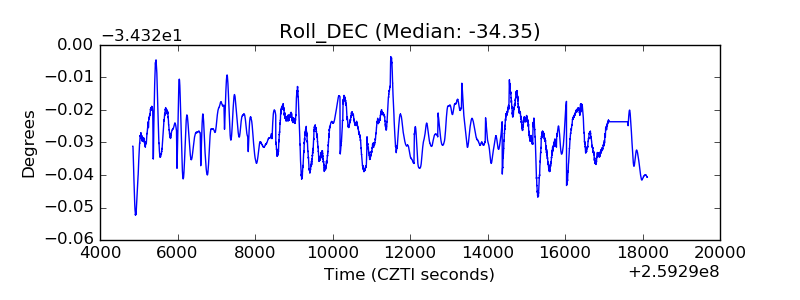 |
| _Roll_RA | 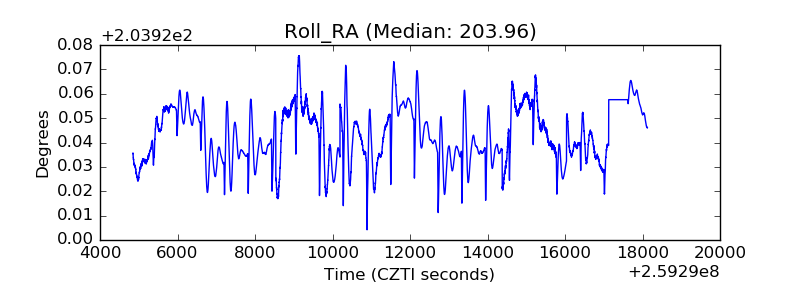 |
| Veto Counter | 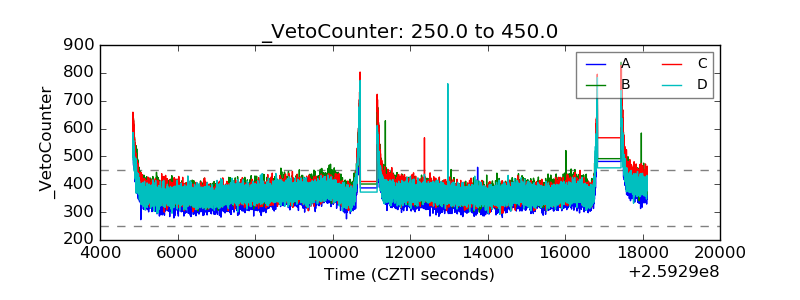 |