| Param | Original file | Final file |
|---|---|---|
| Filename | modeM0/AS1A04_103T01_9000001988_13397cztM0_level2.evt | modeM0/AS1A04_103T01_9000001988_13397cztM0_level2_quad_clean.evt |
| Size (bytes) | 442,238,400 | 76,752,000 |
| Size | 421.8 MB | 73.2 MB |
| Events in quadrant A | 3,047,049 | 468,437 |
| Events in quadrant B | 3,208,789 | 479,947 |
| Events in quadrant C | 3,480,342 | 465,807 |
| Events in quadrant D | 3,206,953 | 448,270 |
| Mode M0 | |||
|---|---|---|---|
| Quadrant | BADHDUFLAG | Total packets | Discarded packets |
| A | 0 | 13444 | 2 |
| B | 0 | 13730 | 1 |
| C | 0 | 14598 | 1 |
| D | 0 | 13906 | 1 |
| Mode SS | |||
|---|---|---|---|
| Quadrant | BADHDUFLAG | Total packets | Discarded packets |
| A | 0 | 134 | 0 |
| B | 0 | 134 | 0 |
| C | 0 | 134 | 0 |
| D | 0 | 134 | 0 |
| Mode M9 | |||
|---|---|---|---|
| Quadrant | BADHDUFLAG | Total packets | Discarded packets |
| A | 0 | 8 | 0 |
| B | 0 | 8 | 0 |
| C | 0 | 8 | 0 |
| D | 0 | 8 | 0 |
| Quadrant | Total seconds | Saturated seconds | Saturation percentage |
|---|---|---|---|
| A | 6621 | 65 | 0.981725% |
| B | 6621 | 88 | 1.329104% |
| C | 6621 | 102 | 1.540553% |
| D | 6621 | 58 | 0.876001% |
Noise dominated data is calculated using 1-second bins in cleaned event files. If a bin has >2000 counts, and if more than 50% of those come from <1% of pixels, then it is considered to be noise-dominated and hence unusable.
| Quadrant | # 1 sec bins | Bins with >0 counts | Bins with >2000 counts | High rate bins dominated by noise | Noise dominated (total time) | Noise dominated (detector-on time) | Marked lightcurve |
|---|---|---|---|---|---|---|---|
| A | 7407 | 6622 | 0 | 0 | 0.00% | 0.00% | 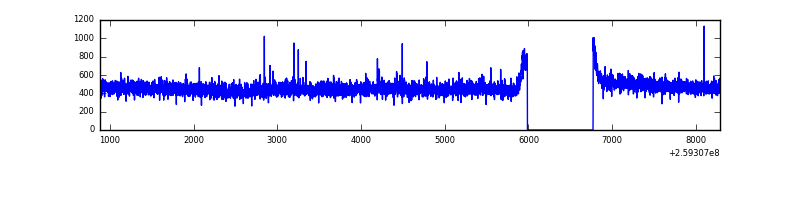 |
| B | 7407 | 6622 | 11 | 11 | 0.15% | 0.17% | 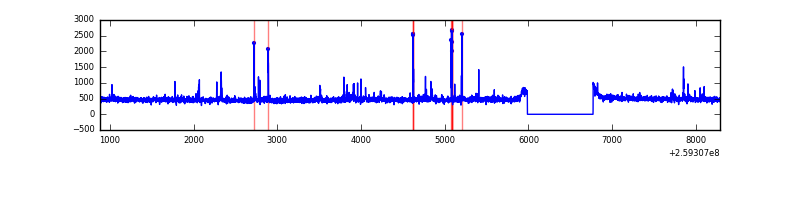 |
| C | 7407 | 6622 | 34 | 34 | 0.46% | 0.51% | 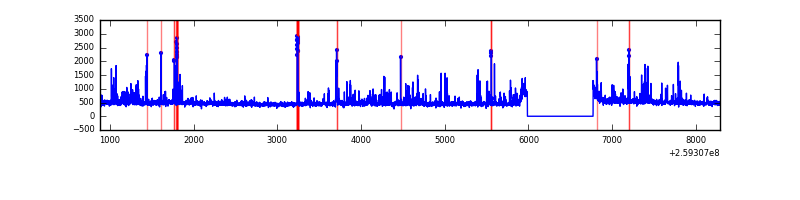 |
| D | 7407 | 6622 | 0 | 0 | 0.00% | 0.00% | 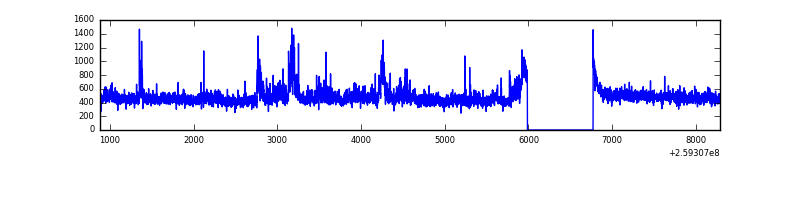 |
Top three noisy pixels from each quadrant. If the there are fewer than three noisy pixels in the level2.evt file, extra rows are filled as -1
| Pixel properties | Quadrant properties | ||||||
|---|---|---|---|---|---|---|---|
| Quadrant | DetID | PixID | Counts | Sigma | Mean | Median | Sigma |
| A | 1 | 162 | 13117 | 77.38 | 786 | 768 | 159.6 |
| A | 15 | 69 | 8594 | 49.04 | 786 | 768 | 159.6 |
| A | 0 | 226 | 7056 | 39.4 | 786 | 768 | 159.6 |
| B | 3 | 64 | 41963 | 273.71 | 788 | 770 | 150.5 |
| B | 3 | 209 | 23773 | 152.85 | 788 | 770 | 150.5 |
| B | 10 | 245 | 19974 | 127.6 | 788 | 770 | 150.5 |
| C | 14 | 220 | 356993 | 1990.27 | 769 | 773 | 179.0 |
| C | 3 | 233 | 73808 | 408.06 | 769 | 773 | 179.0 |
| C | 14 | 234 | 49950 | 274.76 | 769 | 773 | 179.0 |
| D | 8 | 195 | 224018 | 1213.31 | 767 | 744 | 184.0 |
| D | 5 | 222 | 35340 | 188.0 | 767 | 744 | 184.0 |
| D | 2 | 234 | 22460 | 118.01 | 767 | 744 | 184.0 |
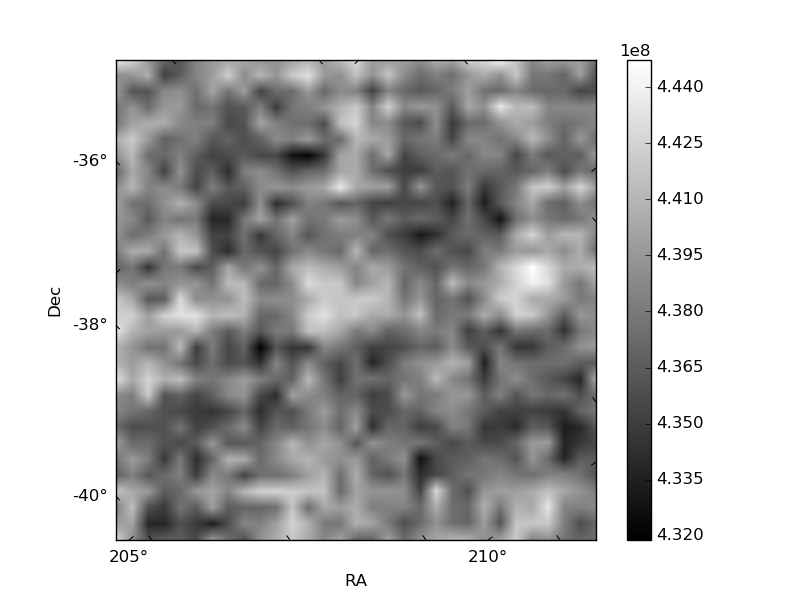
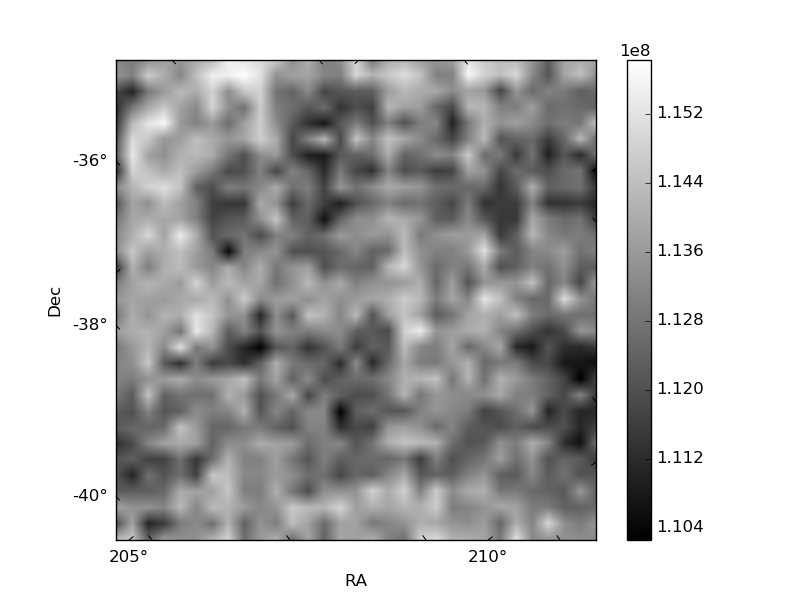
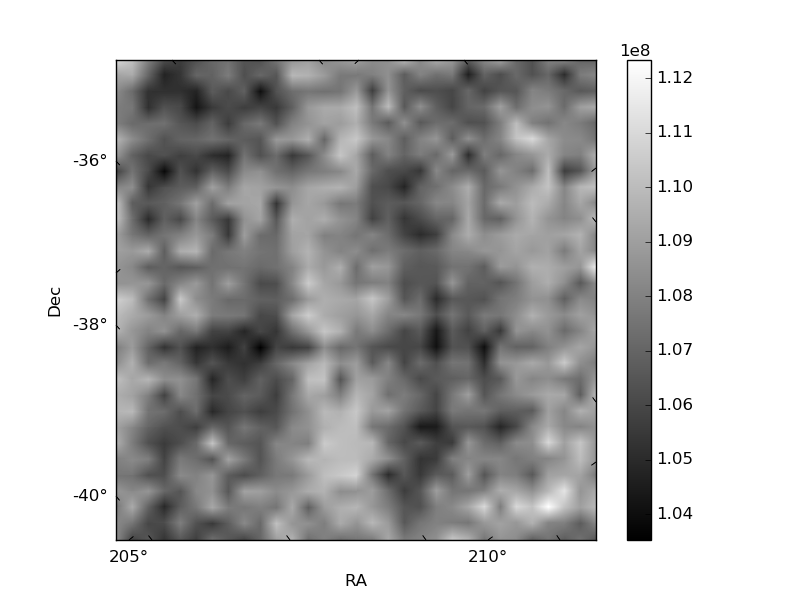
Histogram calculated using DETX and DETY for each event in the final _common_clean file
| Quadrant A | 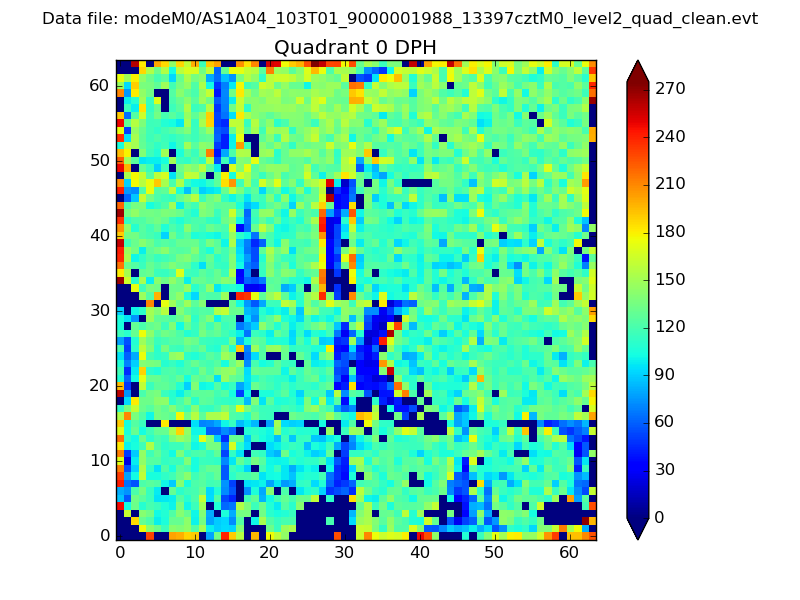 |
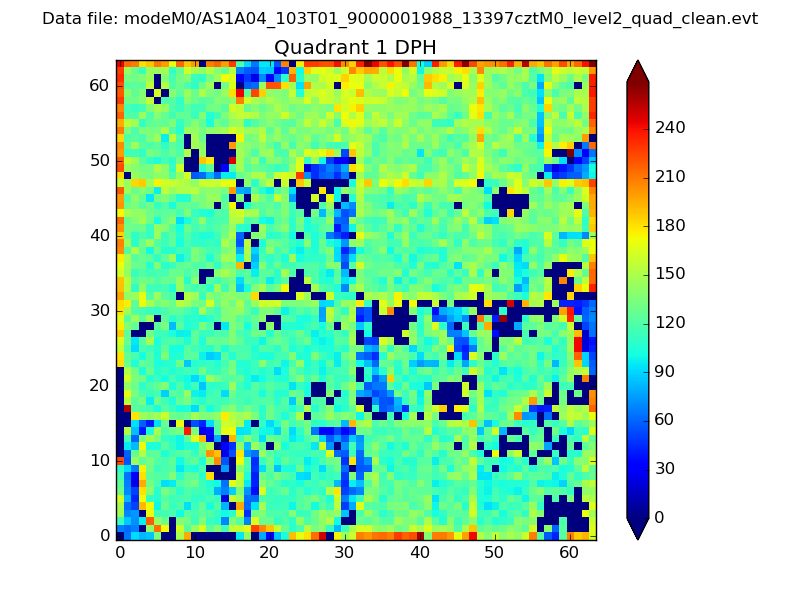 |
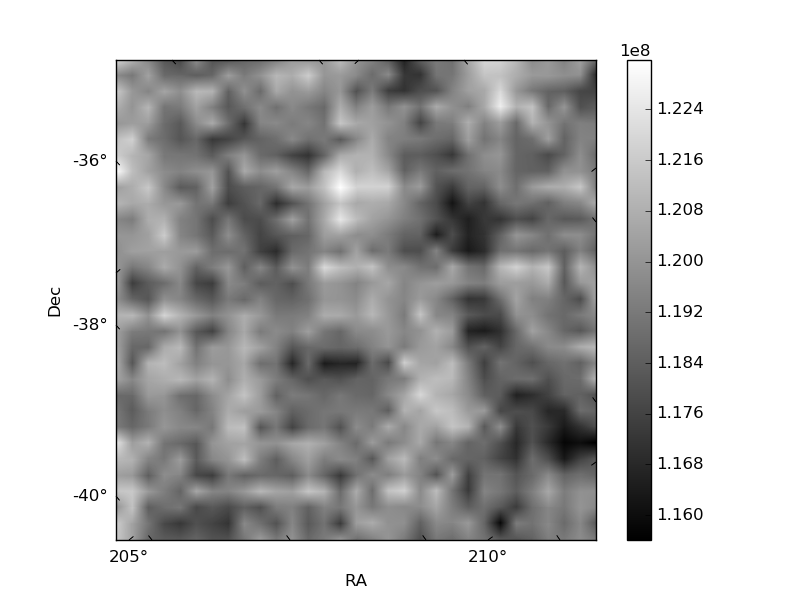
Quadrant B |
|---|---|---|---|
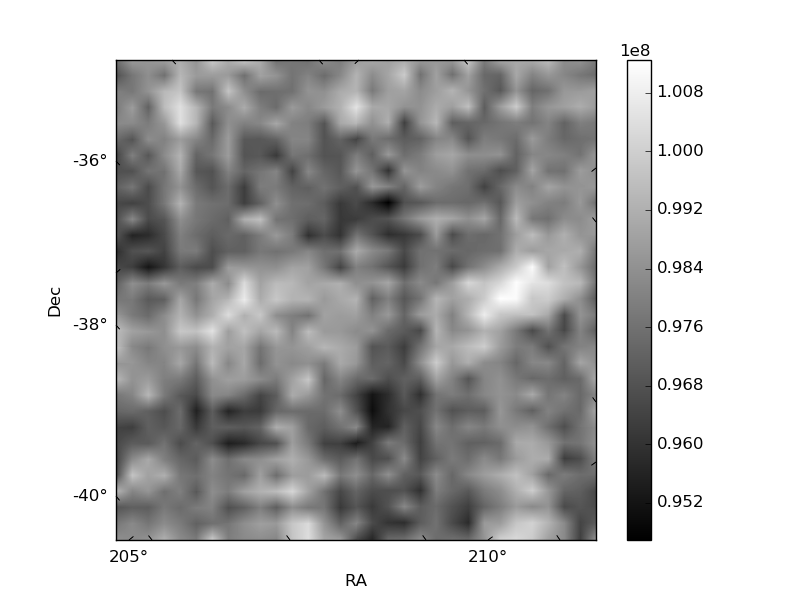
| Quadrant D | 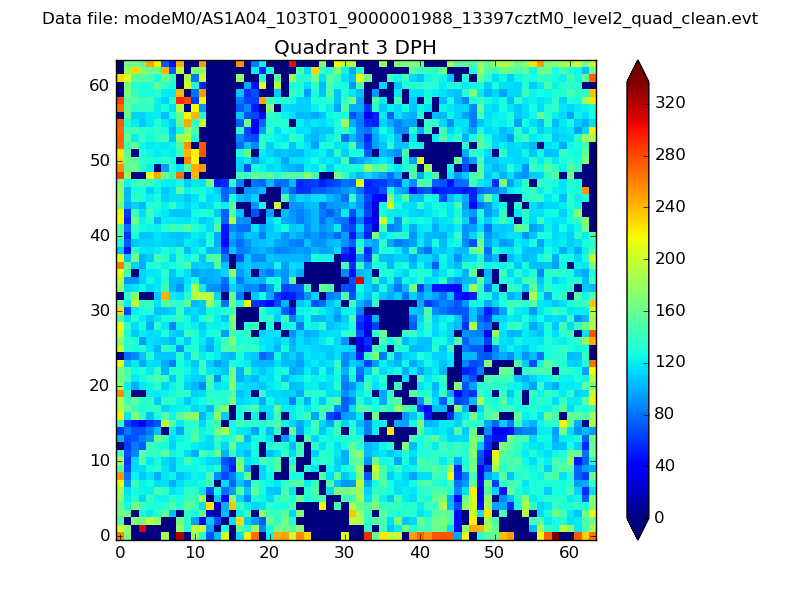 |
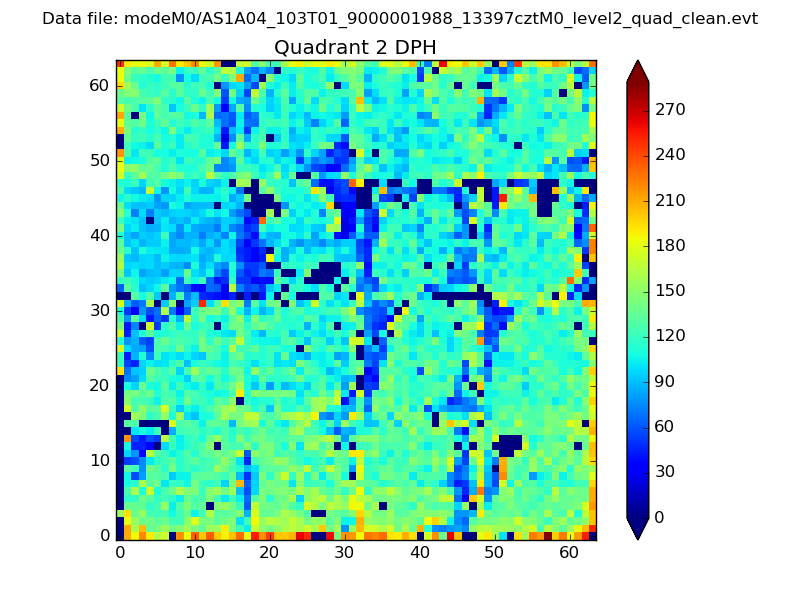 |
Quadrant C |
| Plot type | Count rate plots | Images |
|---|---|---|
| Comparison with Poisson distribution Blue bars denote a histogram of data divided into 1 sec bins. Red curve is a Poisson curve with rate = median count rate of data. |
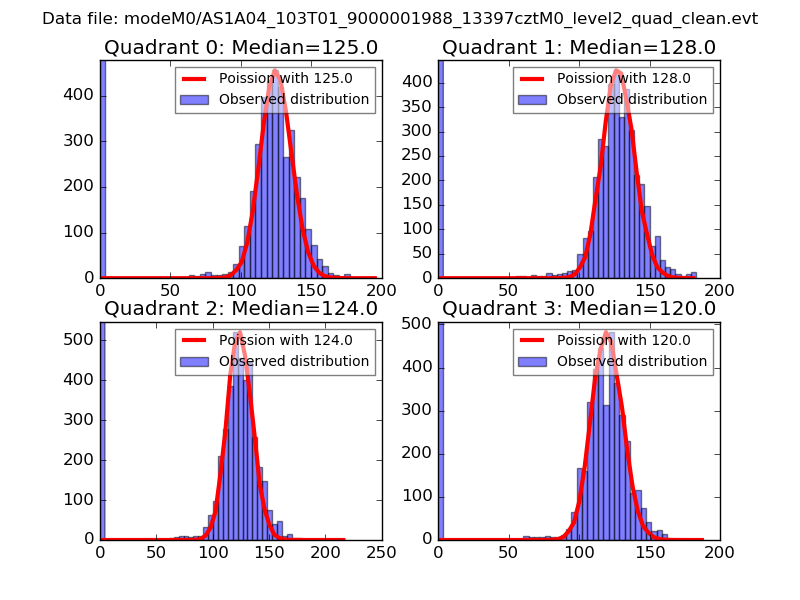 |
 |
| Quadrant-wise count rates Data is divided into 100 sec bins |
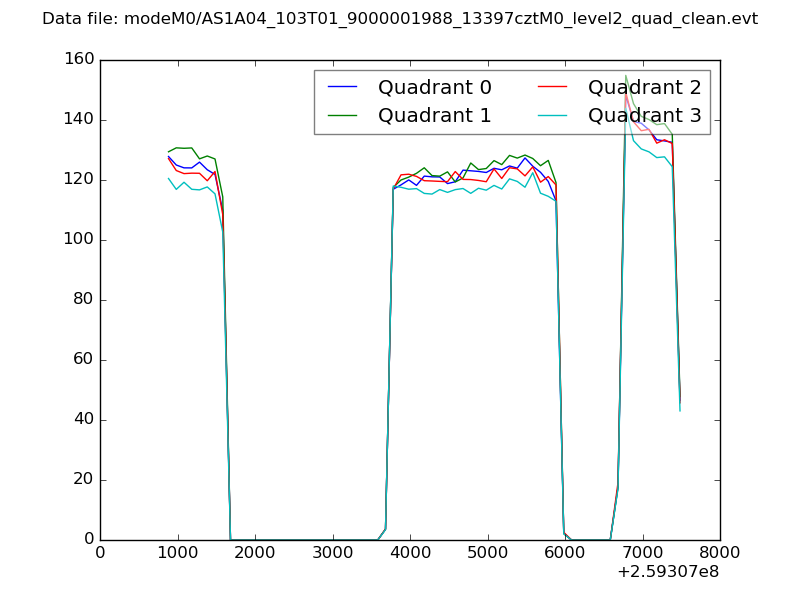 |
|
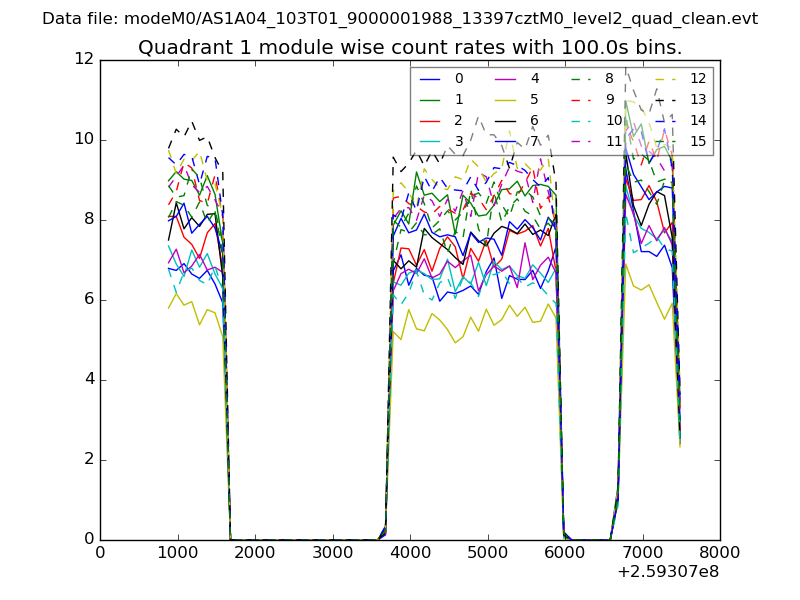
| Module-wise count rates for Quadrant A Data is divided into 100 sec bins |
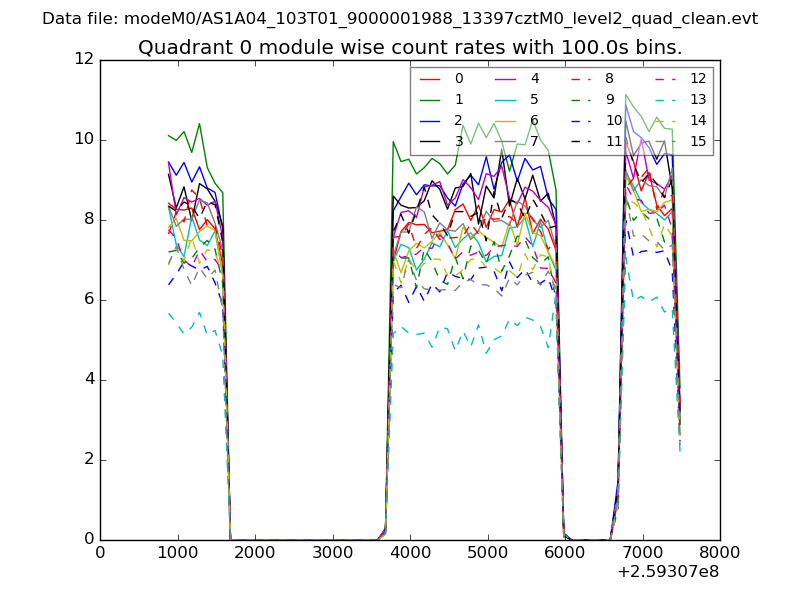 |
 |
| Module-wise count rates for Quadrant B Data is divided into 100 sec bins |
 |
 |
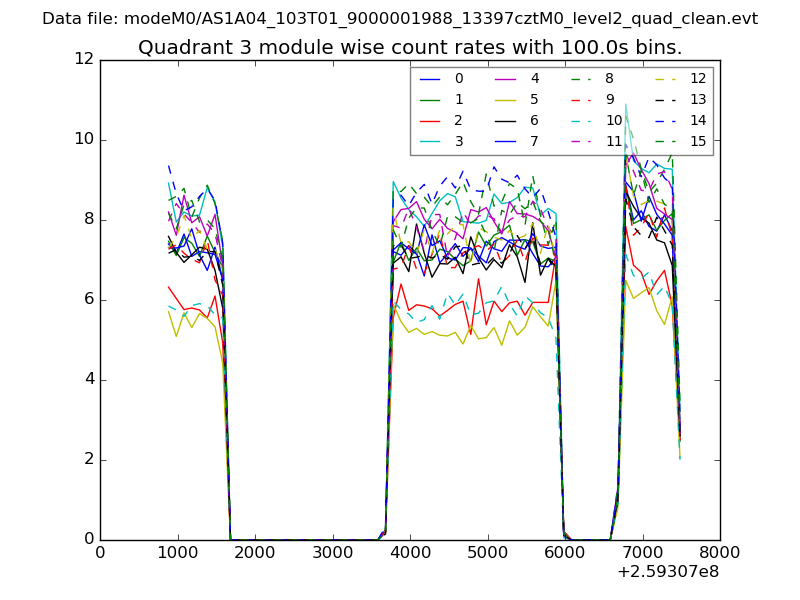
| Module-wise count rates for Quadrant C Data is divided into 100 sec bins |
 |
 |
| Module-wise count rates for Quadrant D Data is divided into 100 sec bins |
 |
 |
| Parameter | Plot |
|---|---|
| CZT HV Monitor | 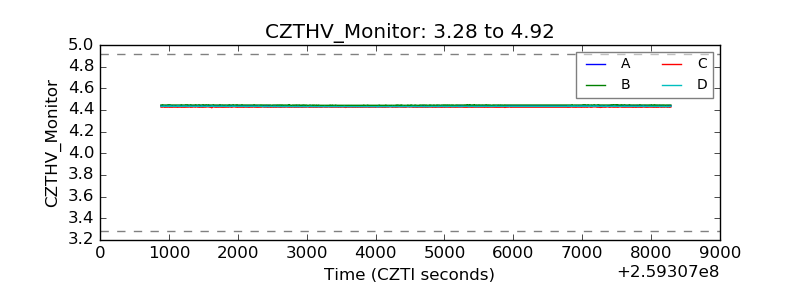 |
| D_VDD | 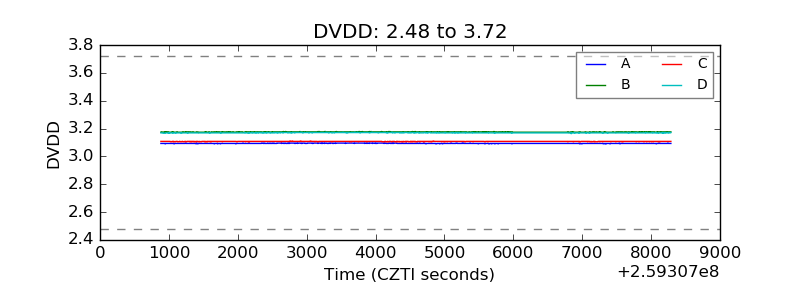 |
| Temperature 1 |  |
| Veto HV Monitor | 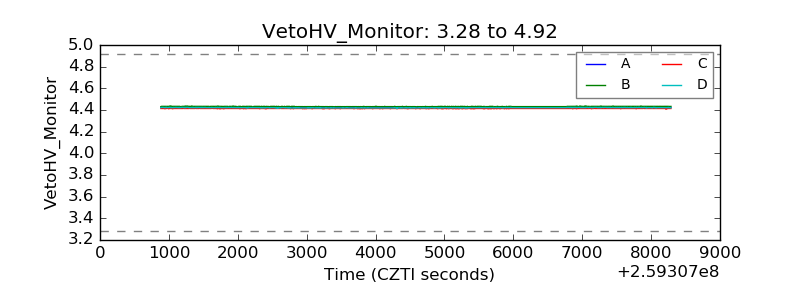 |
| Veto LLD | 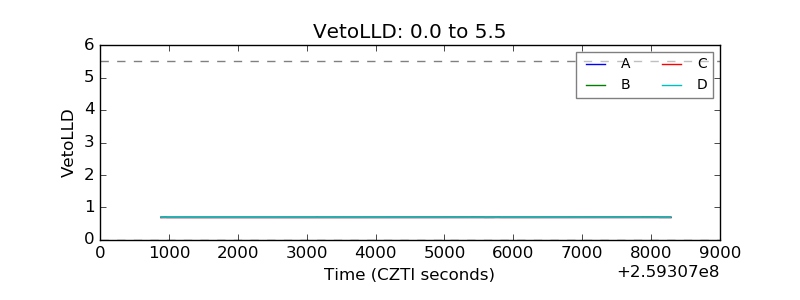 |
| Alpha Counter | 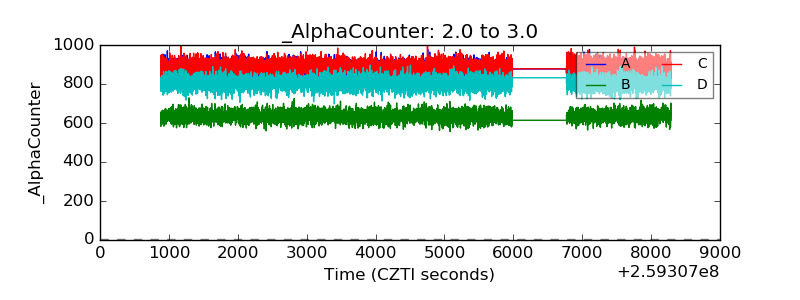 |
| _CPM_Rate | 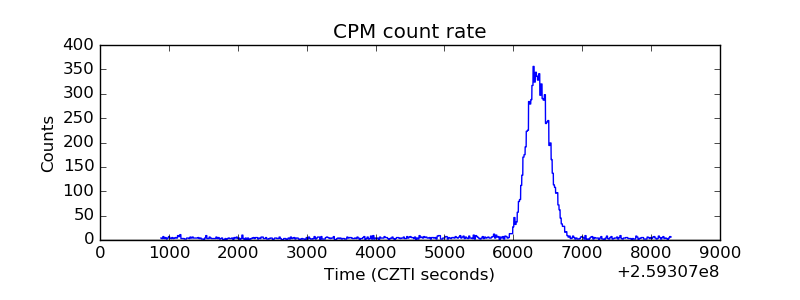 |
| CZT Counter | 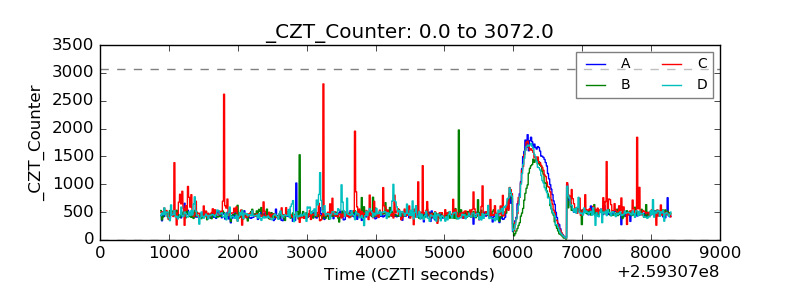 |
| +2.5 Volts monitor |  |
| +5 Volts monitor |  |
| _ROLL_ROT | 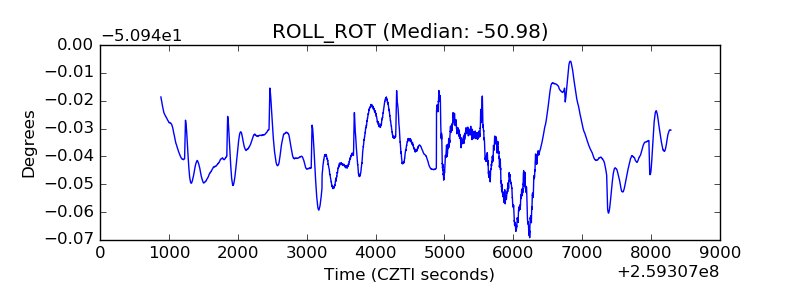 |
| _Roll_DEC |  |
| _Roll_RA | 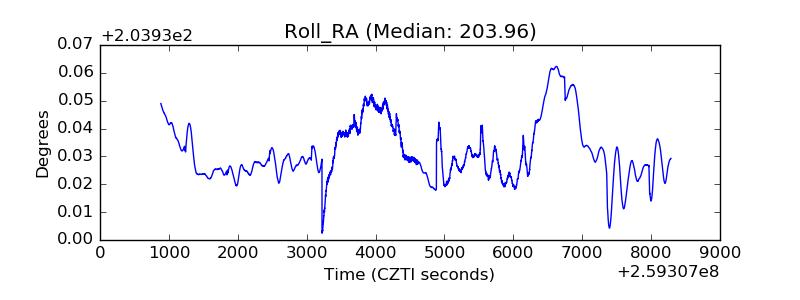 |
| Veto Counter | 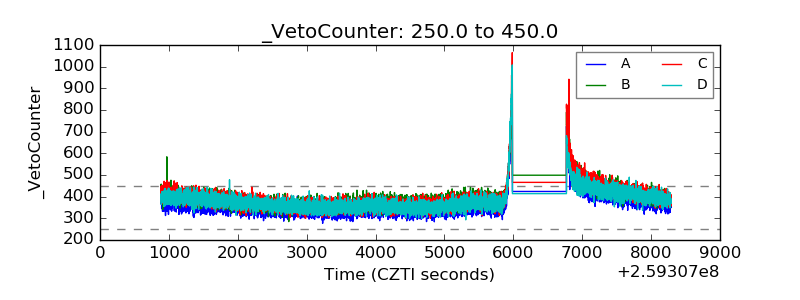 |