| Param | Original file | Final file |
|---|---|---|
| Filename | modeM0/AS1A04_103T01_9000001988_13398cztM0_level2.evt | modeM0/AS1A04_103T01_9000001988_13398cztM0_level2_quad_clean.evt |
| Size (bytes) | 453,980,160 | 74,923,200 |
| Size | 432.9 MB | 71.5 MB |
| Events in quadrant A | 3,211,646 | 451,782 |
| Events in quadrant B | 3,400,012 | 460,204 |
| Events in quadrant C | 3,430,023 | 452,148 |
| Events in quadrant D | 3,247,871 | 433,622 |
| Mode M0 | |||
|---|---|---|---|
| Quadrant | BADHDUFLAG | Total packets | Discarded packets |
| A | 0 | 13908 | 3 |
| B | 0 | 14308 | 2 |
| C | 0 | 14532 | 2 |
| D | 0 | 14098 | 2 |
| Mode SS | |||
|---|---|---|---|
| Quadrant | BADHDUFLAG | Total packets | Discarded packets |
| A | 0 | 138 | 0 |
| B | 0 | 138 | 0 |
| C | 0 | 138 | 0 |
| D | 0 | 138 | 0 |
| Mode M9 | |||
|---|---|---|---|
| Quadrant | BADHDUFLAG | Total packets | Discarded packets |
| A | 0 | 9 | 0 |
| B | 0 | 9 | 0 |
| C | 0 | 9 | 0 |
| D | 0 | 10 | 0 |
| Quadrant | Total seconds | Saturated seconds | Saturation percentage |
|---|---|---|---|
| A | 6753 | 68 | 1.006960% |
| B | 6753 | 85 | 1.258700% |
| C | 6753 | 62 | 0.918110% |
| D | 6753 | 46 | 0.681179% |
Noise dominated data is calculated using 1-second bins in cleaned event files. If a bin has >2000 counts, and if more than 50% of those come from <1% of pixels, then it is considered to be noise-dominated and hence unusable.
| Quadrant | # 1 sec bins | Bins with >0 counts | Bins with >2000 counts | High rate bins dominated by noise | Noise dominated (total time) | Noise dominated (detector-on time) | Marked lightcurve |
|---|---|---|---|---|---|---|---|
| A | 7718 | 6753 | 1 | 1 | 0.01% | 0.01% | 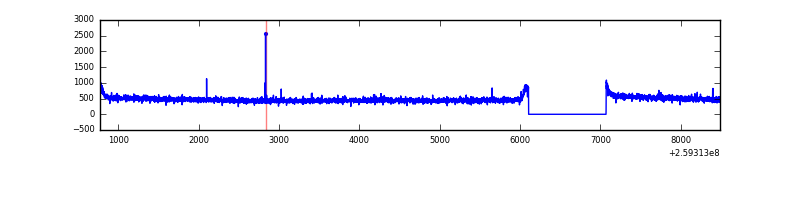 |
| B | 7718 | 6753 | 24 | 24 | 0.31% | 0.36% | 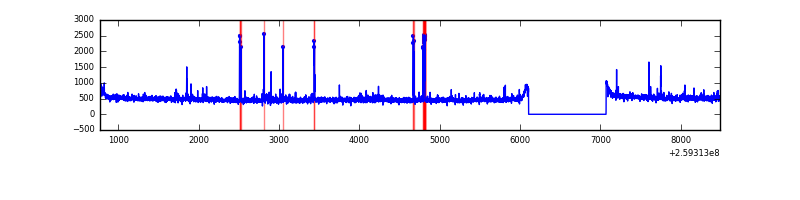 |
| C | 7718 | 6753 | 14 | 14 | 0.18% | 0.21% |  |
| D | 7718 | 6753 | 1 | 1 | 0.01% | 0.01% | 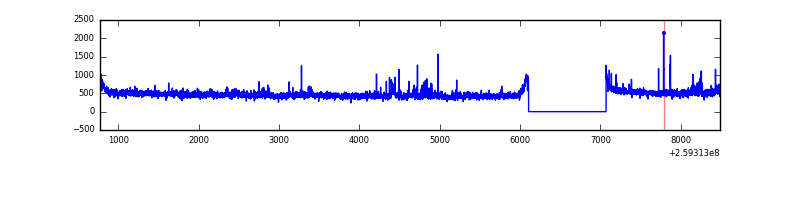 |
Top three noisy pixels from each quadrant. If the there are fewer than three noisy pixels in the level2.evt file, extra rows are filled as -1
| Pixel properties | Quadrant properties | ||||||
|---|---|---|---|---|---|---|---|
| Quadrant | DetID | PixID | Counts | Sigma | Mean | Median | Sigma |
| A | 1 | 162 | 19072 | 108.95 | 826 | 806 | 167.7 |
| A | 15 | 69 | 8144 | 43.77 | 826 | 806 | 167.7 |
| A | 0 | 226 | 7274 | 38.58 | 826 | 806 | 167.7 |
| B | 15 | 33 | 64674 | 404.67 | 825 | 804 | 157.8 |
| B | 3 | 64 | 35354 | 218.9 | 825 | 804 | 157.8 |
| B | 0 | 230 | 23637 | 144.67 | 825 | 804 | 157.8 |
| C | 14 | 220 | 180223 | 965.49 | 808 | 814 | 185.8 |
| C | 3 | 233 | 63556 | 337.65 | 808 | 814 | 185.8 |
| C | 14 | 234 | 36204 | 190.45 | 808 | 814 | 185.8 |
| D | 8 | 195 | 75147 | 385.58 | 804 | 782 | 192.9 |
| D | 1 | 52 | 55475 | 283.58 | 804 | 782 | 192.9 |
| D | 2 | 136 | 50621 | 258.42 | 804 | 782 | 192.9 |
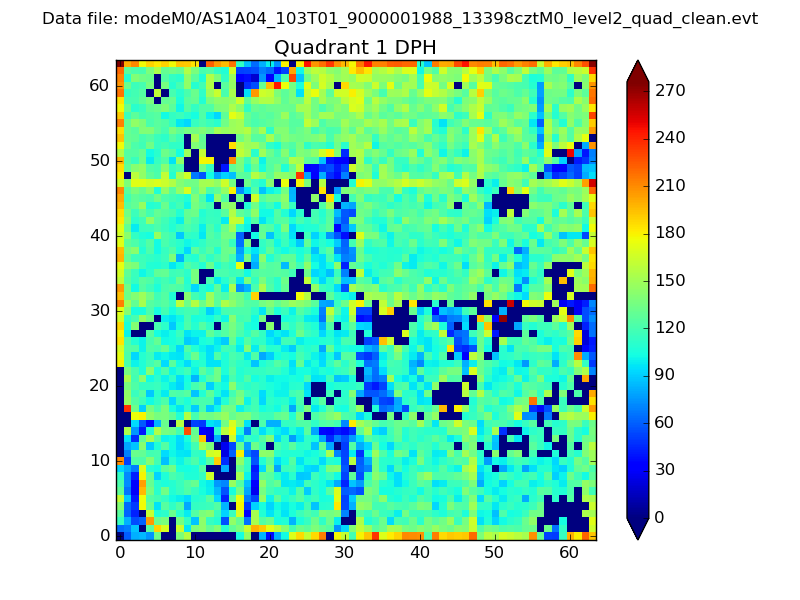
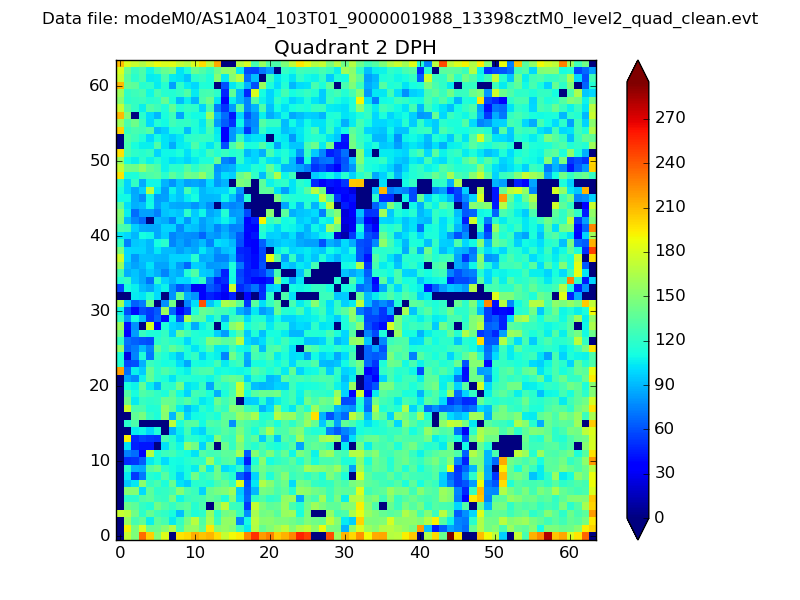
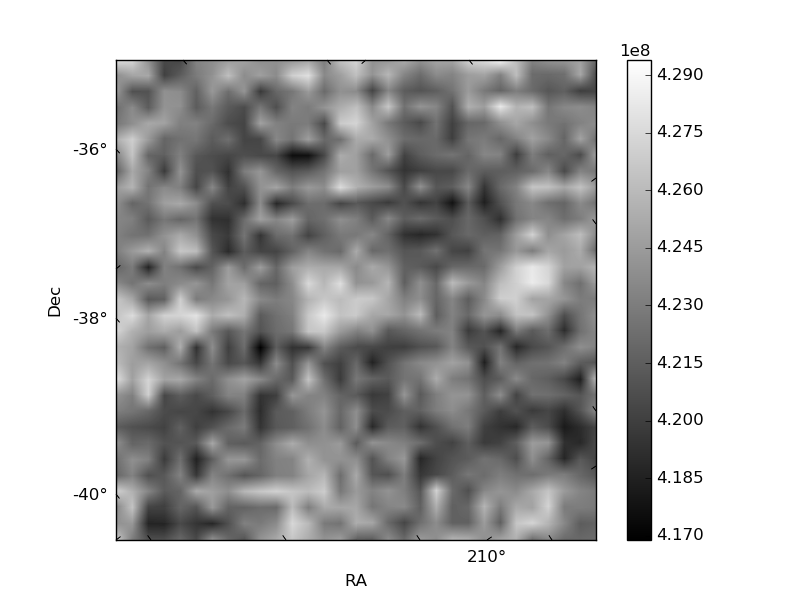
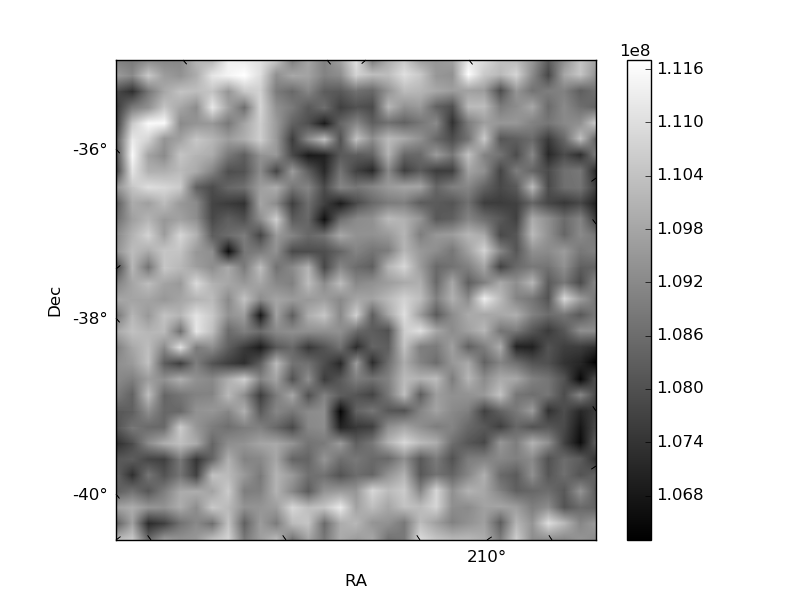
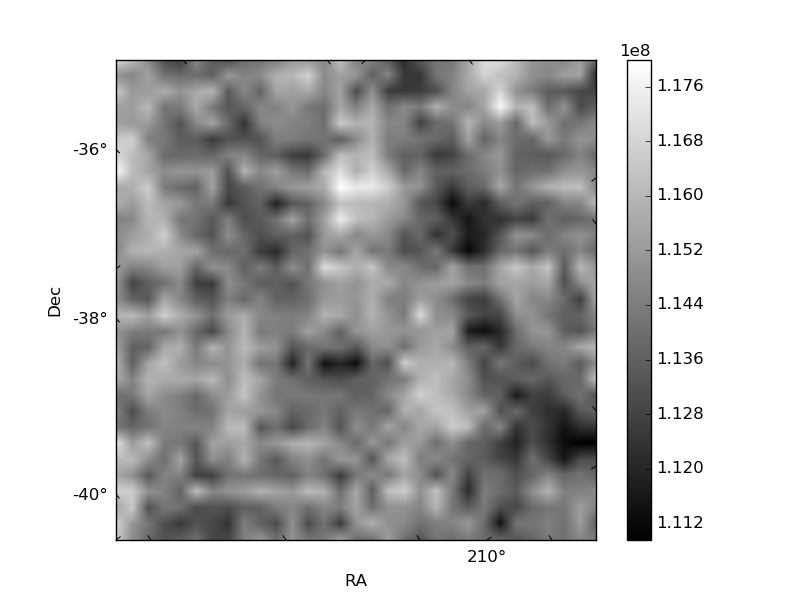
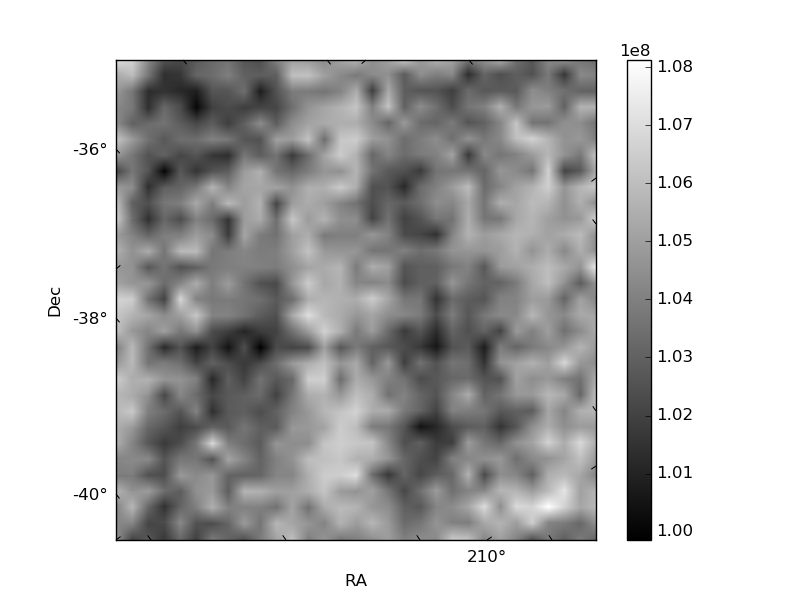
Histogram calculated using DETX and DETY for each event in the final _common_clean file
| Quadrant A | 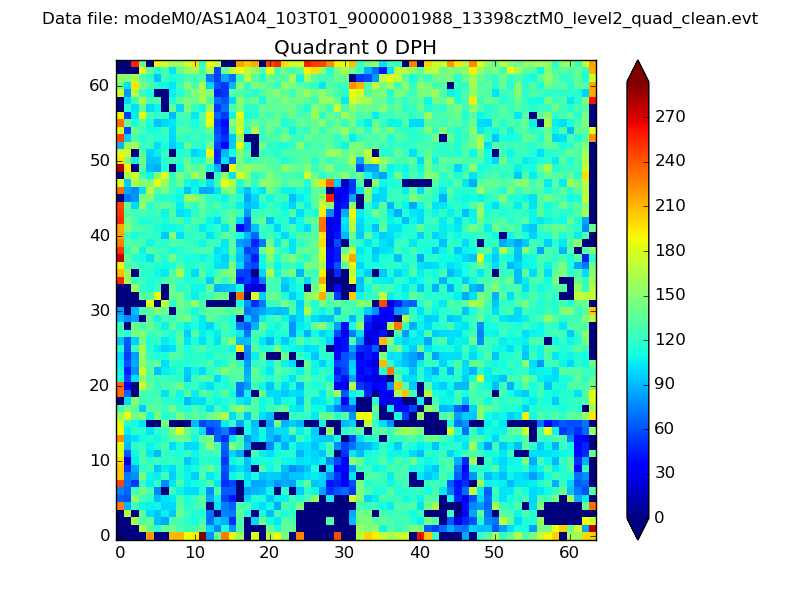 |
 |
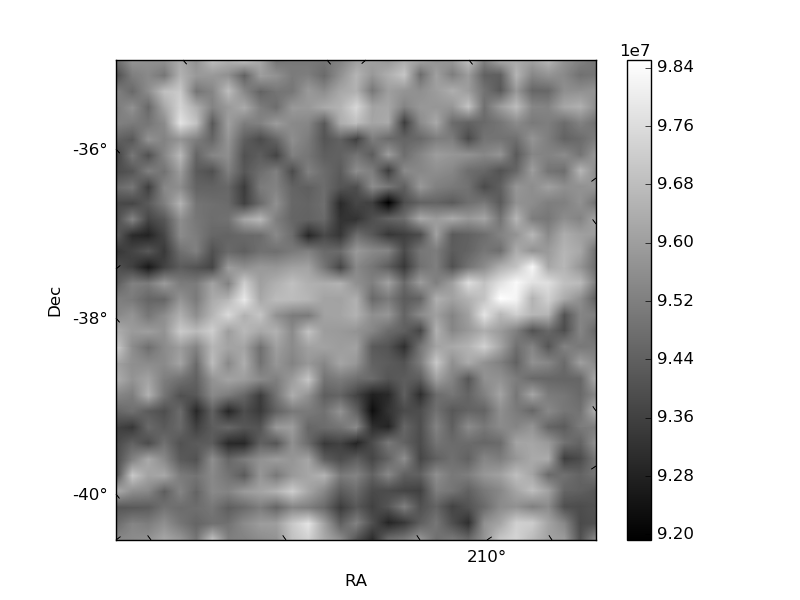
Quadrant B |
|---|---|---|---|
| Quadrant D | 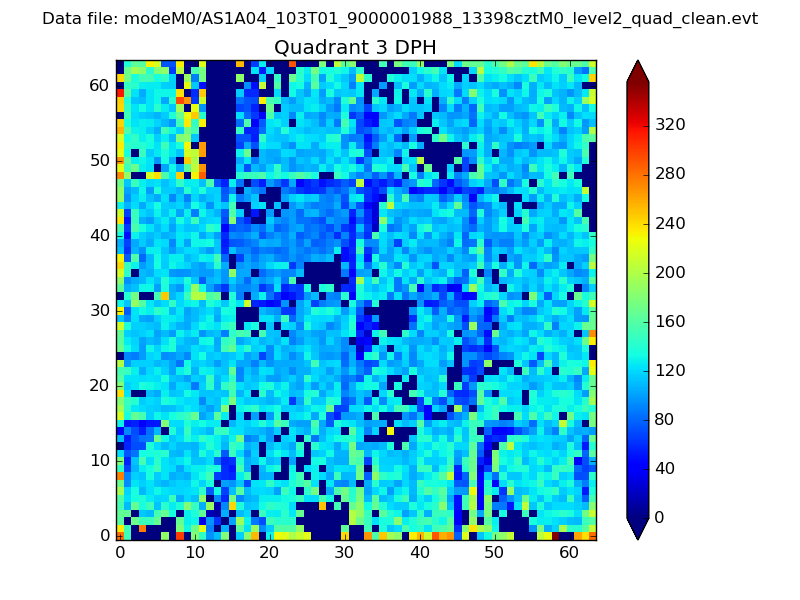 |
 |
Quadrant C |
| Plot type | Count rate plots | Images |
|---|---|---|
| Comparison with Poisson distribution Blue bars denote a histogram of data divided into 1 sec bins. Red curve is a Poisson curve with rate = median count rate of data. |
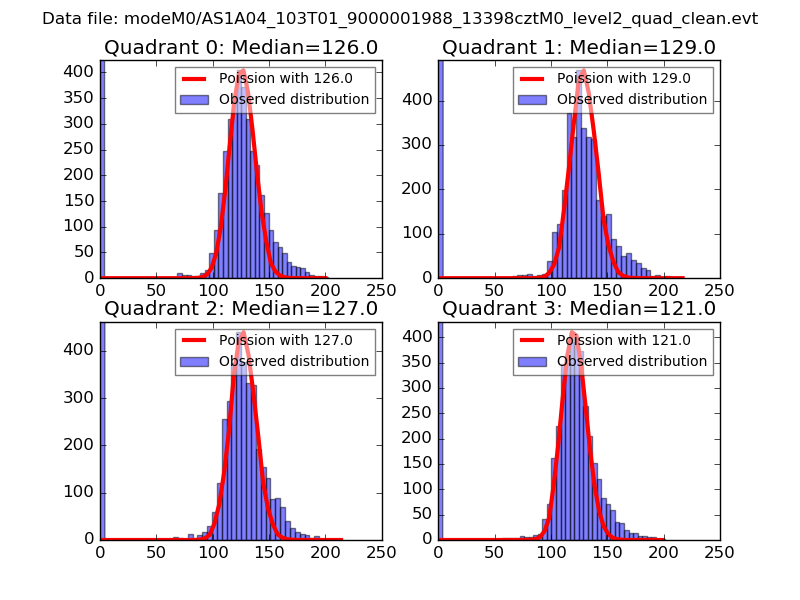 |
 |
| Quadrant-wise count rates Data is divided into 100 sec bins |
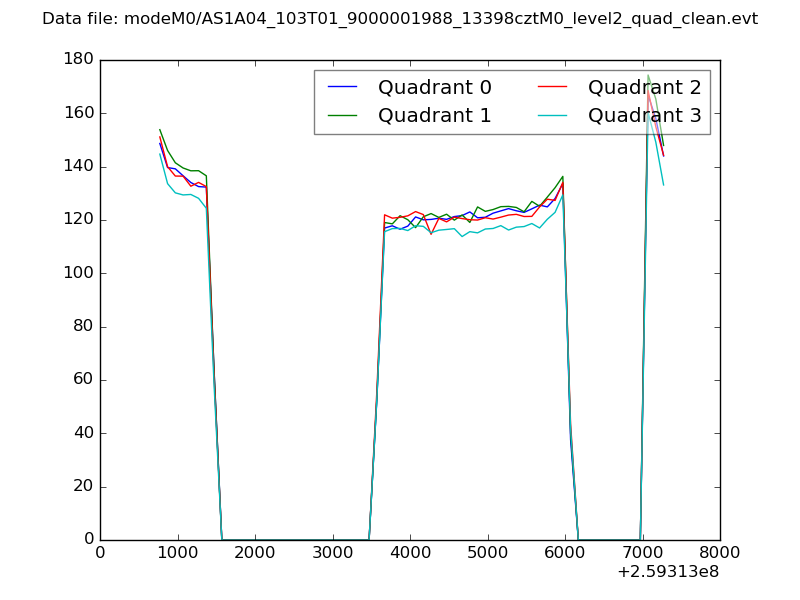 |
|
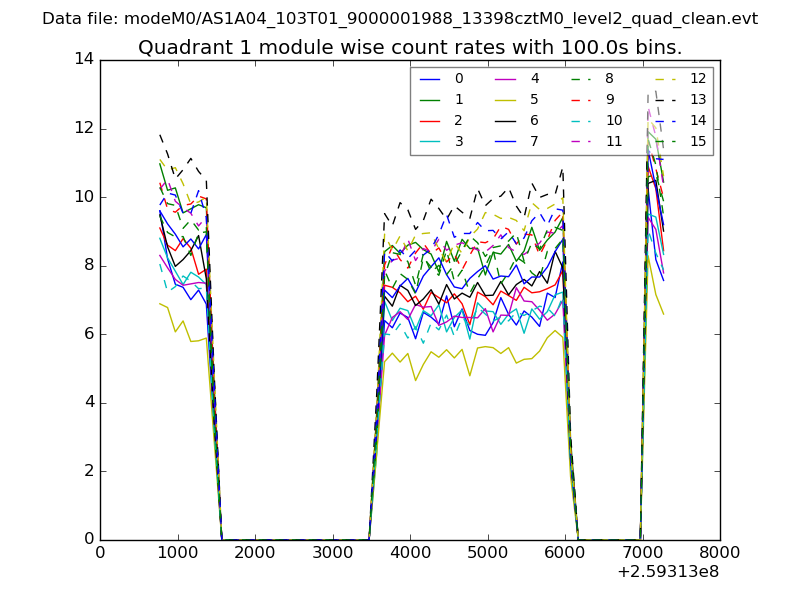
| Module-wise count rates for Quadrant A Data is divided into 100 sec bins |
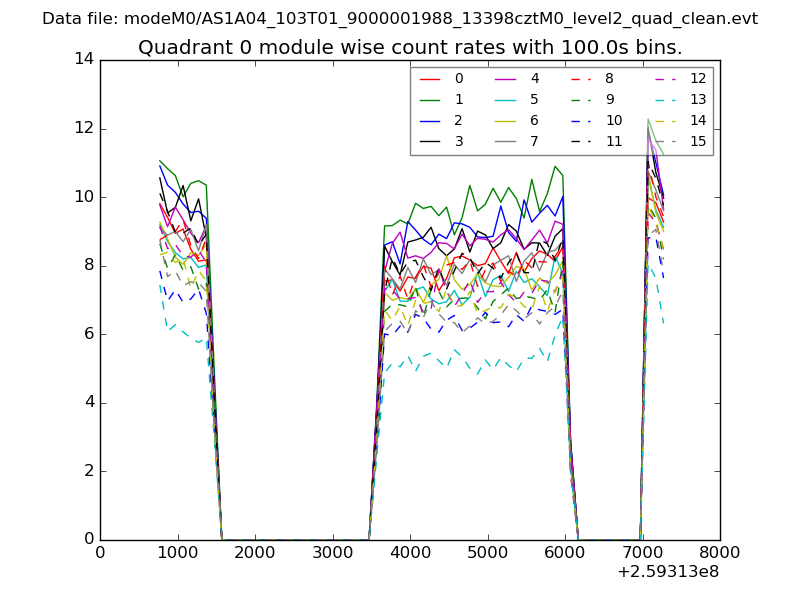 |
 |
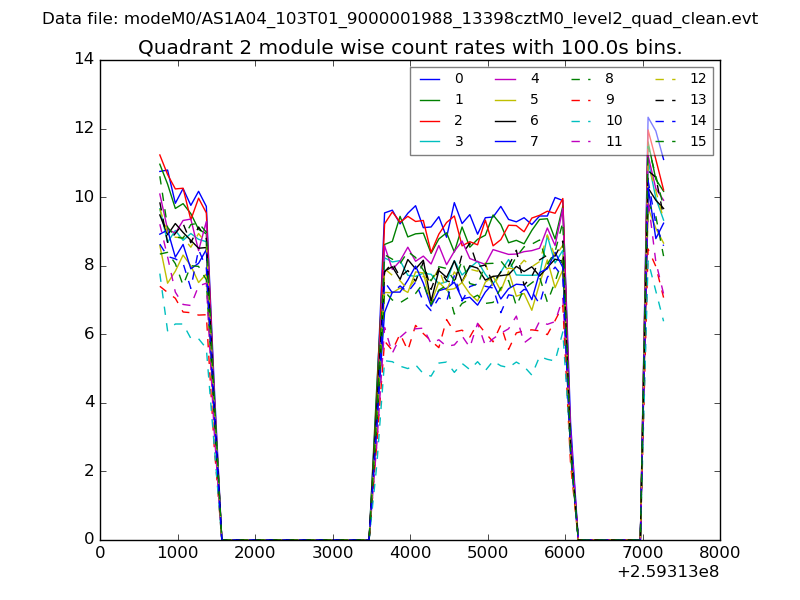
| Module-wise count rates for Quadrant B Data is divided into 100 sec bins |
 |
 |
| Module-wise count rates for Quadrant C Data is divided into 100 sec bins |
 |
 |
| Module-wise count rates for Quadrant D Data is divided into 100 sec bins |
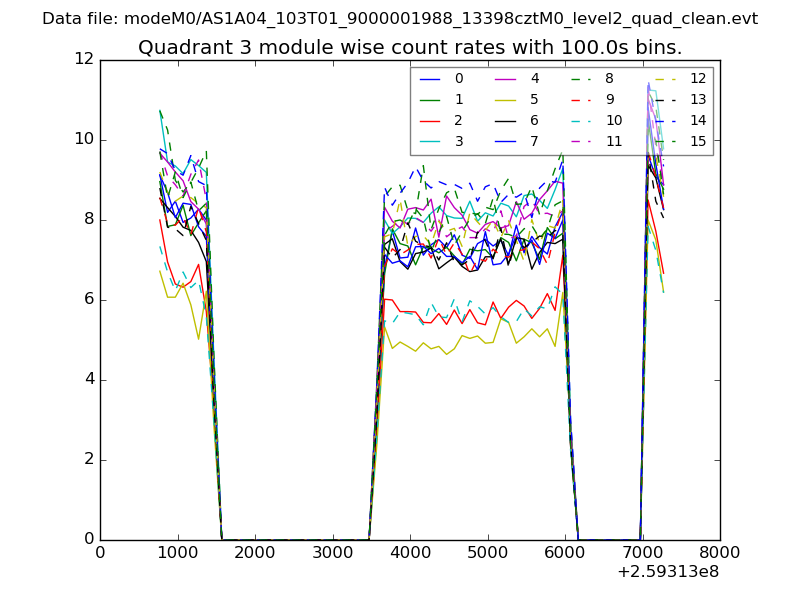 |
 |
| Parameter | Plot |
|---|---|
| CZT HV Monitor | 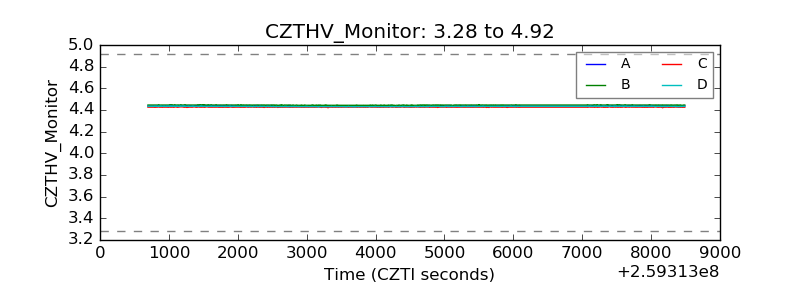 |
| D_VDD | 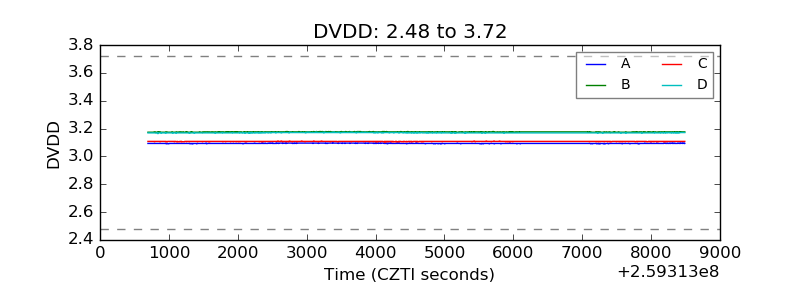 |
| Temperature 1 | 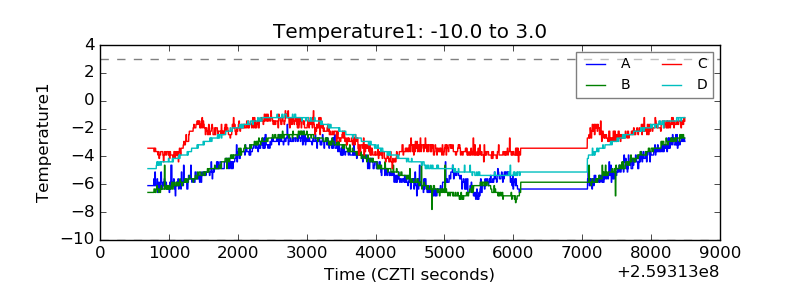 |
| Veto HV Monitor | 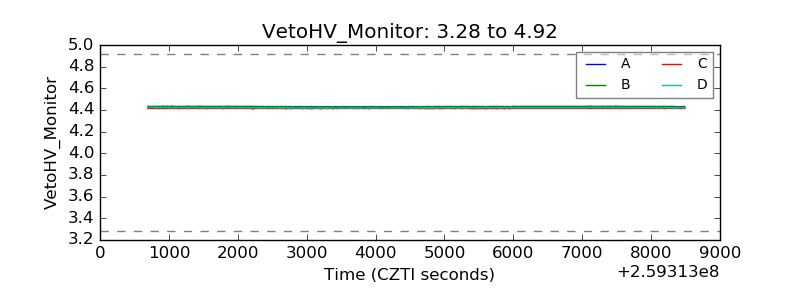 |
| Veto LLD | 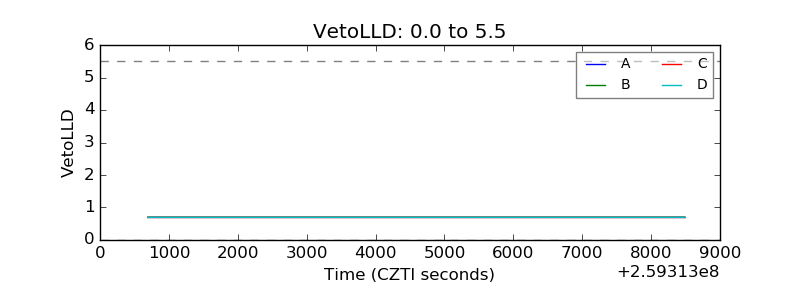 |
| Alpha Counter | 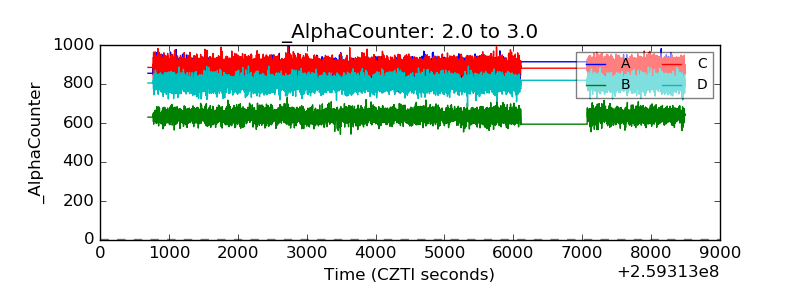 |
| _CPM_Rate | 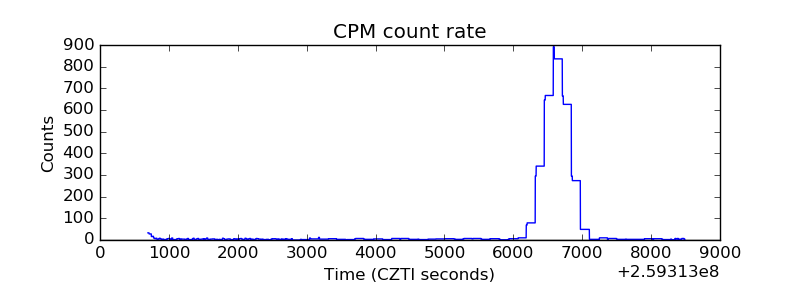 |
| CZT Counter | 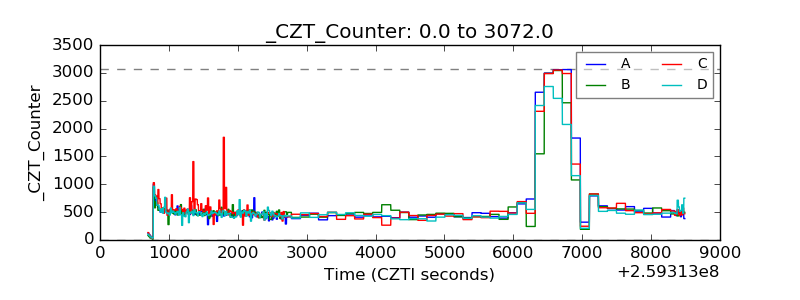 |
| +2.5 Volts monitor |  |
| +5 Volts monitor | 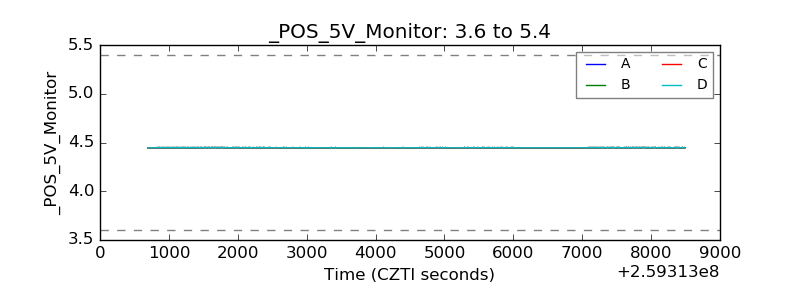 |
| _ROLL_ROT | 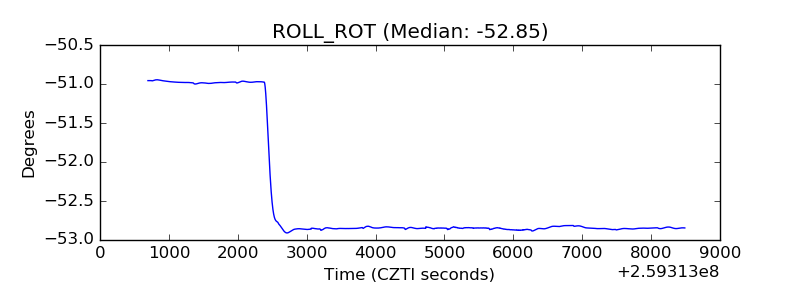 |
| _Roll_DEC | 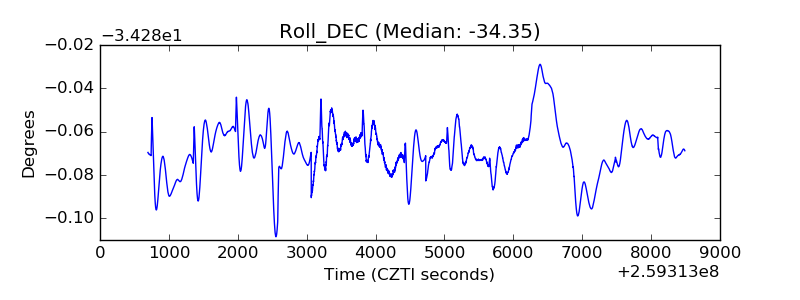 |
| _Roll_RA | 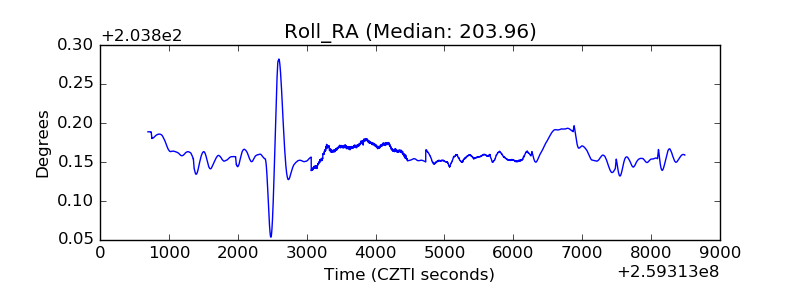 |
| Veto Counter | 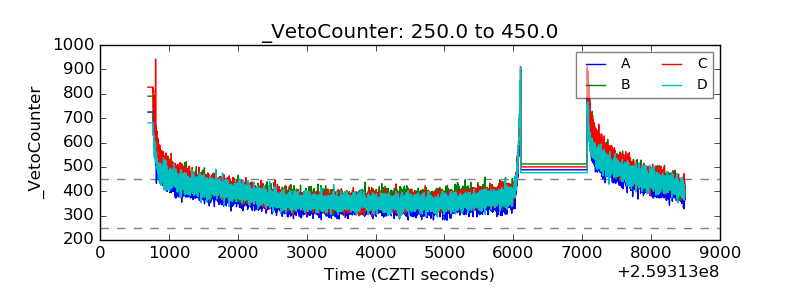 |