| Param | Original file | Final file |
|---|---|---|
| Filename | modeM0/AS1A04_103T01_9000001988_13401cztM0_level2.evt | modeM0/AS1A04_103T01_9000001988_13401cztM0_level2_quad_clean.evt |
| Size (bytes) | 468,388,800 | 68,572,800 |
| Size | 446.7 MB | 65.4 MB |
| Events in quadrant A | 3,345,165 | 408,170 |
| Events in quadrant B | 3,550,668 | 413,922 |
| Events in quadrant C | 3,420,296 | 403,624 |
| Events in quadrant D | 3,419,362 | 388,914 |
| Mode M0 | |||
|---|---|---|---|
| Quadrant | BADHDUFLAG | Total packets | Discarded packets |
| A | 0 | 14264 | 3 |
| B | 0 | 14800 | 2 |
| C | 0 | 14406 | 2 |
| D | 0 | 14589 | 2 |
| Mode SS | |||
|---|---|---|---|
| Quadrant | BADHDUFLAG | Total packets | Discarded packets |
| A | 0 | 136 | 0 |
| B | 0 | 136 | 0 |
| C | 0 | 136 | 0 |
| D | 0 | 136 | 0 |
| Mode M9 | |||
|---|---|---|---|
| Quadrant | BADHDUFLAG | Total packets | Discarded packets |
| A | 0 | 21 | 0 |
| B | 0 | 21 | 0 |
| C | 0 | 21 | 0 |
| D | 0 | 22 | 0 |
| Quadrant | Total seconds | Saturated seconds | Saturation percentage |
|---|---|---|---|
| A | 6615 | 73 | 1.103553% |
| B | 6615 | 81 | 1.224490% |
| C | 6615 | 64 | 0.967498% |
| D | 6615 | 56 | 0.846561% |
Noise dominated data is calculated using 1-second bins in cleaned event files. If a bin has >2000 counts, and if more than 50% of those come from <1% of pixels, then it is considered to be noise-dominated and hence unusable.
| Quadrant | # 1 sec bins | Bins with >0 counts | Bins with >2000 counts | High rate bins dominated by noise | Noise dominated (total time) | Noise dominated (detector-on time) | Marked lightcurve |
|---|---|---|---|---|---|---|---|
| A | 7860 | 6615 | 0 | 0 | 0.00% | 0.00% | 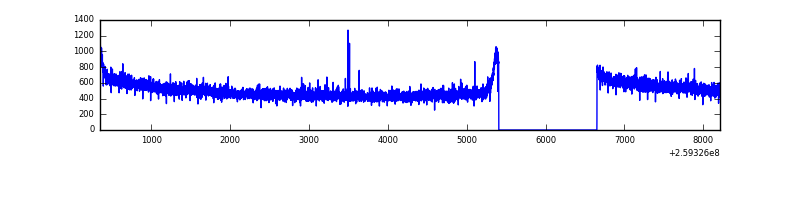 |
| B | 7860 | 6615 | 10 | 10 | 0.13% | 0.15% | 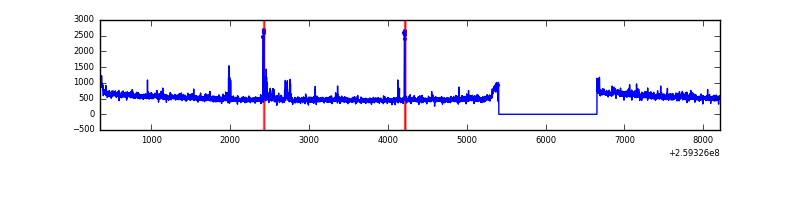 |
| C | 7861 | 6616 | 8 | 8 | 0.10% | 0.12% | 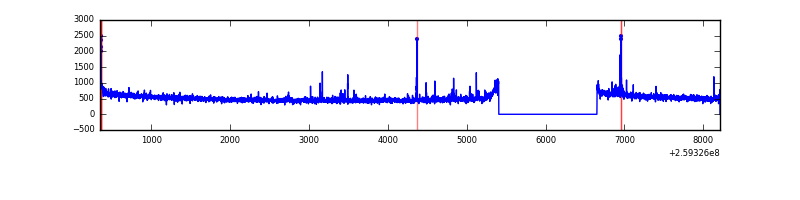 |
| D | 7860 | 6615 | 16 | 16 | 0.20% | 0.24% | 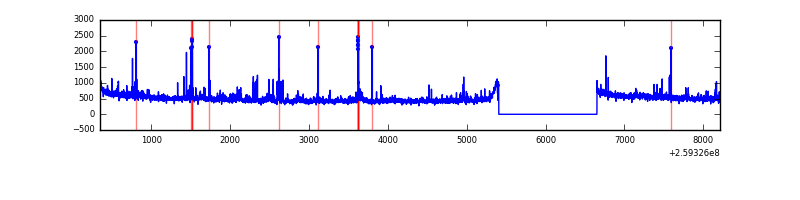 |
Top three noisy pixels from each quadrant. If the there are fewer than three noisy pixels in the level2.evt file, extra rows are filled as -1
| Pixel properties | Quadrant properties | ||||||
|---|---|---|---|---|---|---|---|
| Quadrant | DetID | PixID | Counts | Sigma | Mean | Median | Sigma |
| A | 0 | 226 | 7676 | 39.23 | 866 | 849 | 174.0 |
| A | 1 | 162 | 7530 | 38.39 | 866 | 849 | 174.0 |
| A | 12 | 194 | 6541 | 32.7 | 866 | 849 | 174.0 |
| B | 3 | 64 | 90217 | 555.51 | 865 | 846 | 160.9 |
| B | 0 | 214 | 42696 | 260.13 | 865 | 846 | 160.9 |
| B | 0 | 230 | 21015 | 125.36 | 865 | 846 | 160.9 |
| C | 14 | 220 | 78252 | 406.95 | 834 | 839 | 190.2 |
| C | 3 | 233 | 75603 | 393.02 | 834 | 839 | 190.2 |
| C | 6 | 253 | 11425 | 55.65 | 834 | 839 | 190.2 |
| D | 8 | 195 | 115377 | 576.53 | 832 | 807 | 198.7 |
| D | 1 | 52 | 100099 | 499.65 | 832 | 807 | 198.7 |
| D | 2 | 136 | 26650 | 130.05 | 832 | 807 | 198.7 |
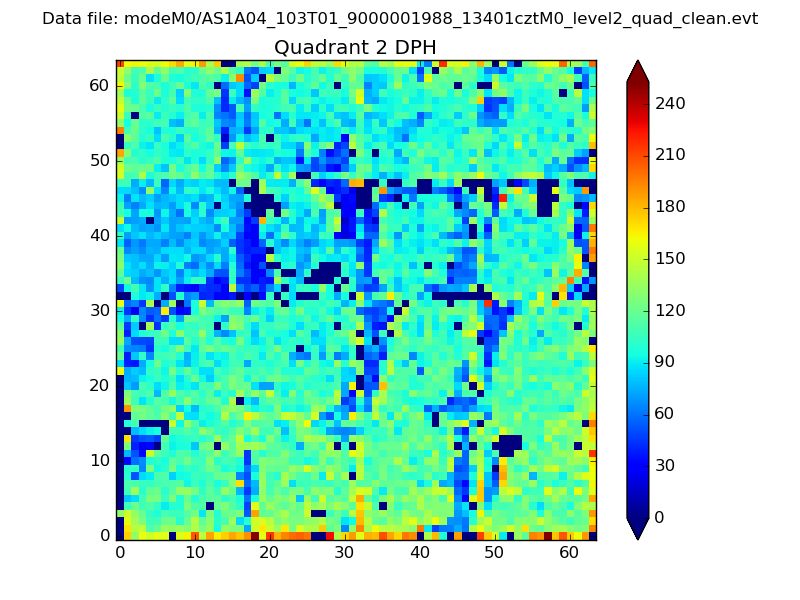
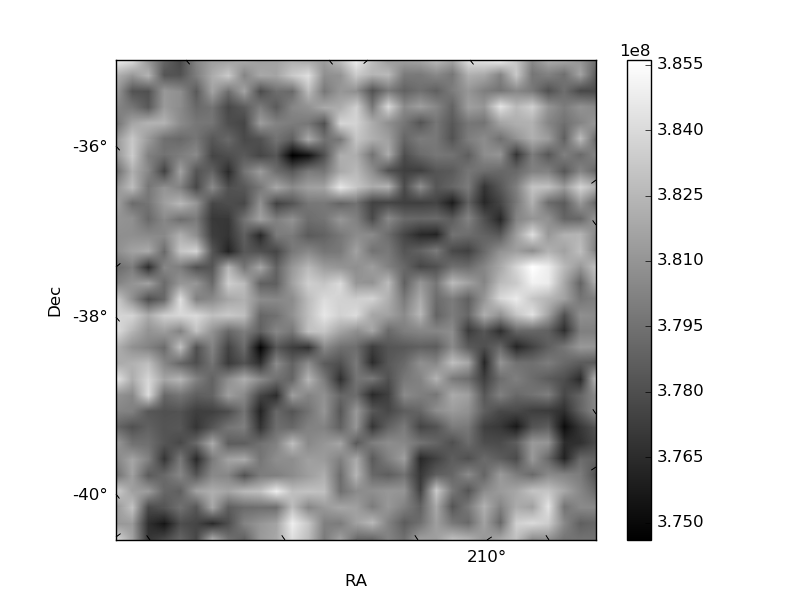
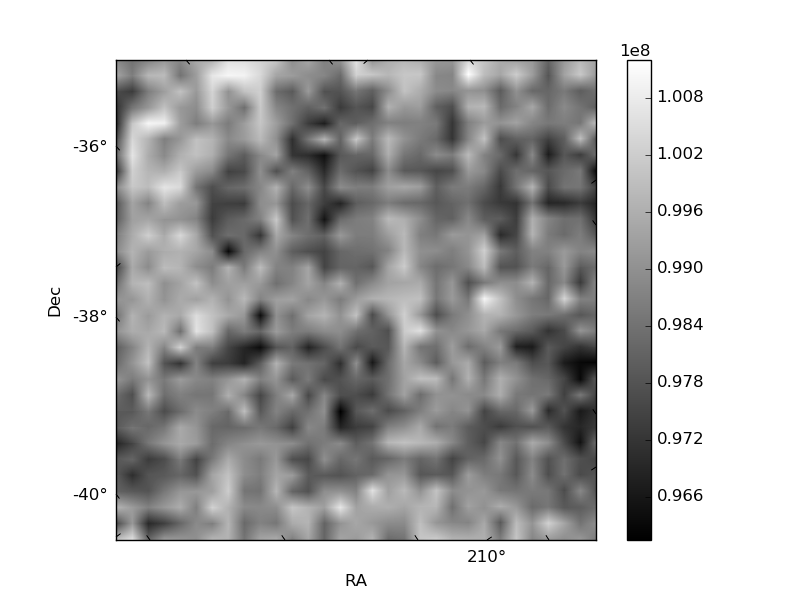
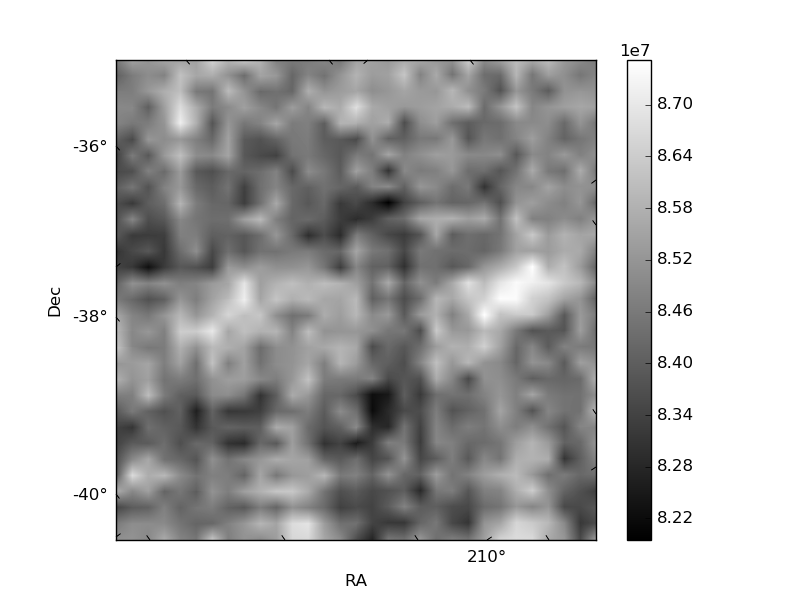
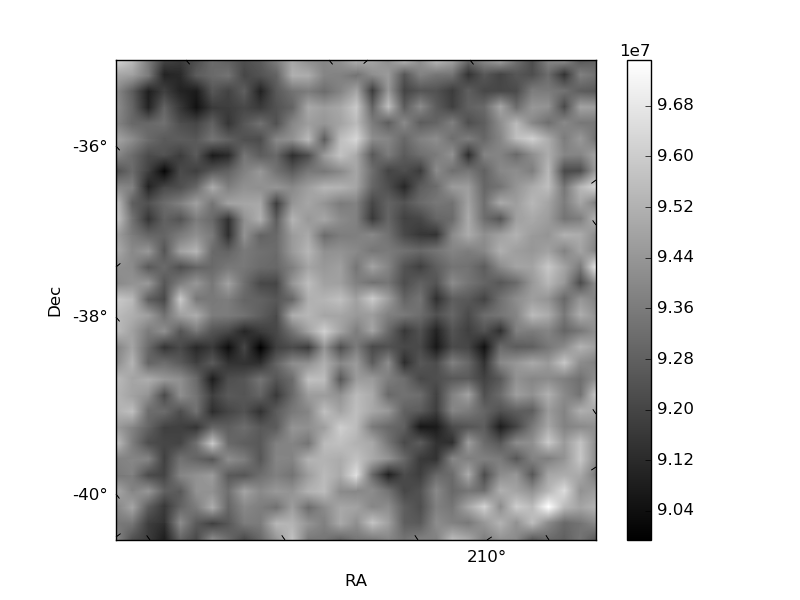
Histogram calculated using DETX and DETY for each event in the final _common_clean file
| Quadrant A | 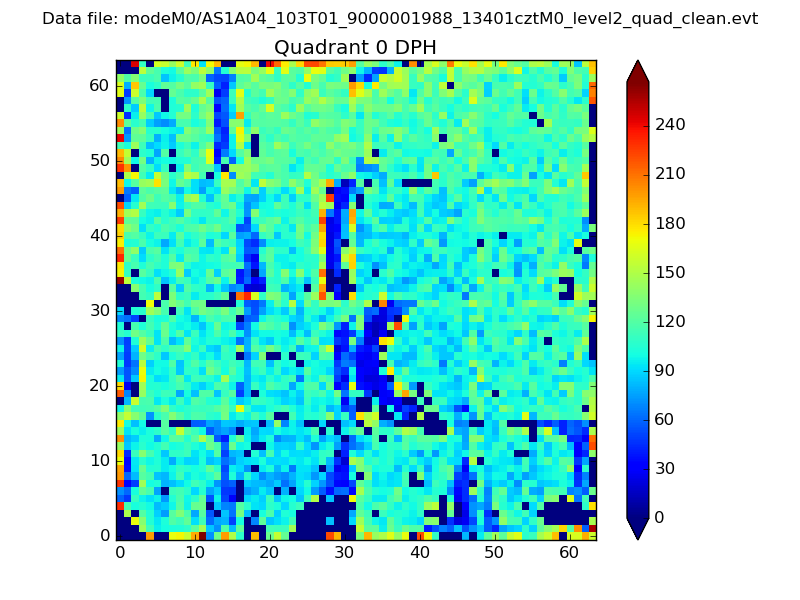 |
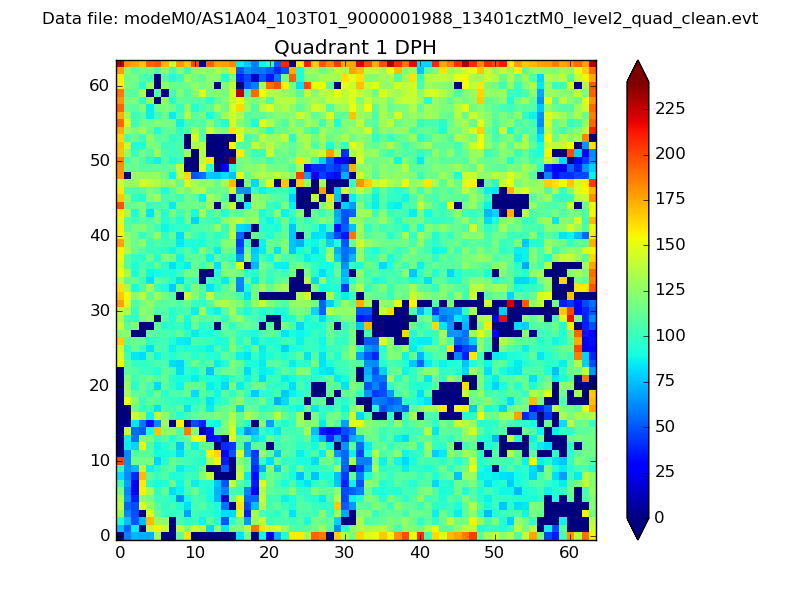 |
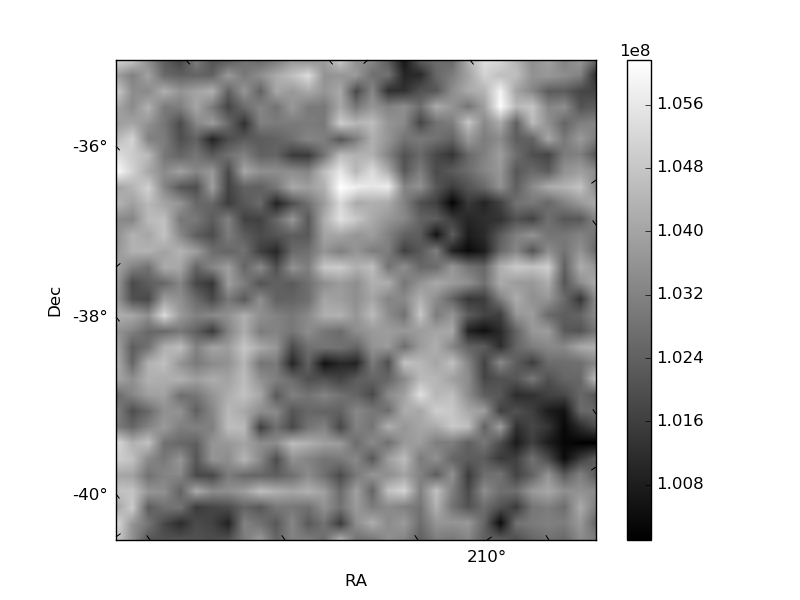
Quadrant B |
|---|---|---|---|
| Quadrant D | 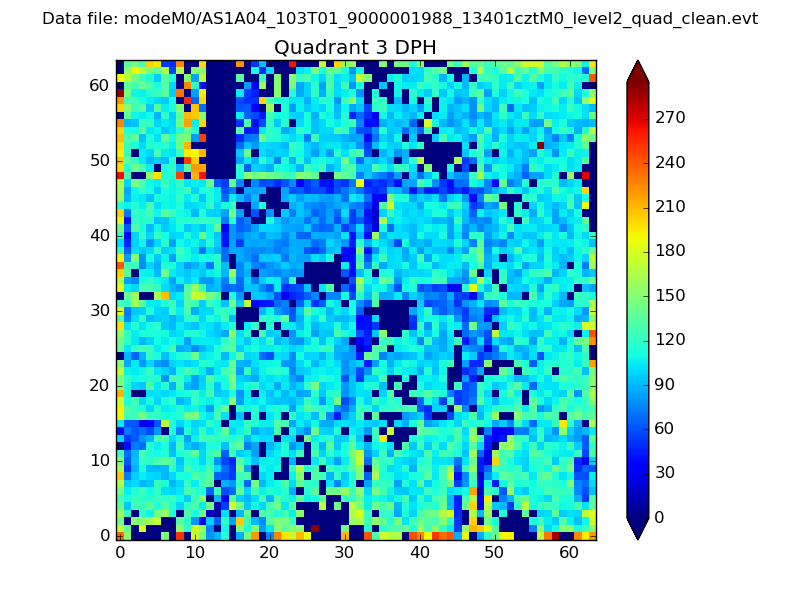 |
 |
Quadrant C |
| Plot type | Count rate plots | Images |
|---|---|---|
| Comparison with Poisson distribution Blue bars denote a histogram of data divided into 1 sec bins. Red curve is a Poisson curve with rate = median count rate of data. |
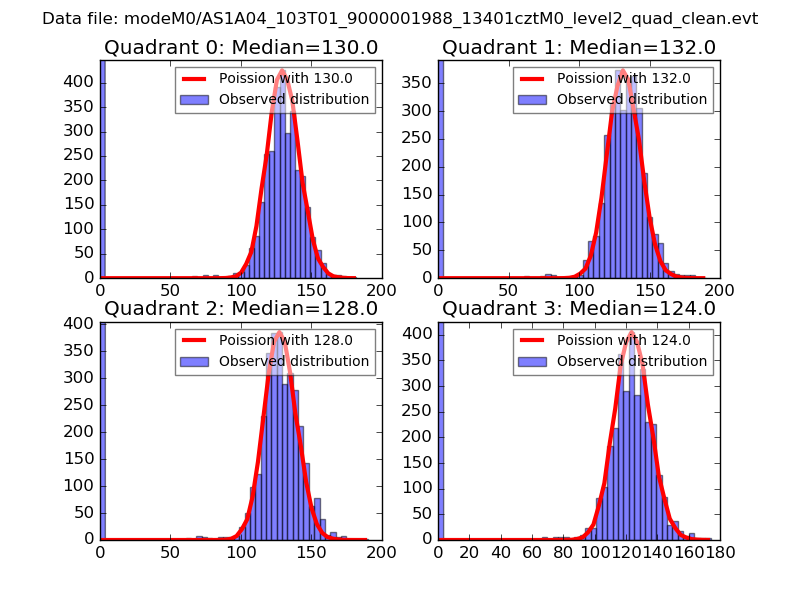 |
 |
| Quadrant-wise count rates Data is divided into 100 sec bins |
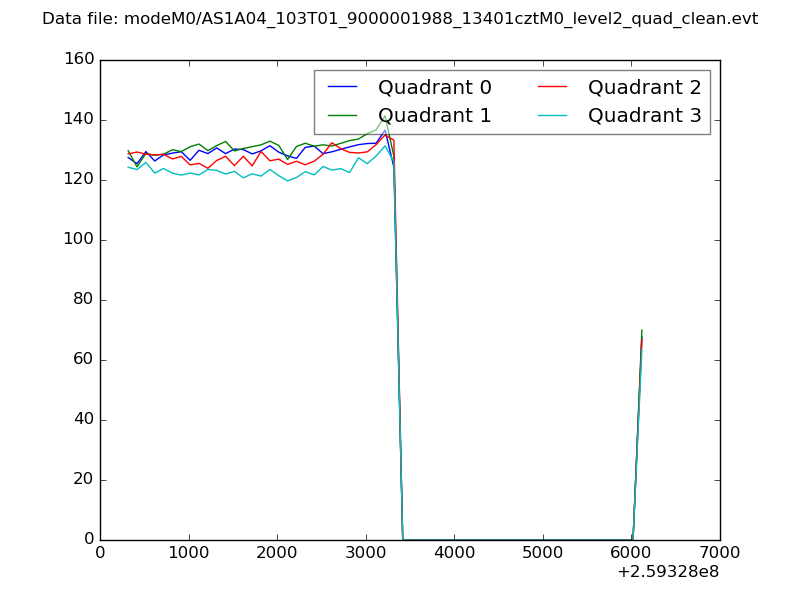 |
|
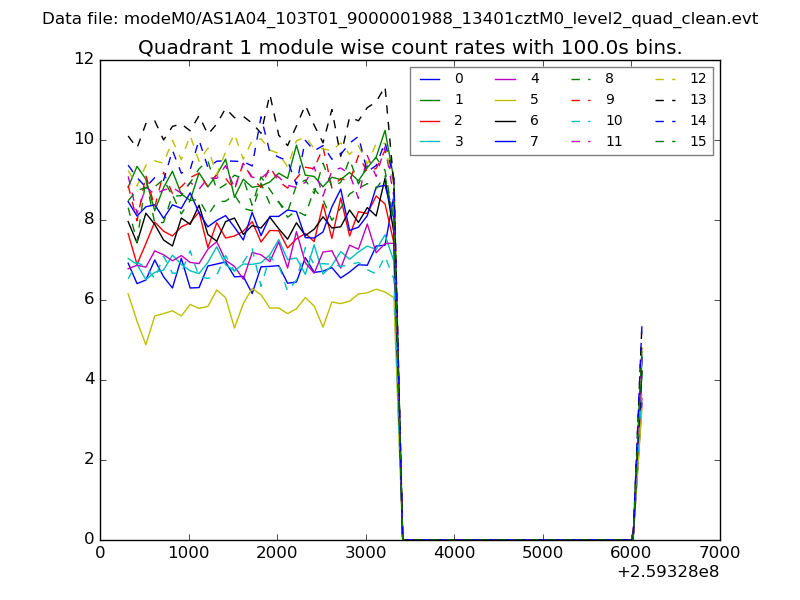
| Module-wise count rates for Quadrant A Data is divided into 100 sec bins |
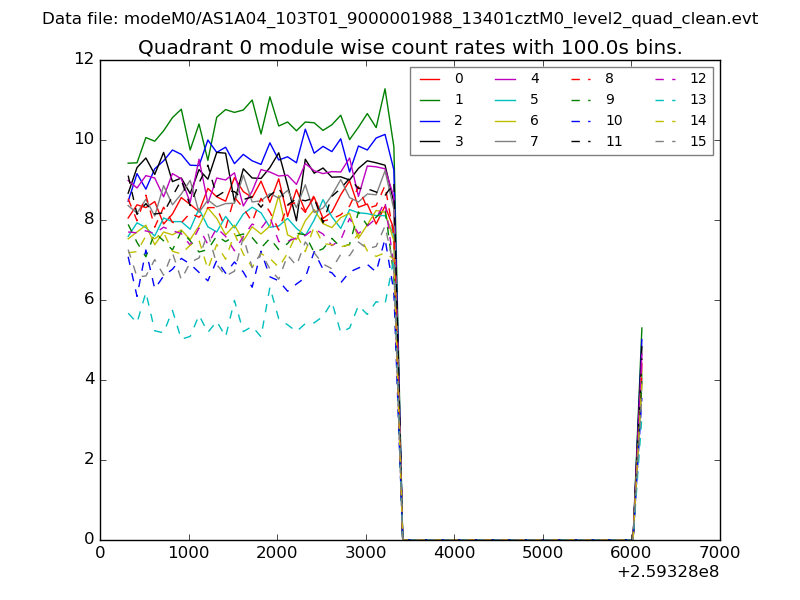 |
 |
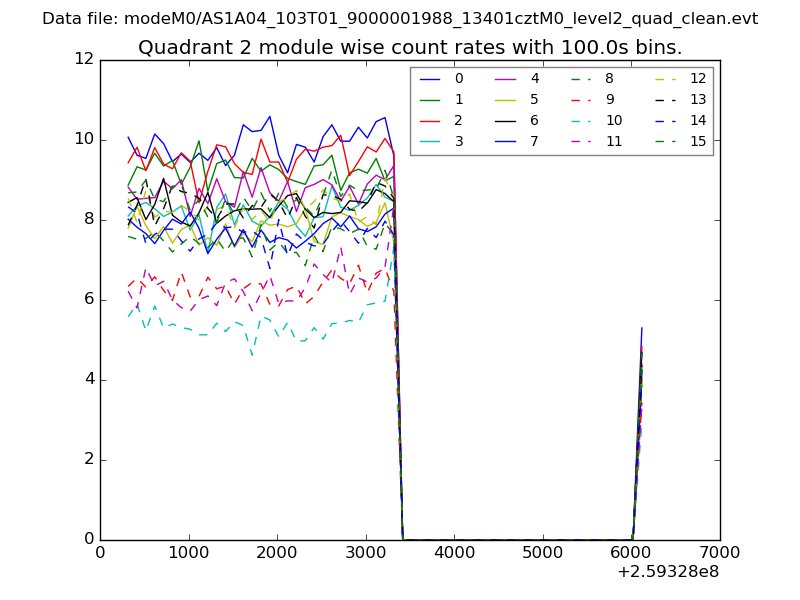
| Module-wise count rates for Quadrant B Data is divided into 100 sec bins |
 |
 |
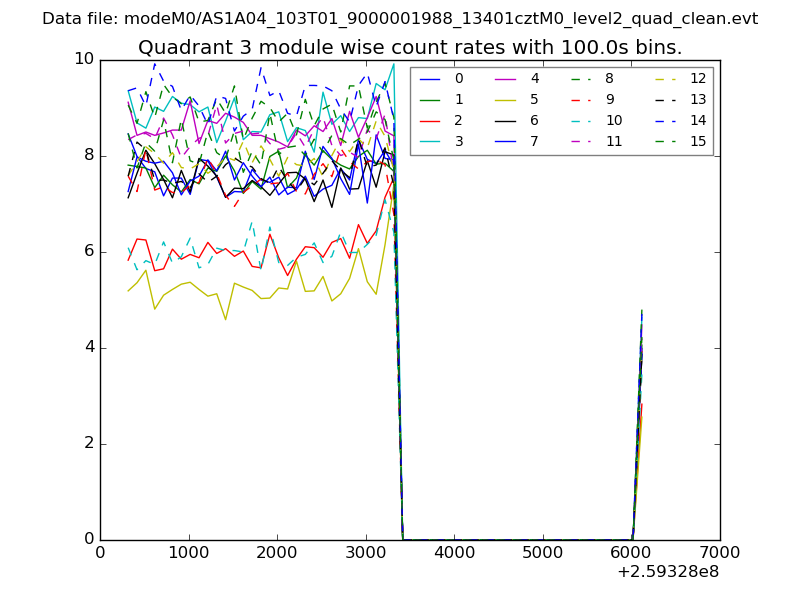
| Module-wise count rates for Quadrant C Data is divided into 100 sec bins |
 |
 |
| Module-wise count rates for Quadrant D Data is divided into 100 sec bins |
 |
 |
| Parameter | Plot |
|---|---|
| CZT HV Monitor | 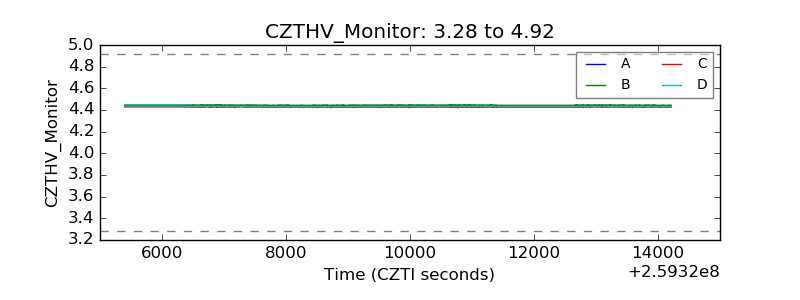 |
| D_VDD | 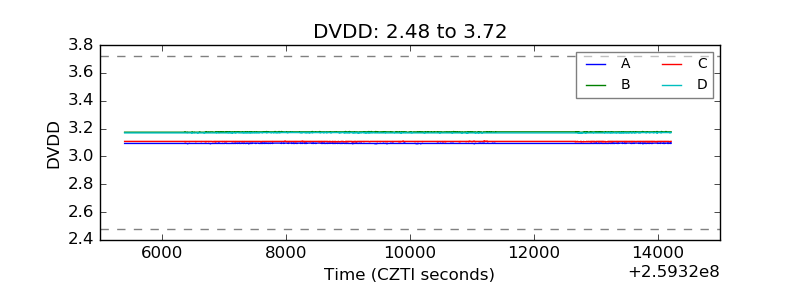 |
| Temperature 1 | 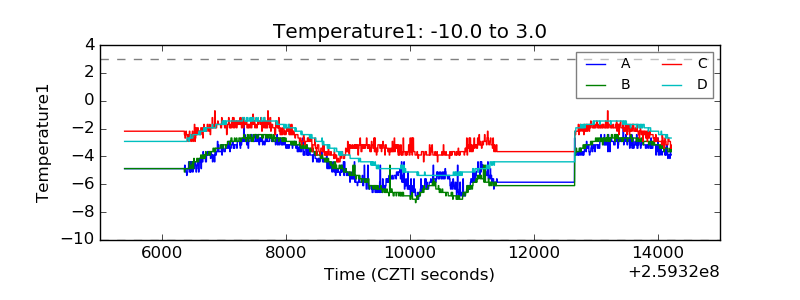 |
| Veto HV Monitor | 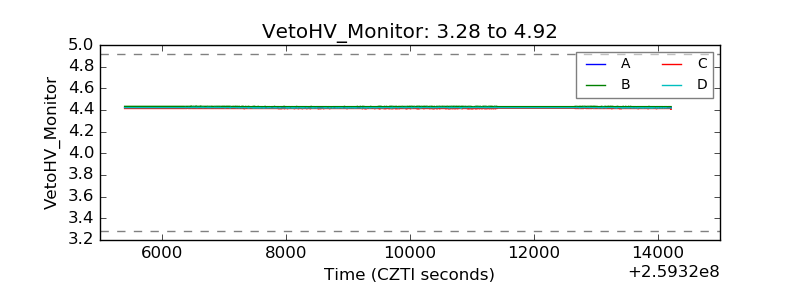 |
| Veto LLD | 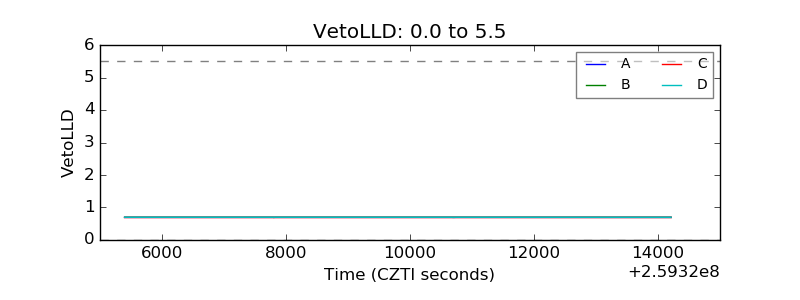 |
| Alpha Counter | 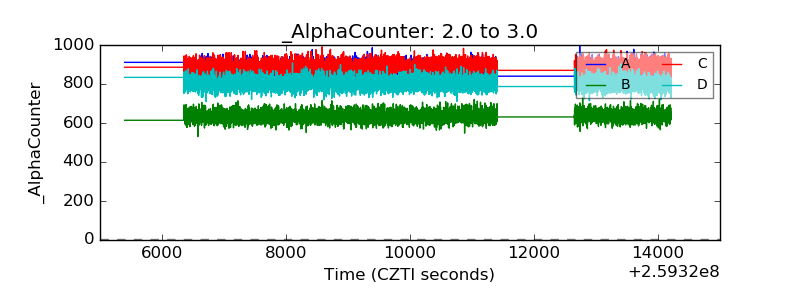 |
| _CPM_Rate | 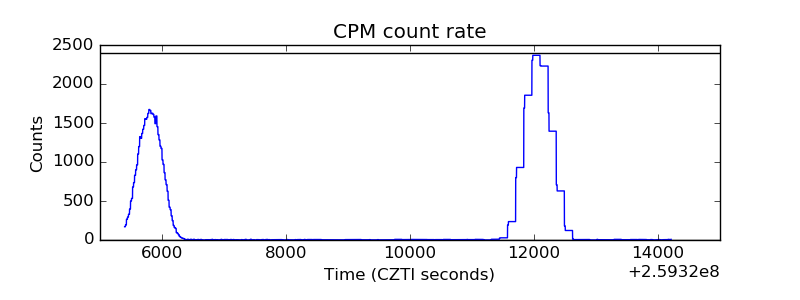 |
| CZT Counter | 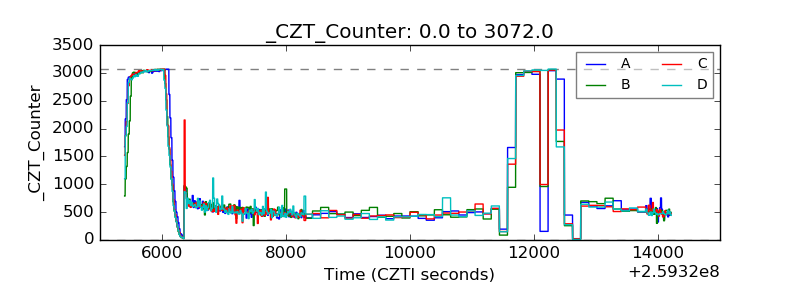 |
| +2.5 Volts monitor |  |
| +5 Volts monitor | 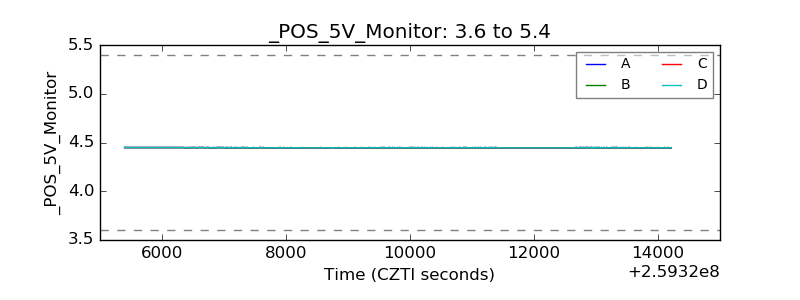 |
| _ROLL_ROT | 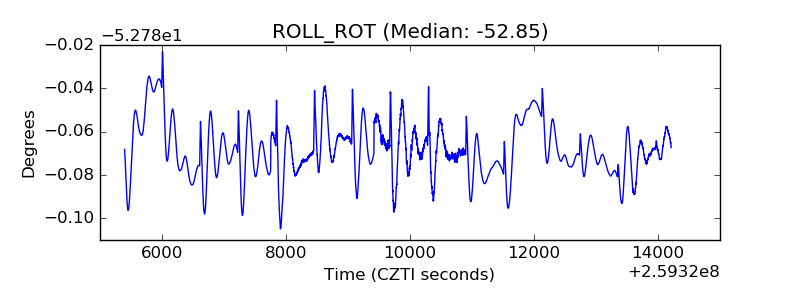 |
| _Roll_DEC | 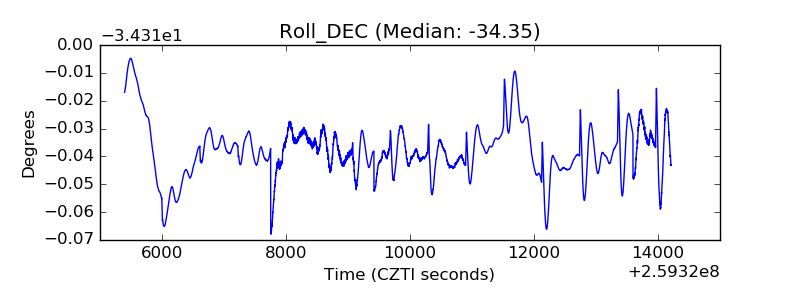 |
| _Roll_RA | 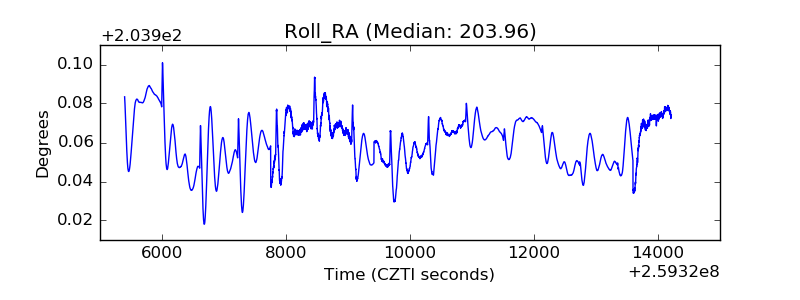 |
| Veto Counter | 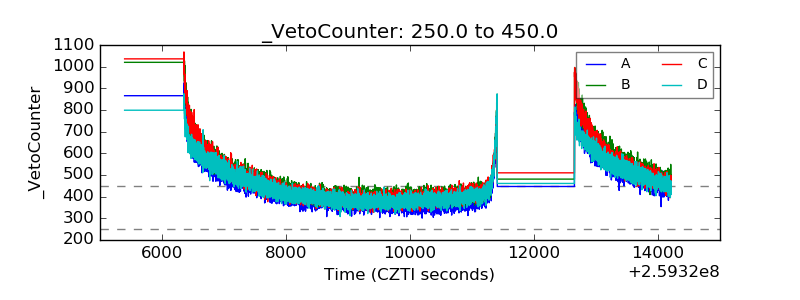 |