| Param | Original file | Final file |
|---|---|---|
| Filename | modeM0/AS1A04_103T01_9000001988_13402cztM0_level2.evt | modeM0/AS1A04_103T01_9000001988_13402cztM0_level2_quad_clean.evt |
| Size (bytes) | 453,764,160 | 81,768,960 |
| Size | 432.7 MB | 78.0 MB |
| Events in quadrant A | 3,225,935 | 515,752 |
| Events in quadrant B | 3,448,846 | 526,556 |
| Events in quadrant C | 3,331,546 | 507,247 |
| Events in quadrant D | 3,309,336 | 488,165 |
| Mode M0 | |||
|---|---|---|---|
| Quadrant | BADHDUFLAG | Total packets | Discarded packets |
| A | 0 | 13626 | 2 |
| B | 0 | 14279 | 1 |
| C | 0 | 13919 | 1 |
| D | 0 | 14134 | 1 |
| Mode SS | |||
|---|---|---|---|
| Quadrant | BADHDUFLAG | Total packets | Discarded packets |
| A | 0 | 130 | 0 |
| B | 0 | 130 | 0 |
| C | 0 | 130 | 0 |
| D | 0 | 130 | 0 |
| Mode M9 | |||
|---|---|---|---|
| Quadrant | BADHDUFLAG | Total packets | Discarded packets |
| A | 0 | 12 | 0 |
| B | 0 | 12 | 0 |
| C | 0 | 12 | 0 |
| D | 0 | 12 | 0 |
| Quadrant | Total seconds | Saturated seconds | Saturation percentage |
|---|---|---|---|
| A | 6272 | 88 | 1.403061% |
| B | 6272 | 101 | 1.610332% |
| C | 6272 | 78 | 1.243622% |
| D | 6272 | 79 | 1.259566% |
Noise dominated data is calculated using 1-second bins in cleaned event files. If a bin has >2000 counts, and if more than 50% of those come from <1% of pixels, then it is considered to be noise-dominated and hence unusable.
| Quadrant | # 1 sec bins | Bins with >0 counts | Bins with >2000 counts | High rate bins dominated by noise | Noise dominated (total time) | Noise dominated (detector-on time) | Marked lightcurve |
|---|---|---|---|---|---|---|---|
| A | 7543 | 6273 | 0 | 0 | 0.00% | 0.00% | 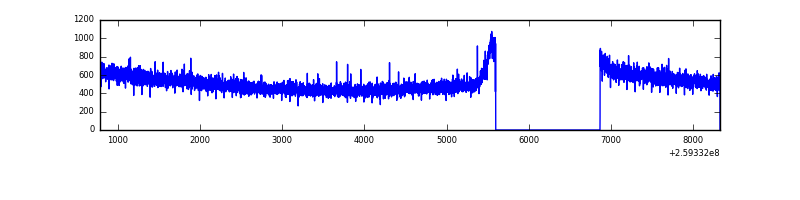 |
| B | 7542 | 6272 | 6 | 6 | 0.08% | 0.10% | 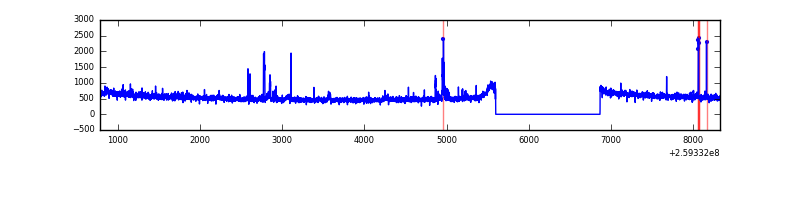 |
| C | 7543 | 6273 | 12 | 12 | 0.16% | 0.19% | 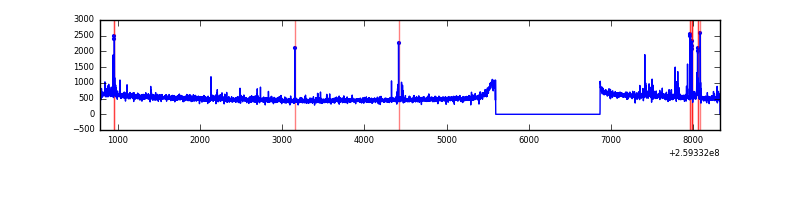 |
| D | 7543 | 6273 | 17 | 17 | 0.23% | 0.27% | 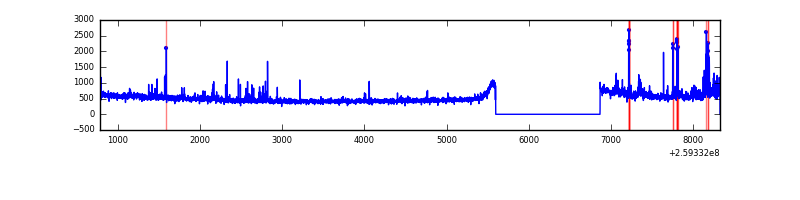 |
Top three noisy pixels from each quadrant. If the there are fewer than three noisy pixels in the level2.evt file, extra rows are filled as -1
| Pixel properties | Quadrant properties | ||||||
|---|---|---|---|---|---|---|---|
| Quadrant | DetID | PixID | Counts | Sigma | Mean | Median | Sigma |
| A | 0 | 226 | 7445 | 39.44 | 838 | 822 | 167.9 |
| A | 12 | 194 | 6316 | 32.72 | 838 | 822 | 167.9 |
| A | 3 | 137 | 4806 | 23.73 | 838 | 822 | 167.9 |
| B | 3 | 64 | 86248 | 549.02 | 839 | 822 | 155.6 |
| B | 0 | 214 | 33341 | 208.99 | 839 | 822 | 155.6 |
| B | 0 | 230 | 21980 | 135.98 | 839 | 822 | 155.6 |
| C | 14 | 220 | 128023 | 693.81 | 804 | 810 | 183.4 |
| C | 3 | 233 | 64965 | 349.9 | 804 | 810 | 183.4 |
| C | 13 | 61 | 5810 | 27.27 | 804 | 810 | 183.4 |
| D | 1 | 52 | 133342 | 705.45 | 798 | 778 | 187.9 |
| D | 8 | 195 | 126377 | 668.38 | 798 | 778 | 187.9 |
| D | 2 | 234 | 21173 | 108.53 | 798 | 778 | 187.9 |
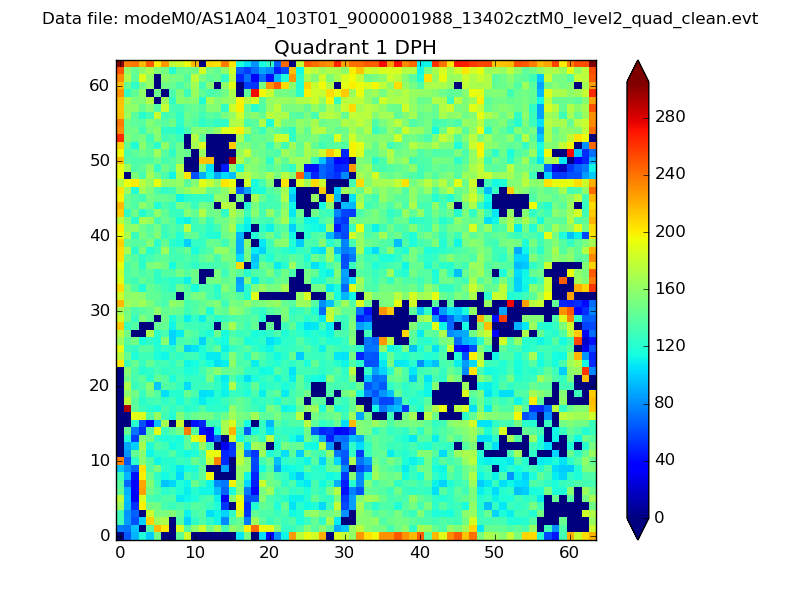
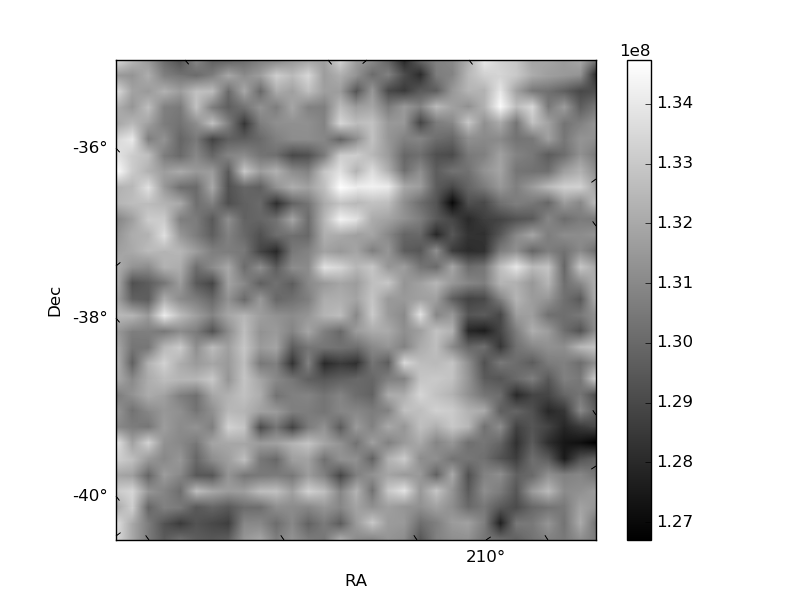
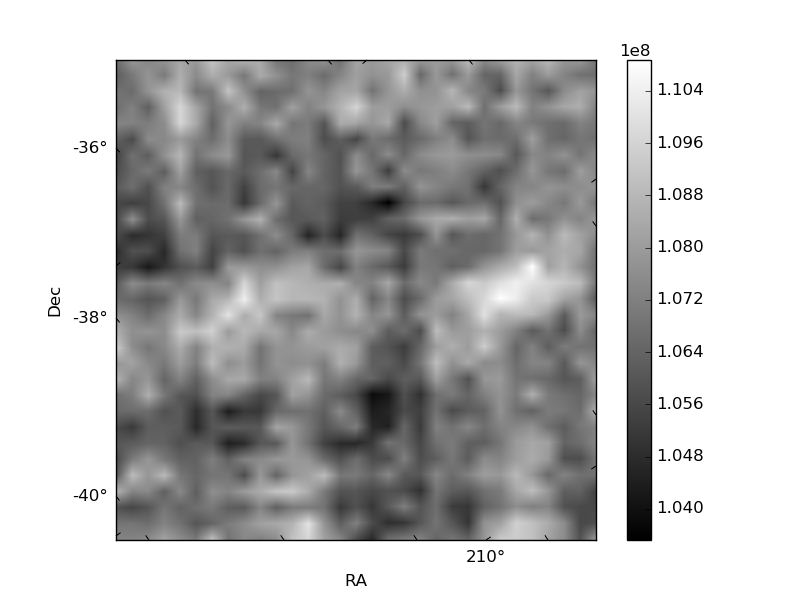
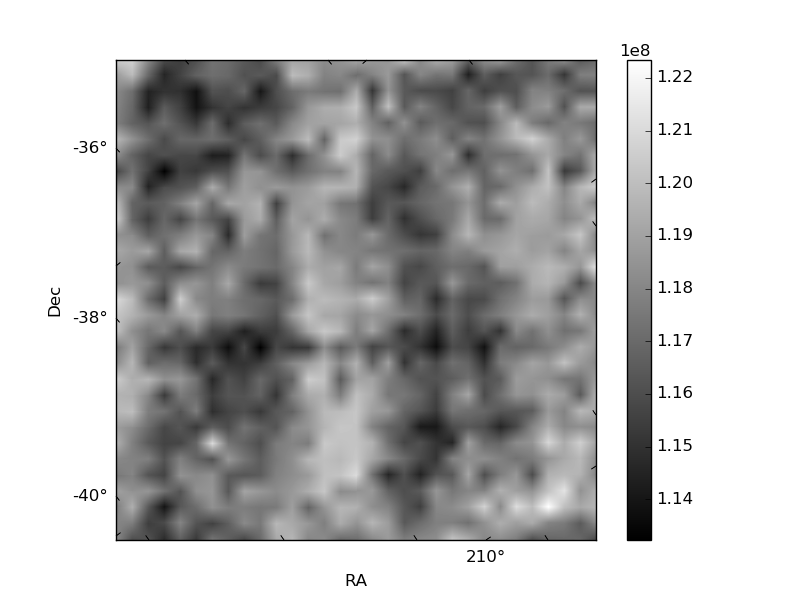
Histogram calculated using DETX and DETY for each event in the final _common_clean file
| Quadrant A |  |
 |
Quadrant B |
|---|---|---|---|
| Quadrant D | 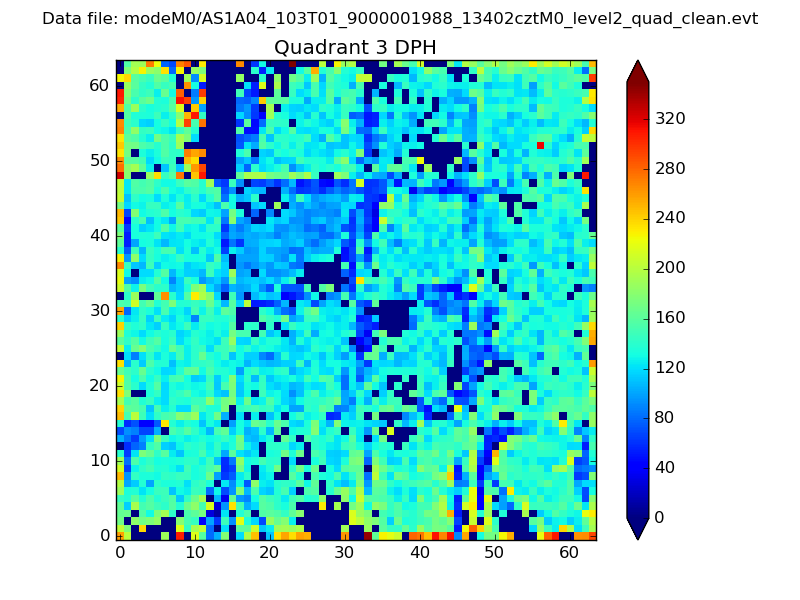 |
 |
Quadrant C |
| Plot type | Count rate plots | Images |
|---|---|---|
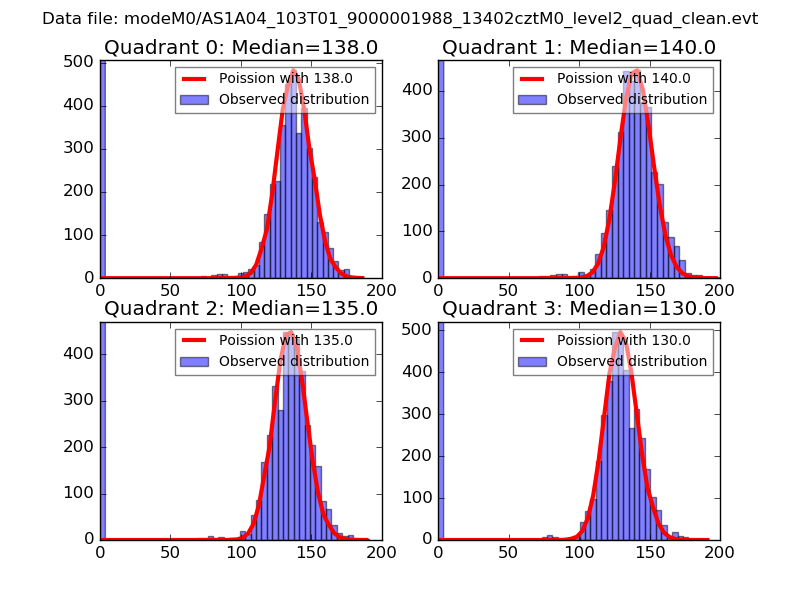
| Comparison with Poisson distribution Blue bars denote a histogram of data divided into 1 sec bins. Red curve is a Poisson curve with rate = median count rate of data. |
 |
 |
| Quadrant-wise count rates Data is divided into 100 sec bins |
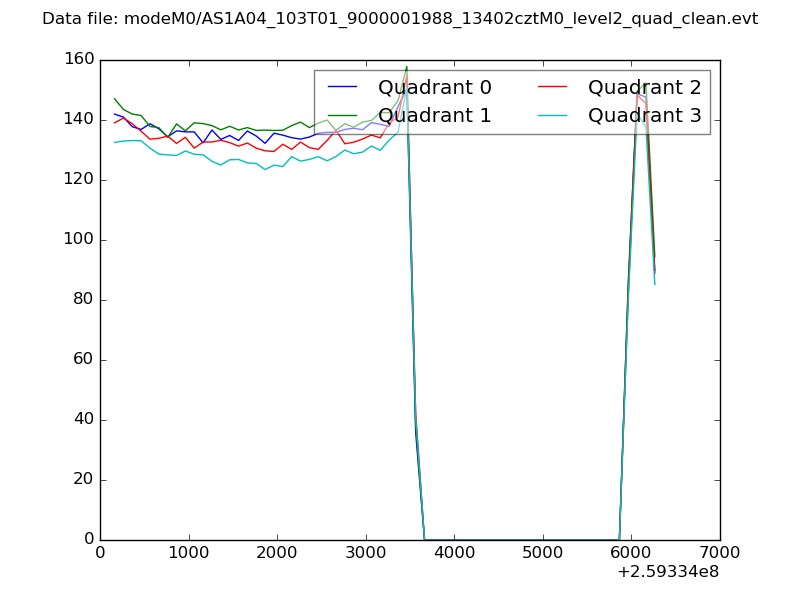 |
|
| Module-wise count rates for Quadrant A Data is divided into 100 sec bins |
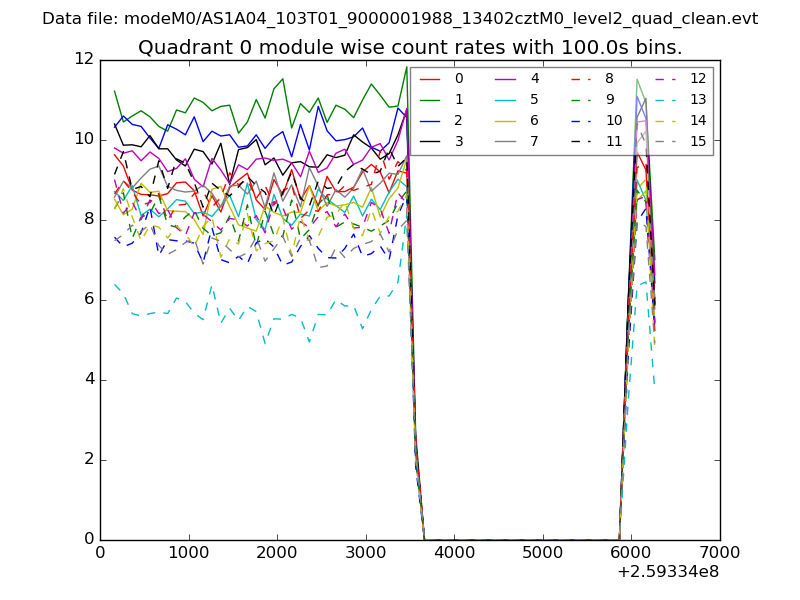 |
 |
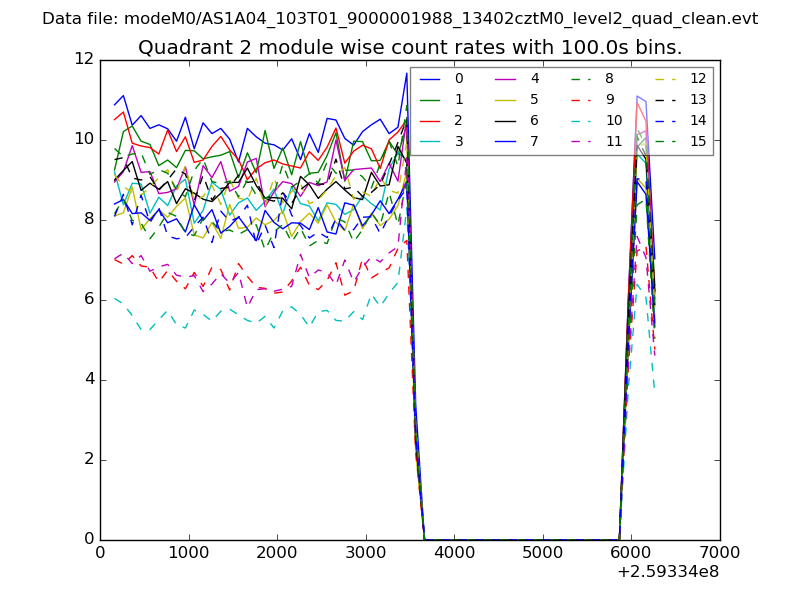
| Module-wise count rates for Quadrant B Data is divided into 100 sec bins |
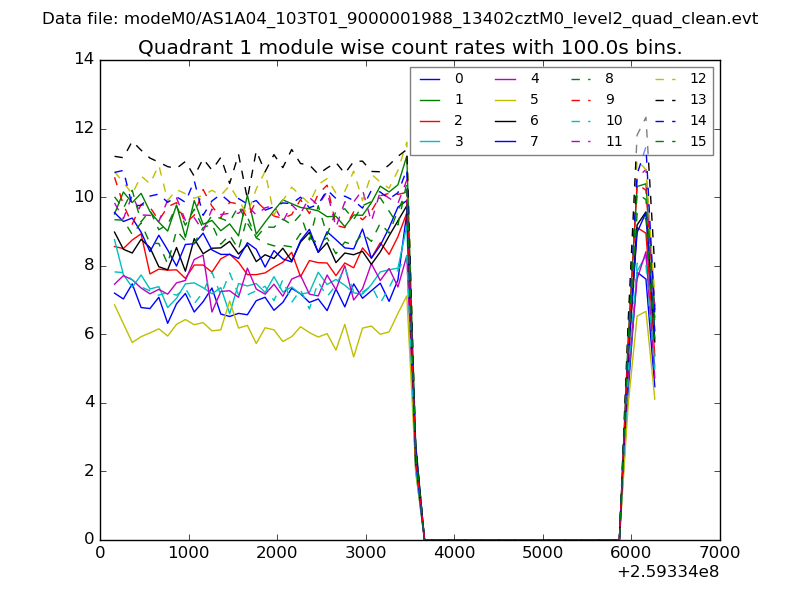 |
 |
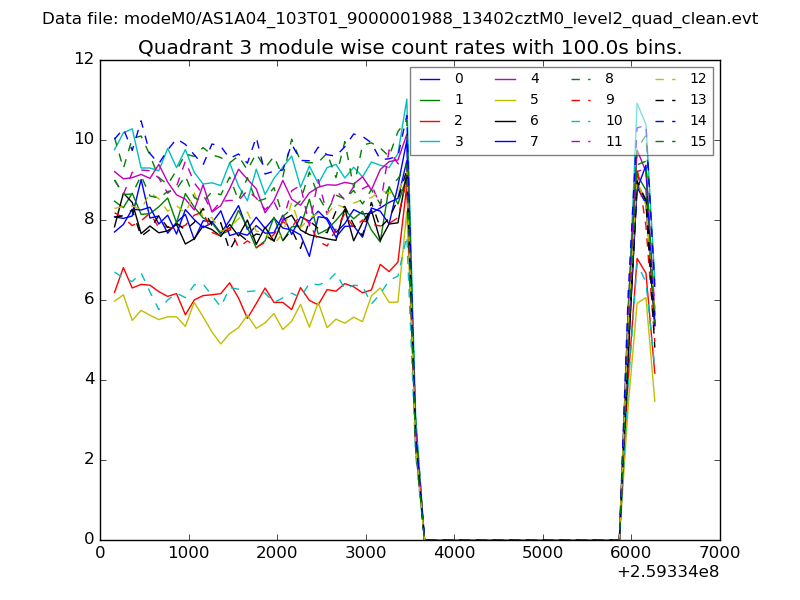
| Module-wise count rates for Quadrant C Data is divided into 100 sec bins |
 |
 |
| Module-wise count rates for Quadrant D Data is divided into 100 sec bins |
 |
 |
| Parameter | Plot |
|---|---|
| CZT HV Monitor | 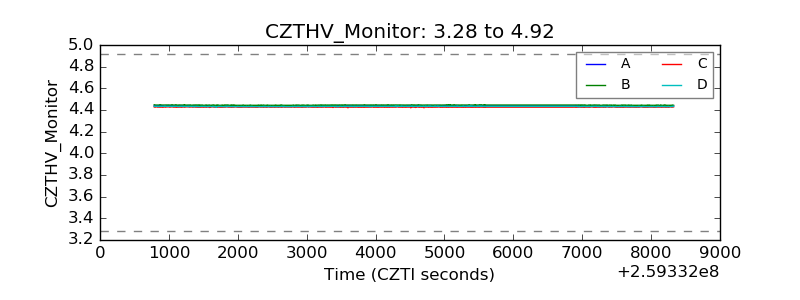 |
| D_VDD | 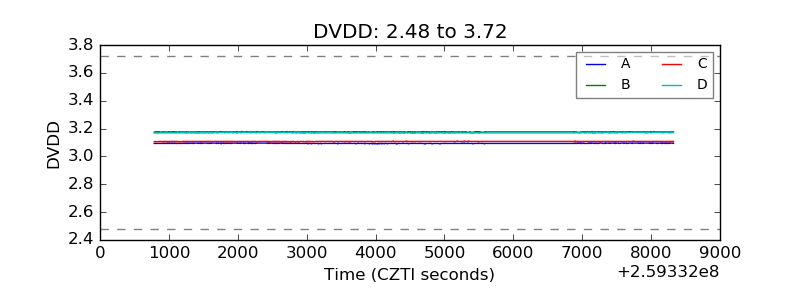 |
| Temperature 1 | 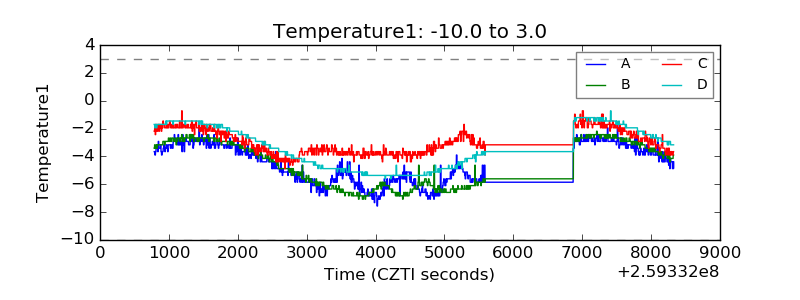 |
| Veto HV Monitor | 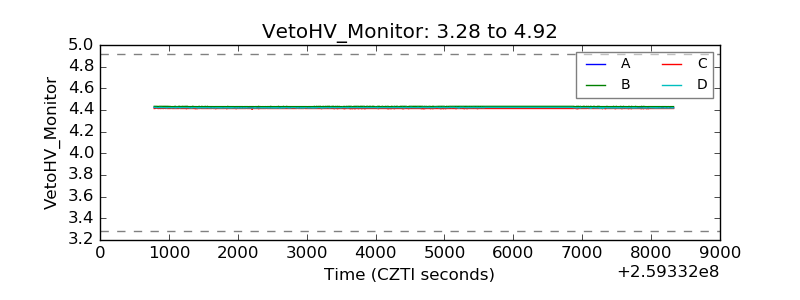 |
| Veto LLD | 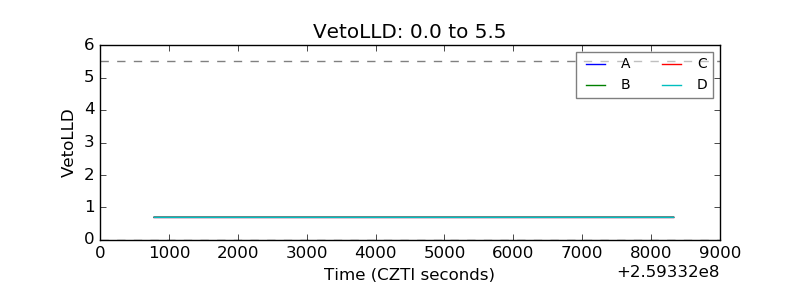 |
| Alpha Counter | 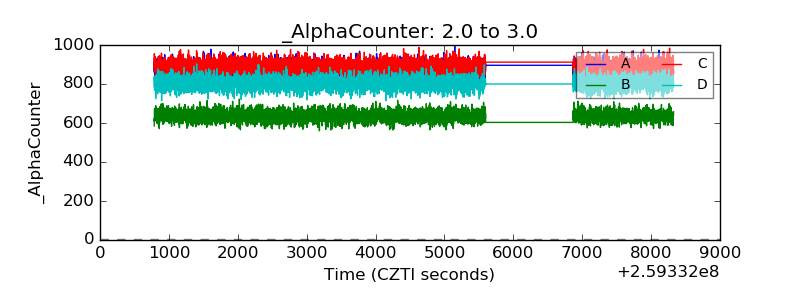 |
| _CPM_Rate | 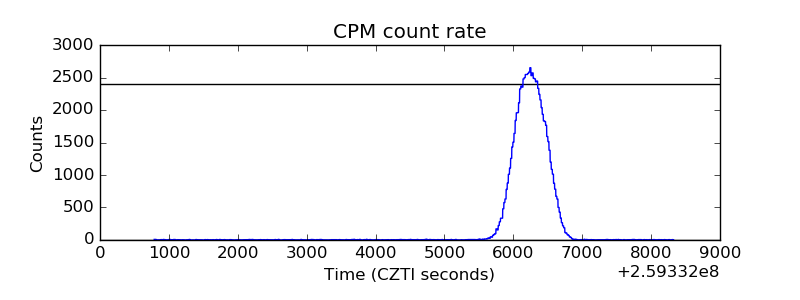 |
| CZT Counter | 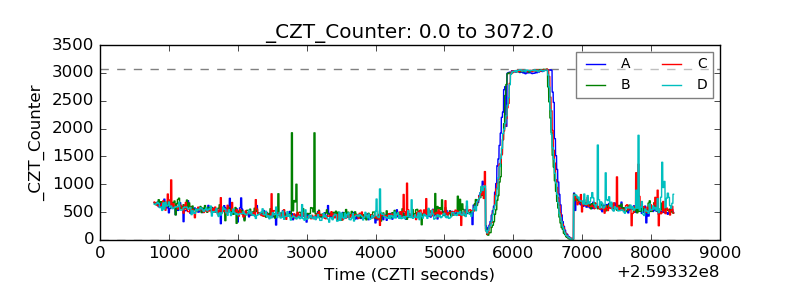 |
| +2.5 Volts monitor |  |
| +5 Volts monitor |  |
| _ROLL_ROT | 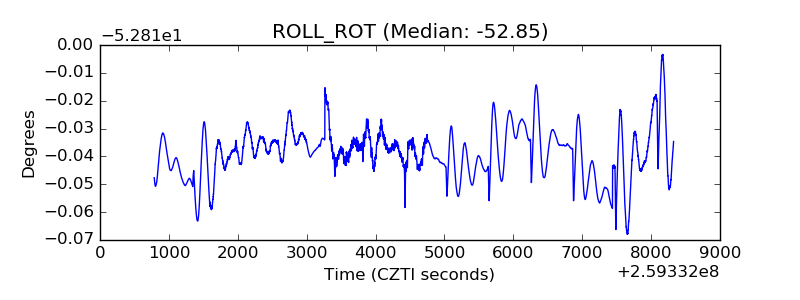 |
| _Roll_DEC | 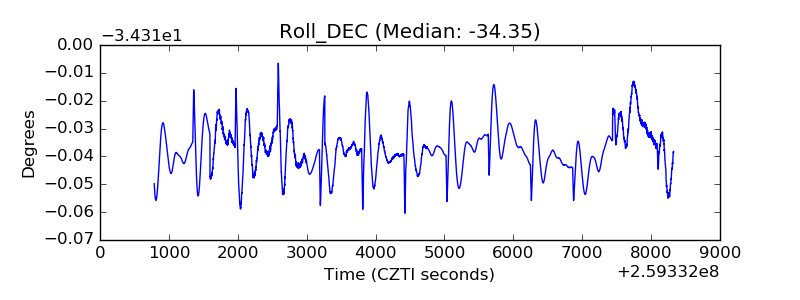 |
| _Roll_RA | 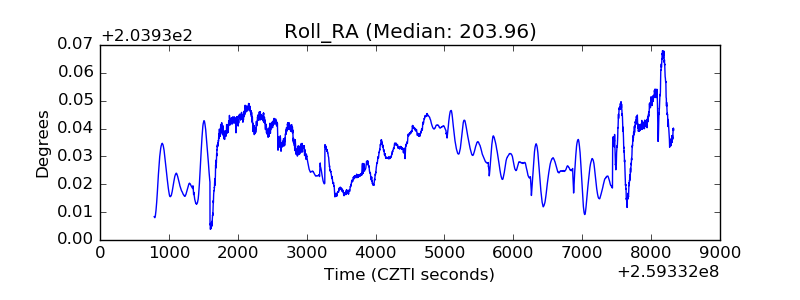 |
| Veto Counter | 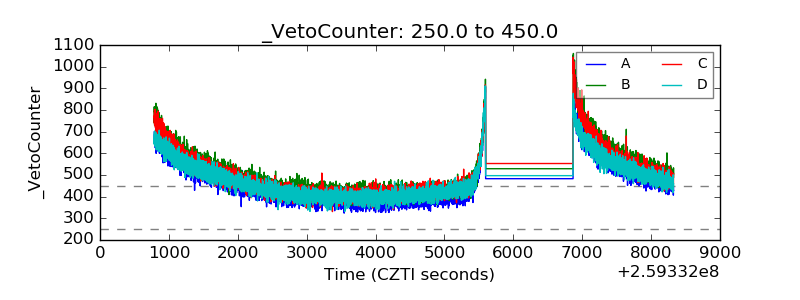 |