| Param | Original file | Final file |
|---|---|---|
| Filename | modeM0/AS1A04_103T01_9000001988_13403cztM0_level2.evt | modeM0/AS1A04_103T01_9000001988_13403cztM0_level2_quad_clean.evt |
| Size (bytes) | 461,324,160 | 93,358,080 |
| Size | 440.0 MB | 89.0 MB |
| Events in quadrant A | 3,146,433 | 609,275 |
| Events in quadrant B | 3,448,330 | 624,556 |
| Events in quadrant C | 3,157,763 | 599,804 |
| Events in quadrant D | 3,805,562 | 568,632 |
| Mode M0 | |||
|---|---|---|---|
| Quadrant | BADHDUFLAG | Total packets | Discarded packets |
| A | 0 | 13204 | 2 |
| B | 0 | 14238 | 1 |
| C | 0 | 13244 | 1 |
| D | 0 | 15486 | 1 |
| Mode SS | |||
|---|---|---|---|
| Quadrant | BADHDUFLAG | Total packets | Discarded packets |
| A | 0 | 122 | 0 |
| B | 0 | 122 | 0 |
| C | 0 | 122 | 0 |
| D | 0 | 122 | 0 |
| Mode M9 | |||
|---|---|---|---|
| Quadrant | BADHDUFLAG | Total packets | Discarded packets |
| A | 0 | 14 | 0 |
| B | 0 | 14 | 0 |
| C | 0 | 14 | 0 |
| D | 0 | 14 | 0 |
| Quadrant | Total seconds | Saturated seconds | Saturation percentage |
|---|---|---|---|
| A | 6093 | 28 | 0.459544% |
| B | 6093 | 84 | 1.378631% |
| C | 6093 | 18 | 0.295421% |
| D | 6093 | 56 | 0.919087% |
Noise dominated data is calculated using 1-second bins in cleaned event files. If a bin has >2000 counts, and if more than 50% of those come from <1% of pixels, then it is considered to be noise-dominated and hence unusable.
| Quadrant | # 1 sec bins | Bins with >0 counts | Bins with >2000 counts | High rate bins dominated by noise | Noise dominated (total time) | Noise dominated (detector-on time) | Marked lightcurve |
|---|---|---|---|---|---|---|---|
| A | 7459 | 6095 | 3 | 3 | 0.04% | 0.05% | 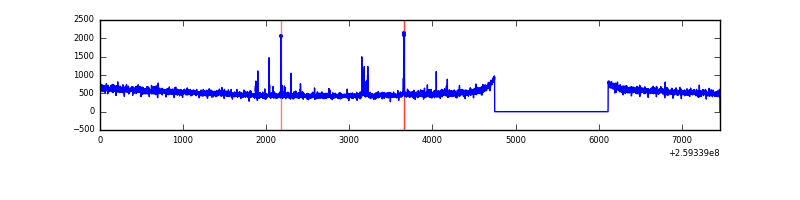 |
| B | 7459 | 6094 | 23 | 23 | 0.31% | 0.38% | 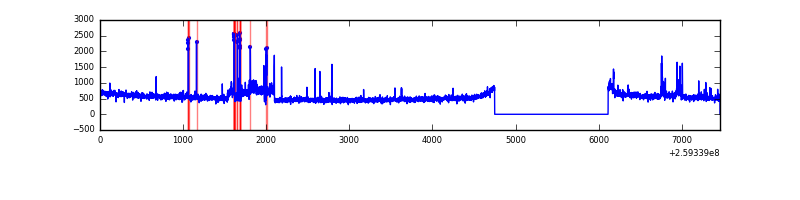 |
| C | 7459 | 6095 | 8 | 8 | 0.11% | 0.13% | 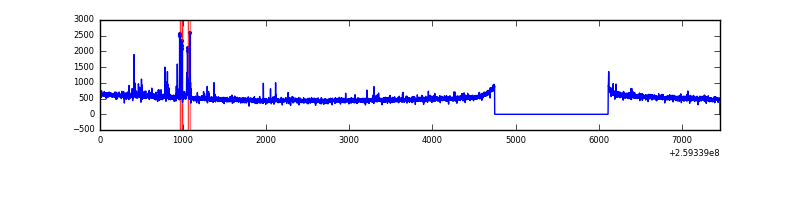 |
| D | 7459 | 6095 | 28 | 28 | 0.38% | 0.46% | 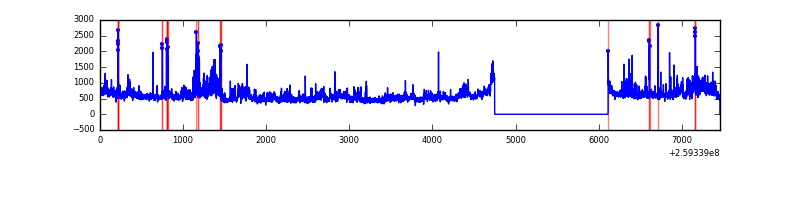 |
Top three noisy pixels from each quadrant. If the there are fewer than three noisy pixels in the level2.evt file, extra rows are filled as -1
| Pixel properties | Quadrant properties | ||||||
|---|---|---|---|---|---|---|---|
| Quadrant | DetID | PixID | Counts | Sigma | Mean | Median | Sigma |
| A | 15 | 69 | 34587 | 209.87 | 805 | 791 | 161.0 |
| A | 1 | 162 | 10694 | 61.5 | 805 | 791 | 161.0 |
| A | 0 | 226 | 7294 | 40.38 | 805 | 791 | 161.0 |
| B | 3 | 64 | 201809 | 1336.63 | 807 | 788 | 150.4 |
| B | 4 | 142 | 54917 | 359.92 | 807 | 788 | 150.4 |
| B | 12 | 111 | 16555 | 104.84 | 807 | 788 | 150.4 |
| C | 14 | 220 | 95559 | 536.81 | 770 | 777 | 176.6 |
| C | 3 | 233 | 59198 | 330.87 | 770 | 777 | 176.6 |
| C | 13 | 61 | 5573 | 27.16 | 770 | 777 | 176.6 |
| D | 8 | 195 | 583904 | 3254.82 | 758 | 738 | 179.2 |
| D | 1 | 52 | 273398 | 1521.79 | 758 | 738 | 179.2 |
| D | 2 | 136 | 44429 | 243.85 | 758 | 738 | 179.2 |
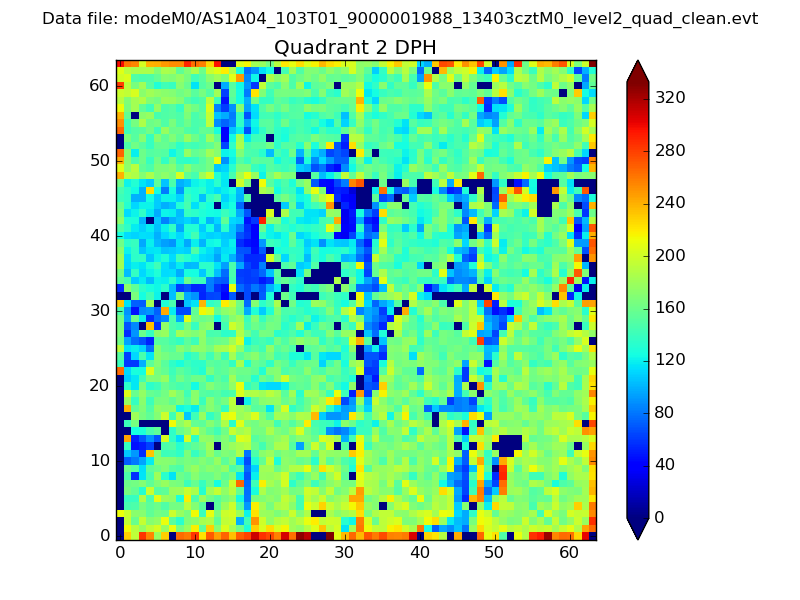
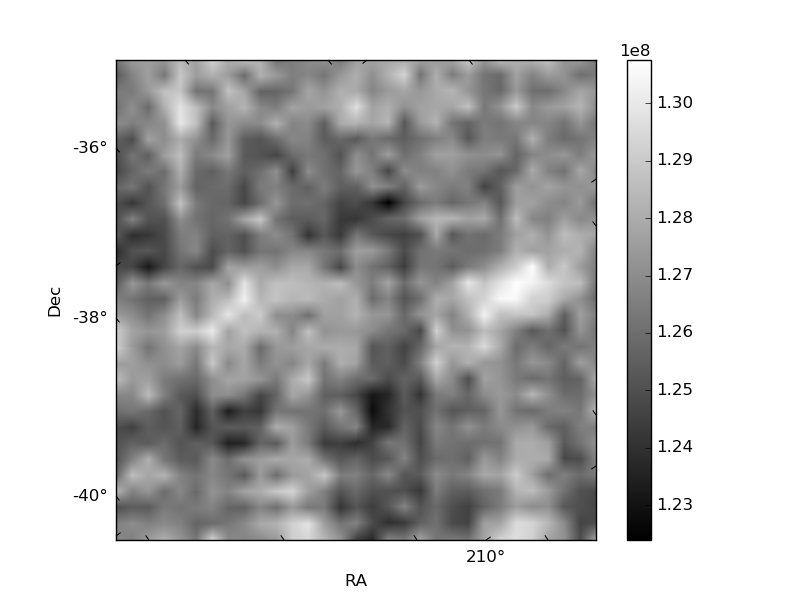
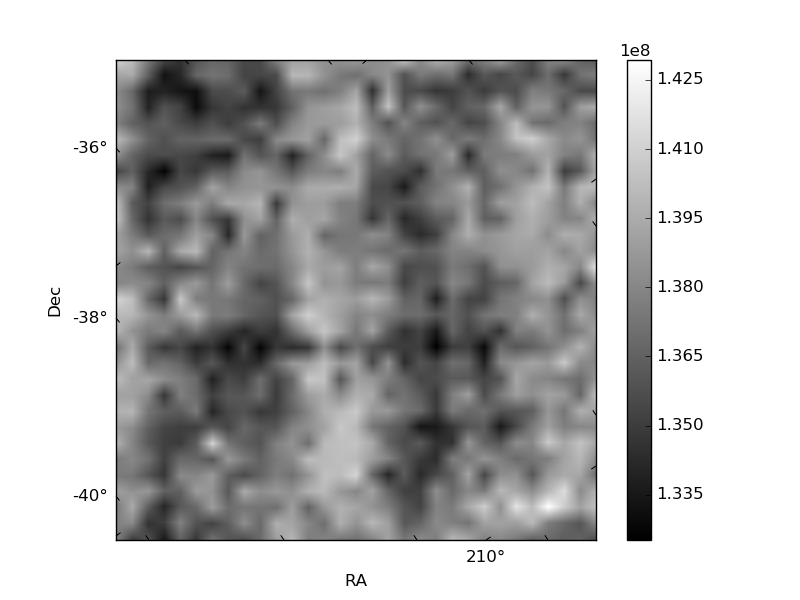
Histogram calculated using DETX and DETY for each event in the final _common_clean file
| Quadrant A | 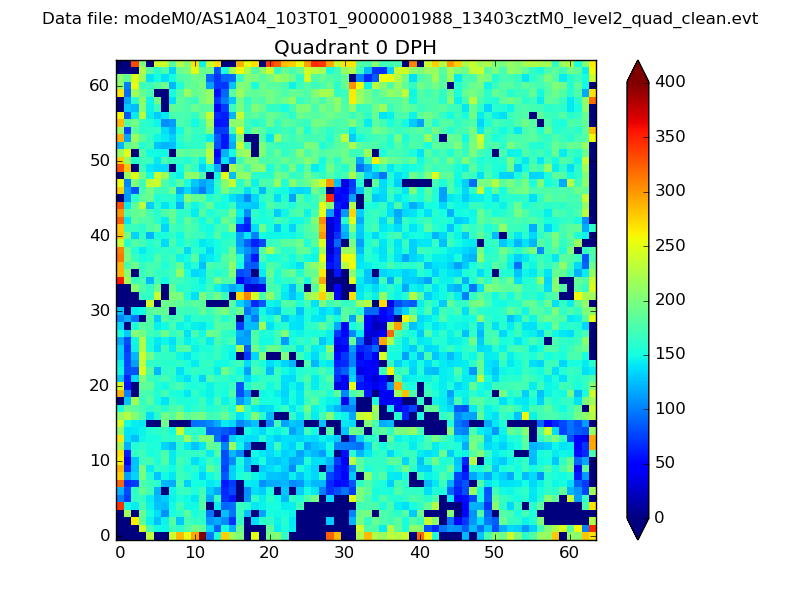 |
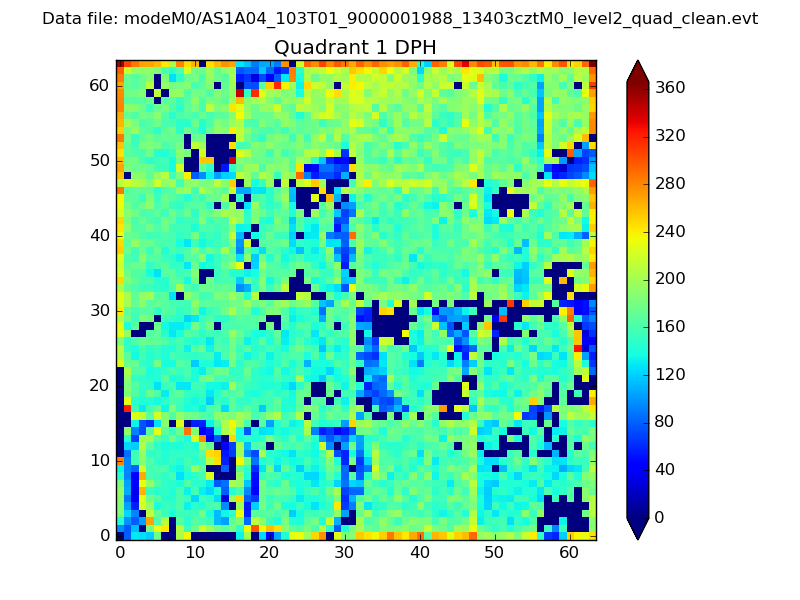 |
Quadrant B |
|---|---|---|---|
| Quadrant D | 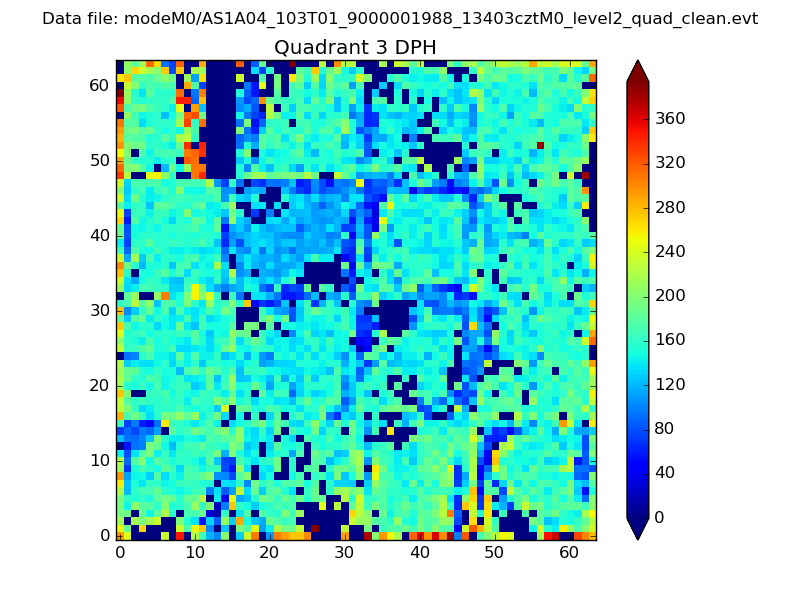 |
 |
Quadrant C |
| Plot type | Count rate plots | Images |
|---|---|---|
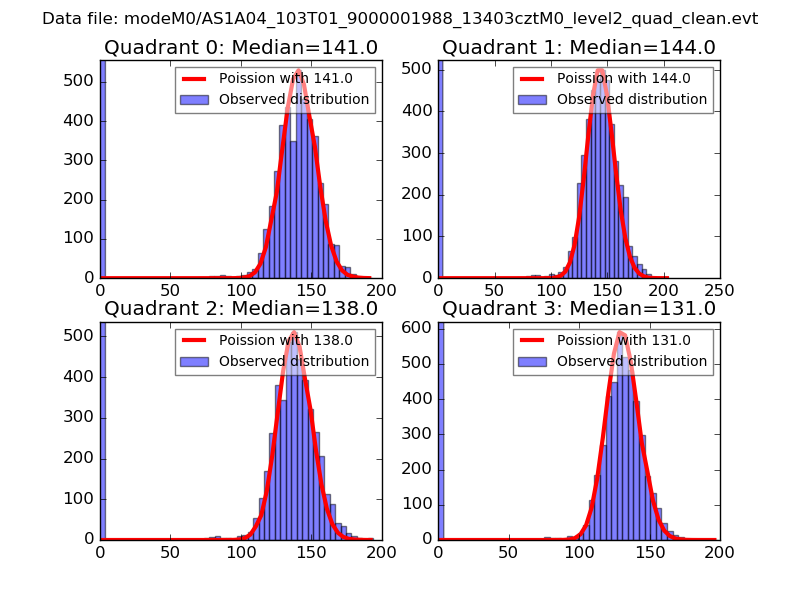
| Comparison with Poisson distribution Blue bars denote a histogram of data divided into 1 sec bins. Red curve is a Poisson curve with rate = median count rate of data. |
 |
 |
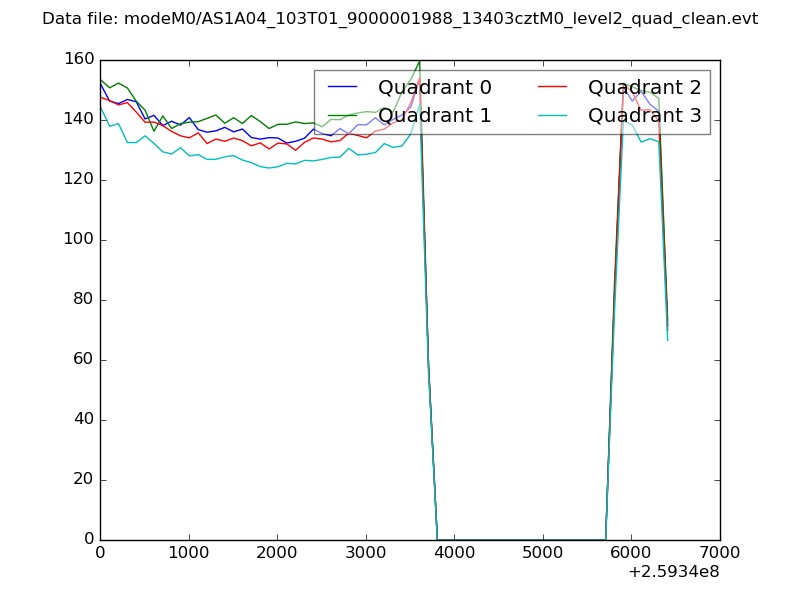
| Quadrant-wise count rates Data is divided into 100 sec bins |
 |
|
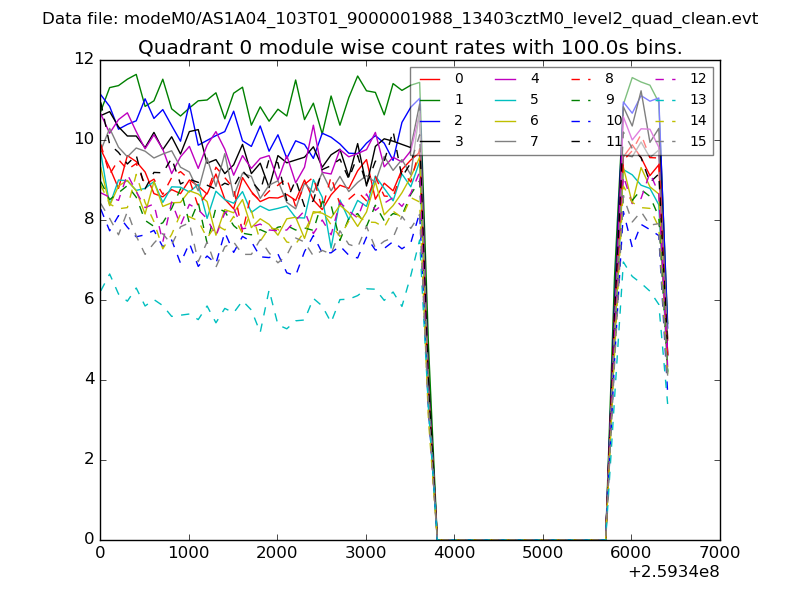
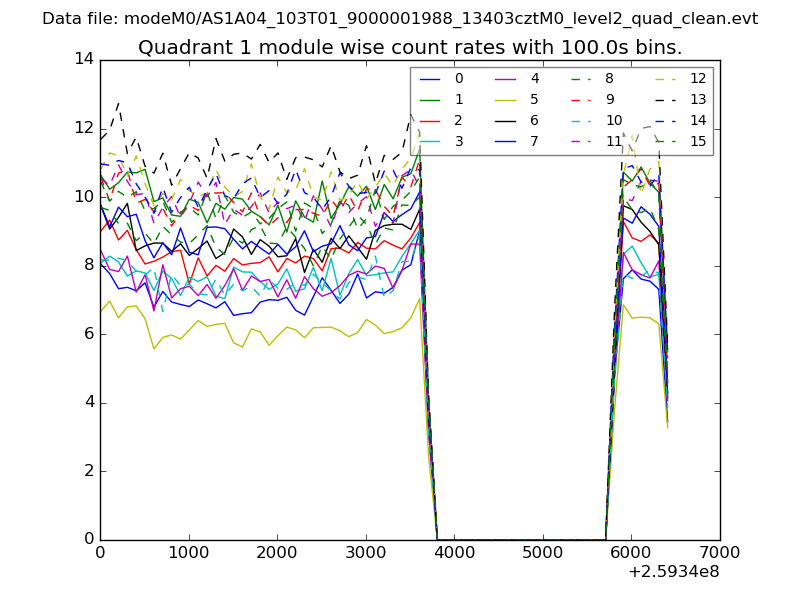
| Module-wise count rates for Quadrant A Data is divided into 100 sec bins |
 |
 |
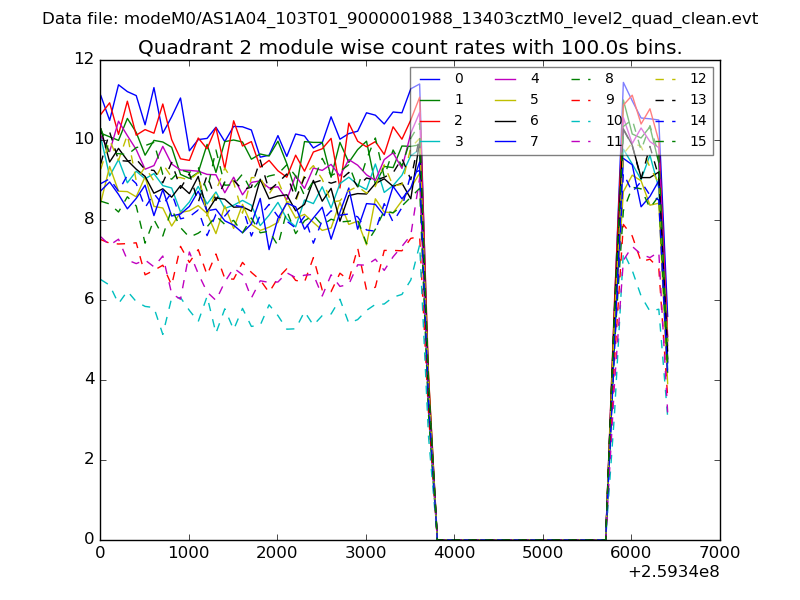
| Module-wise count rates for Quadrant B Data is divided into 100 sec bins |
 |
 |
| Module-wise count rates for Quadrant C Data is divided into 100 sec bins |
 |
 |
| Module-wise count rates for Quadrant D Data is divided into 100 sec bins |
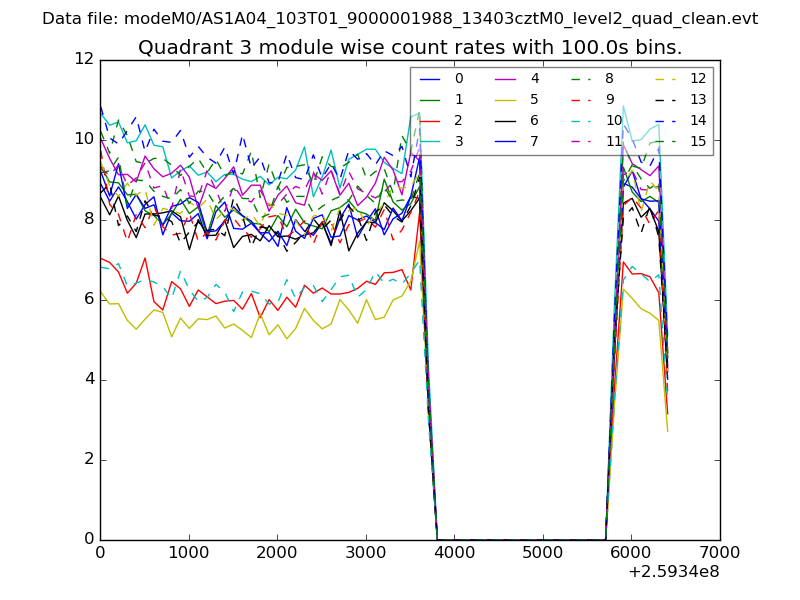 |
 |
| Parameter | Plot |
|---|---|
| CZT HV Monitor |  |
| D_VDD | 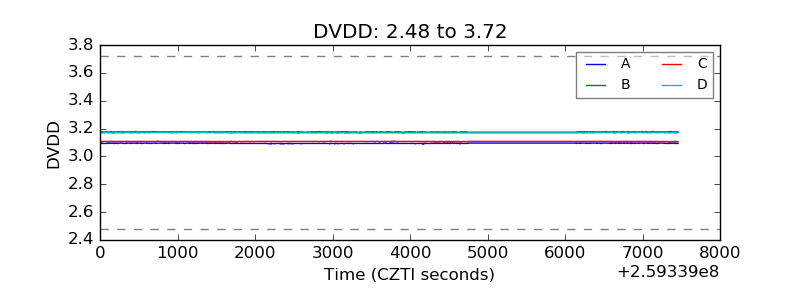 |
| Temperature 1 | 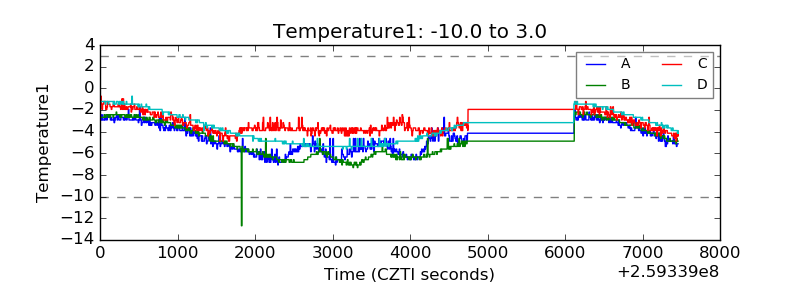 |
| Veto HV Monitor | 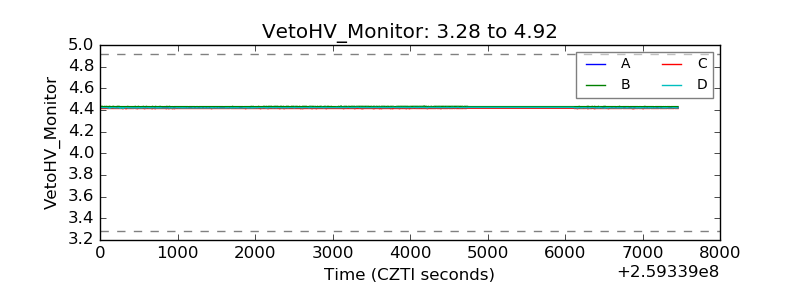 |
| Veto LLD | 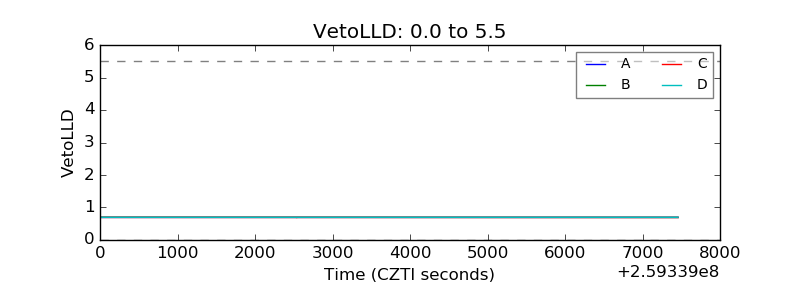 |
| Alpha Counter | 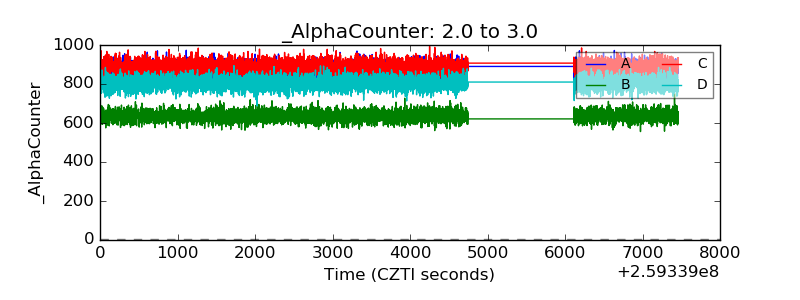 |
| _CPM_Rate | 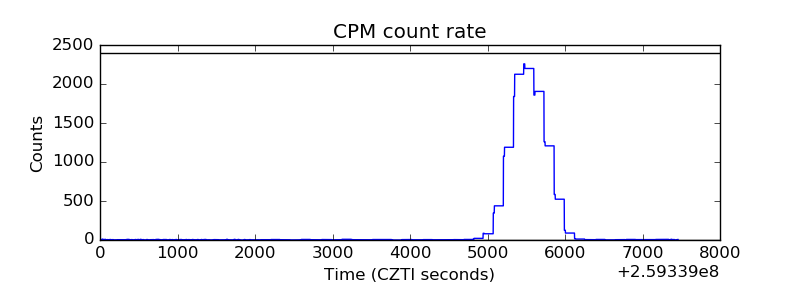 |
| CZT Counter | 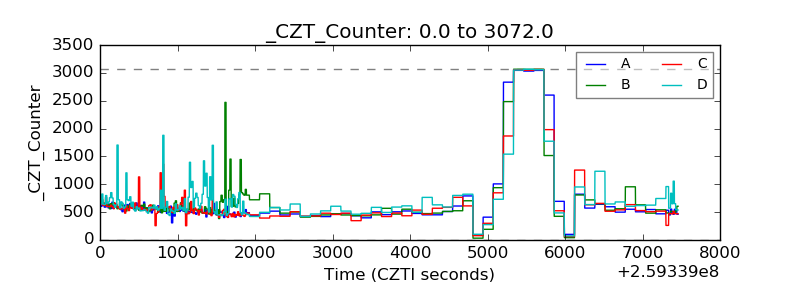 |
| +2.5 Volts monitor |  |
| +5 Volts monitor |  |
| _ROLL_ROT | 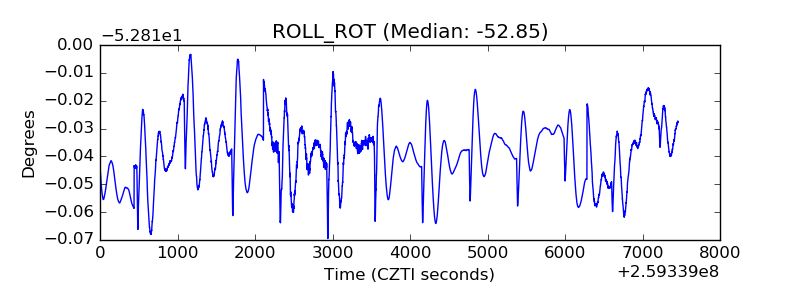 |
| _Roll_DEC | 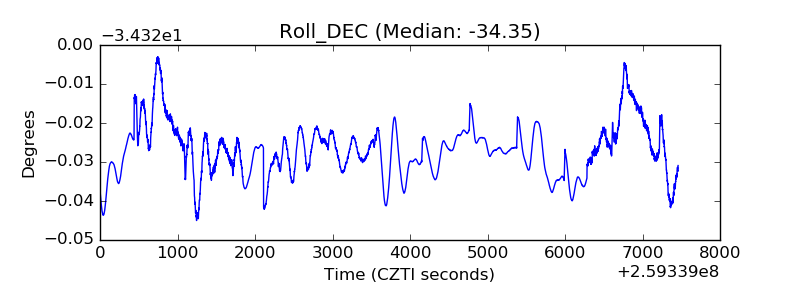 |
| _Roll_RA | 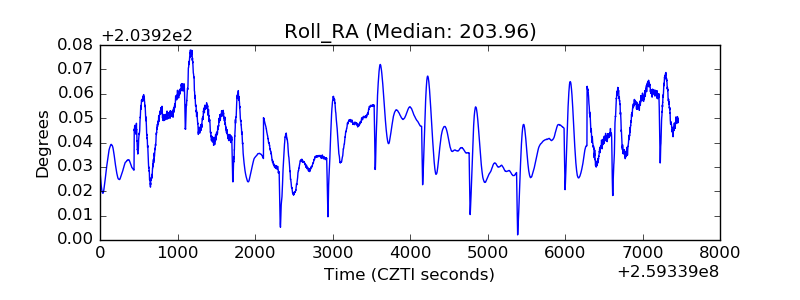 |
| Veto Counter | 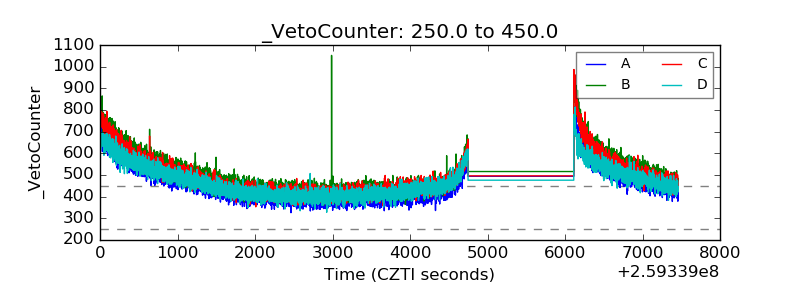 |