| Param | Original file | Final file |
|---|---|---|
| Filename | modeM0/AS1A04_103T01_9000001988_13404cztM0_level2.evt | modeM0/AS1A04_103T01_9000001988_13404cztM0_level2_quad_clean.evt |
| Size (bytes) | 468,290,880 | 95,592,960 |
| Size | 446.6 MB | 91.2 MB |
| Events in quadrant A | 3,040,778 | 627,493 |
| Events in quadrant B | 3,369,271 | 644,641 |
| Events in quadrant C | 3,086,554 | 617,356 |
| Events in quadrant D | 4,270,514 | 578,472 |
| Mode M0 | |||
|---|---|---|---|
| Quadrant | BADHDUFLAG | Total packets | Discarded packets |
| A | 0 | 12960 | 3 |
| B | 0 | 13938 | 2 |
| C | 0 | 12971 | 2 |
| D | 0 | 17005 | 2 |
| Mode SS | |||
|---|---|---|---|
| Quadrant | BADHDUFLAG | Total packets | Discarded packets |
| A | 0 | 124 | 0 |
| B | 0 | 124 | 0 |
| C | 0 | 124 | 0 |
| D | 0 | 124 | 0 |
| Mode M9 | |||
|---|---|---|---|
| Quadrant | BADHDUFLAG | Total packets | Discarded packets |
| A | 0 | 13 | 0 |
| B | 0 | 13 | 0 |
| C | 0 | 13 | 0 |
| D | 0 | 13 | 0 |
| Quadrant | Total seconds | Saturated seconds | Saturation percentage |
|---|---|---|---|
| A | 6117 | 53 | 0.866438% |
| B | 6117 | 183 | 2.991663% |
| C | 6117 | 35 | 0.572176% |
| D | 6117 | 89 | 1.454962% |
Noise dominated data is calculated using 1-second bins in cleaned event files. If a bin has >2000 counts, and if more than 50% of those come from <1% of pixels, then it is considered to be noise-dominated and hence unusable.
| Quadrant | # 1 sec bins | Bins with >0 counts | Bins with >2000 counts | High rate bins dominated by noise | Noise dominated (total time) | Noise dominated (detector-on time) | Marked lightcurve |
|---|---|---|---|---|---|---|---|
| A | 7398 | 6118 | 0 | 0 | 0.00% | 0.00% | 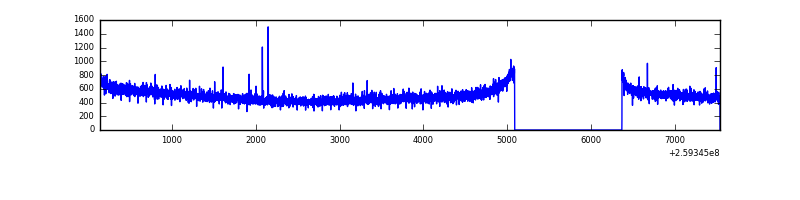 |
| B | 7398 | 6118 | 31 | 31 | 0.42% | 0.51% | 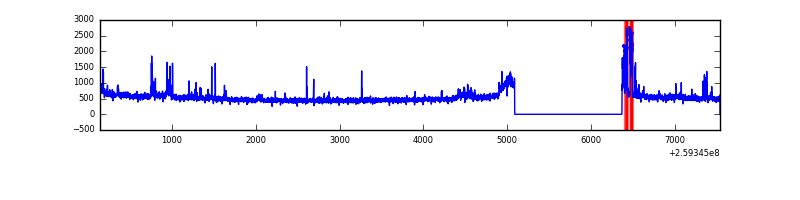 |
| C | 7398 | 6119 | 2 | 2 | 0.03% | 0.03% | 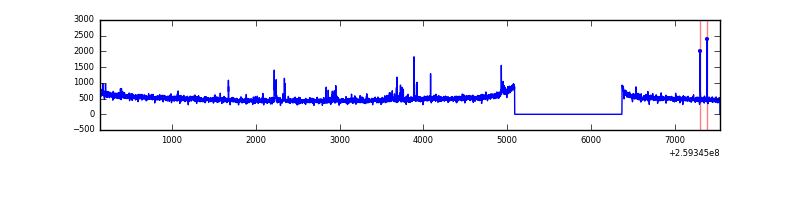 |
| D | 7398 | 6118 | 76 | 76 | 1.03% | 1.24% | 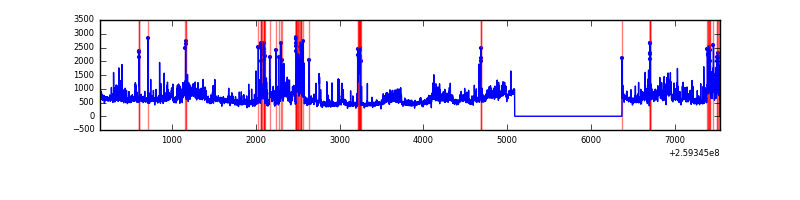 |
Top three noisy pixels from each quadrant. If the there are fewer than three noisy pixels in the level2.evt file, extra rows are filled as -1
| Pixel properties | Quadrant properties | ||||||
|---|---|---|---|---|---|---|---|
| Quadrant | DetID | PixID | Counts | Sigma | Mean | Median | Sigma |
| A | 15 | 69 | 8907 | 51.22 | 787 | 774 | 158.8 |
| A | 0 | 226 | 7035 | 39.43 | 787 | 774 | 158.8 |
| A | 12 | 194 | 5979 | 32.78 | 787 | 774 | 158.8 |
| B | 3 | 64 | 206614 | 1395.9 | 787 | 767 | 147.5 |
| B | 4 | 142 | 61961 | 414.97 | 787 | 767 | 147.5 |
| B | 12 | 111 | 16631 | 107.58 | 787 | 767 | 147.5 |
| C | 14 | 220 | 67221 | 380.6 | 758 | 764 | 174.6 |
| C | 3 | 233 | 66742 | 377.86 | 758 | 764 | 174.6 |
| C | 13 | 61 | 5553 | 27.42 | 758 | 764 | 174.6 |
| D | 8 | 195 | 797278 | 4478.99 | 743 | 722 | 177.8 |
| D | 1 | 52 | 576379 | 3236.88 | 743 | 722 | 177.8 |
| D | 2 | 136 | 33963 | 186.91 | 743 | 722 | 177.8 |
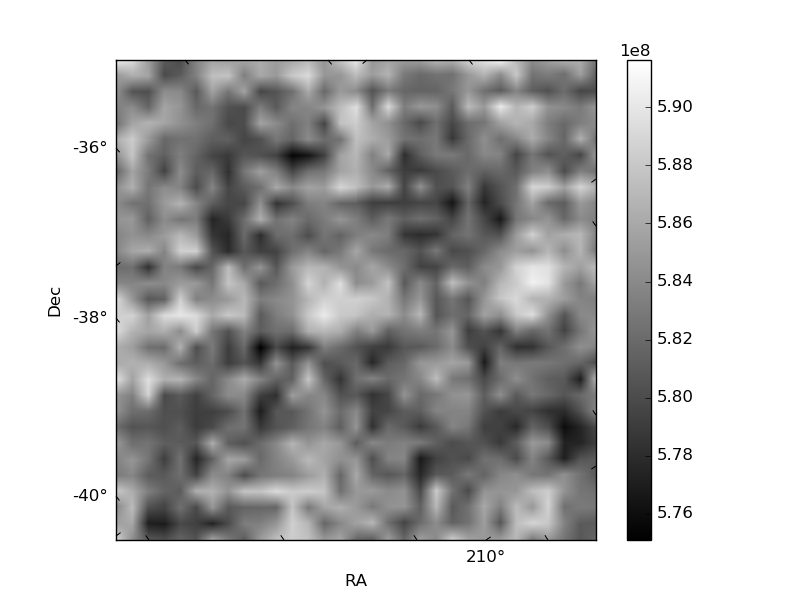
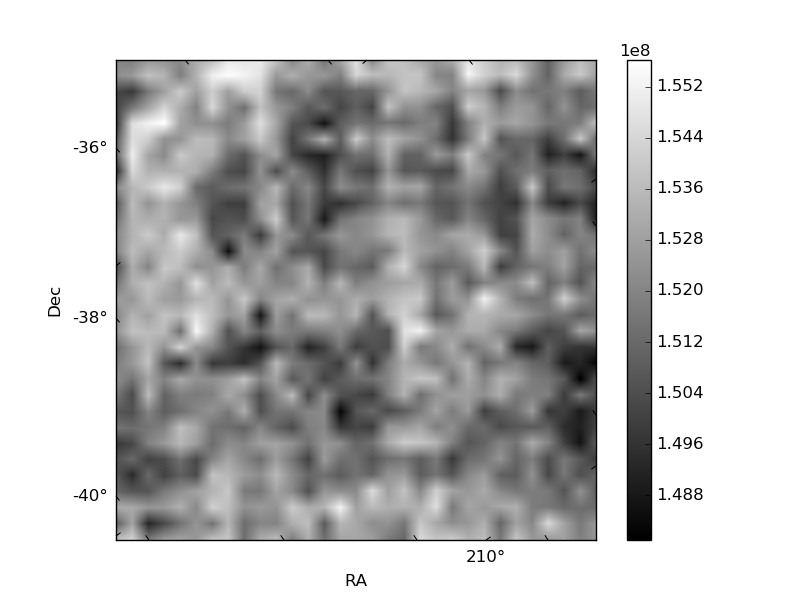
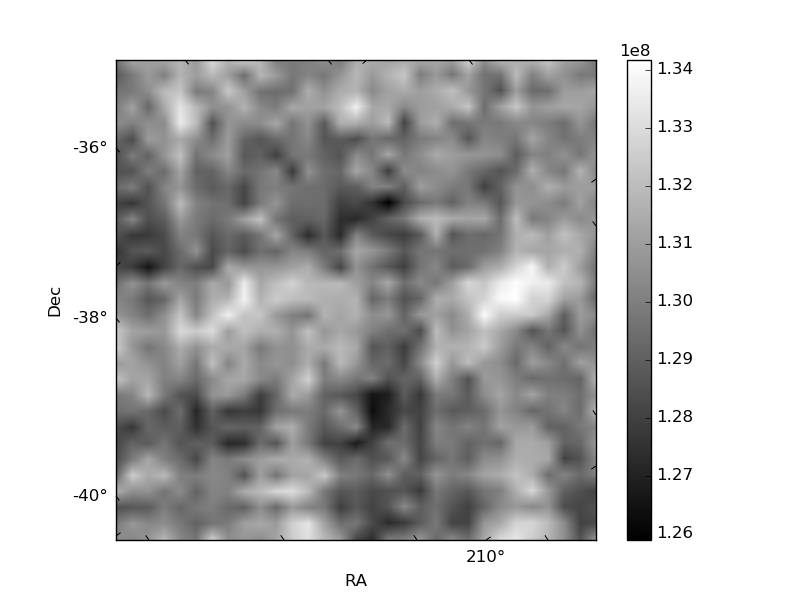
Histogram calculated using DETX and DETY for each event in the final _common_clean file
| Quadrant A | 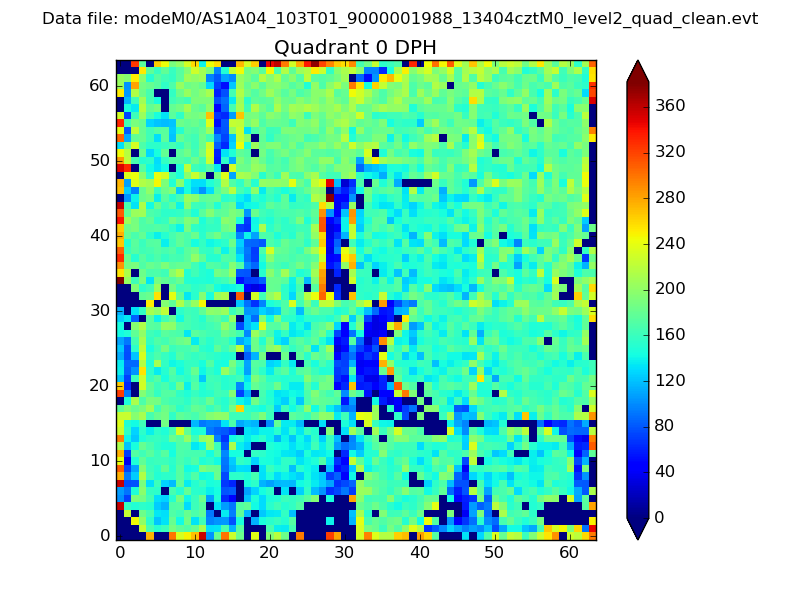 |
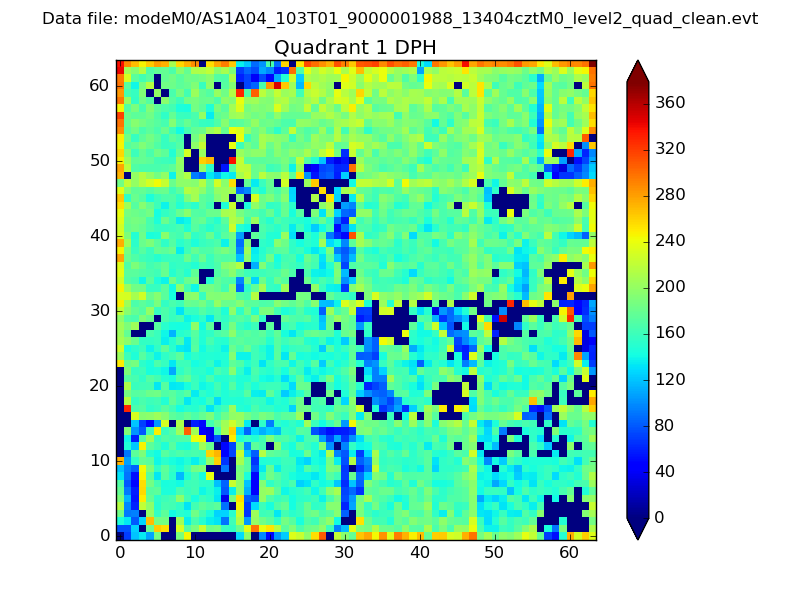 |
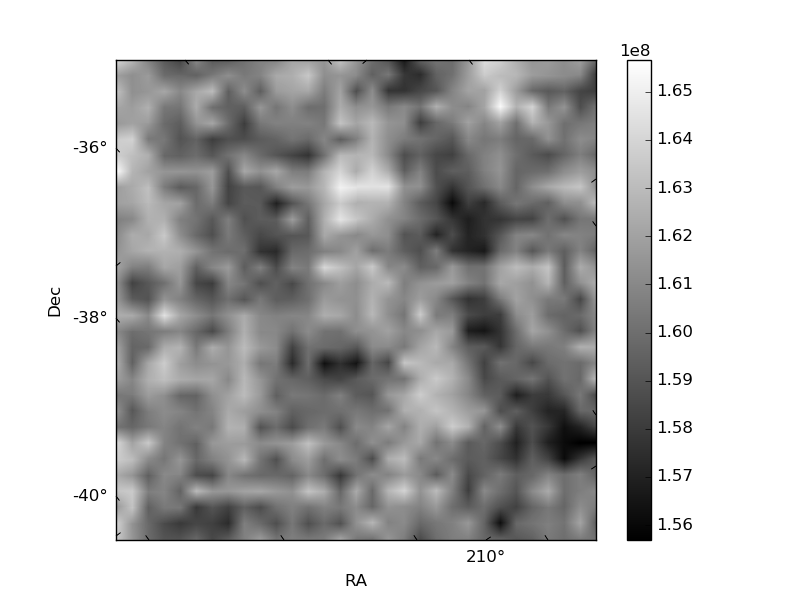
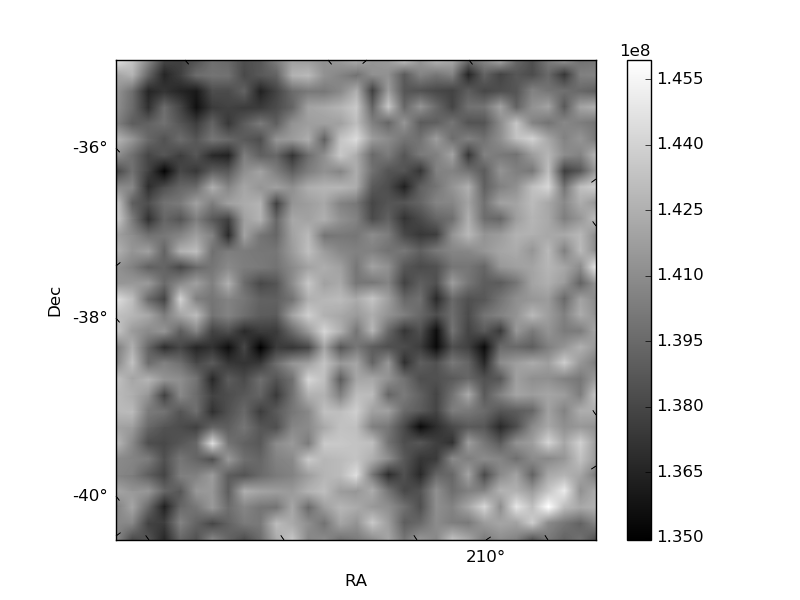
Quadrant B |
|---|---|---|---|
| Quadrant D | 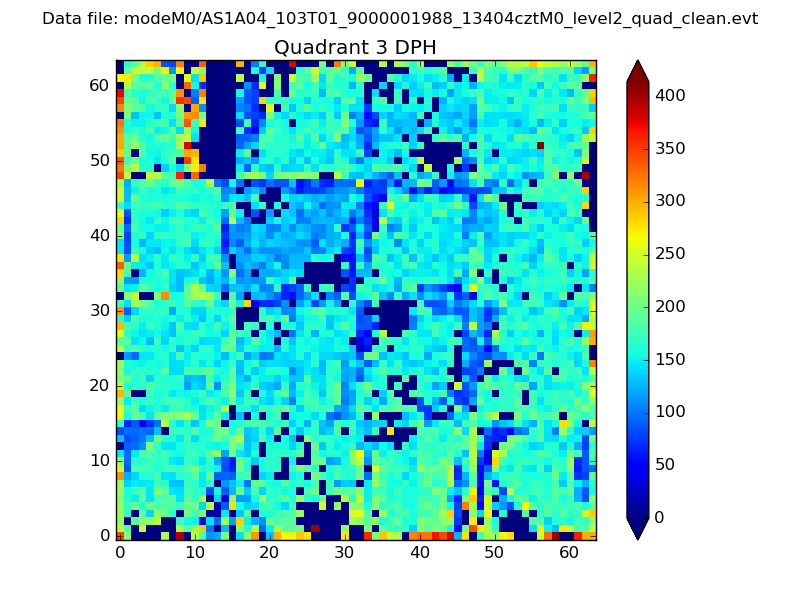 |
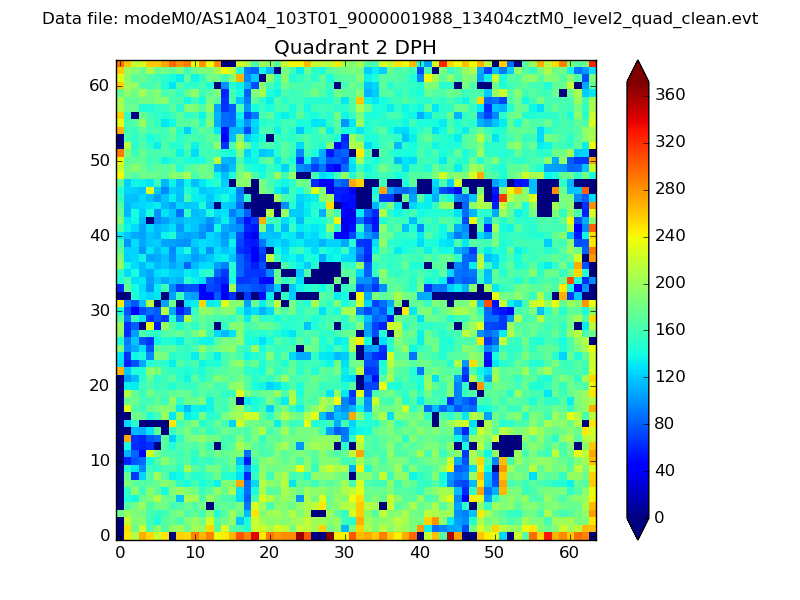 |
Quadrant C |
| Plot type | Count rate plots | Images |
|---|---|---|
| Comparison with Poisson distribution Blue bars denote a histogram of data divided into 1 sec bins. Red curve is a Poisson curve with rate = median count rate of data. |
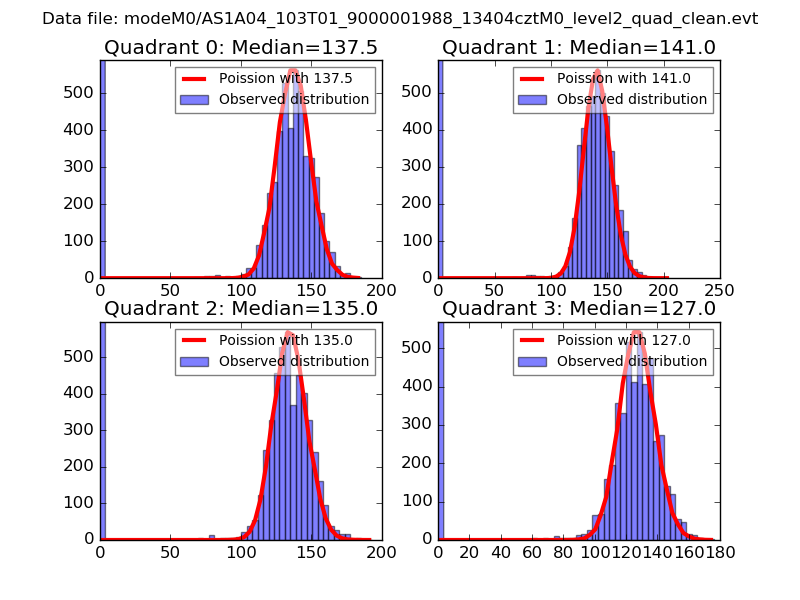 |
 |
| Quadrant-wise count rates Data is divided into 100 sec bins |
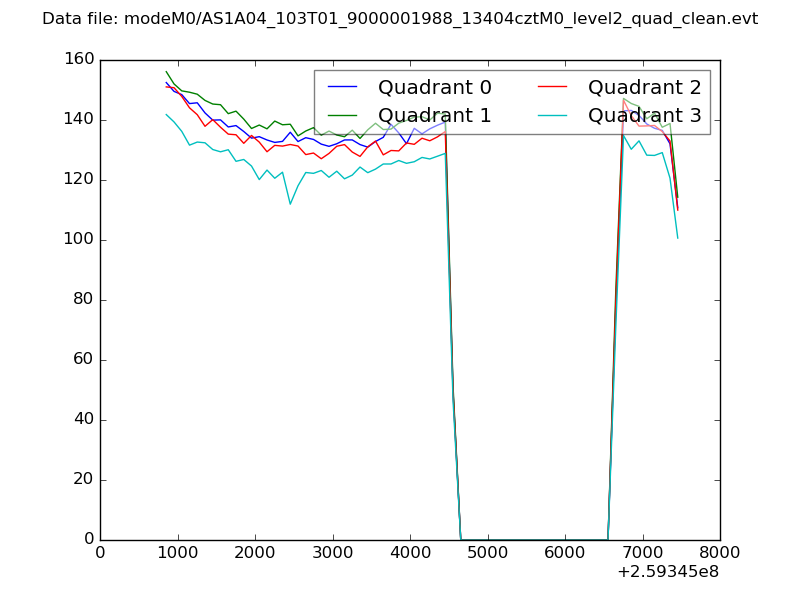 |
|
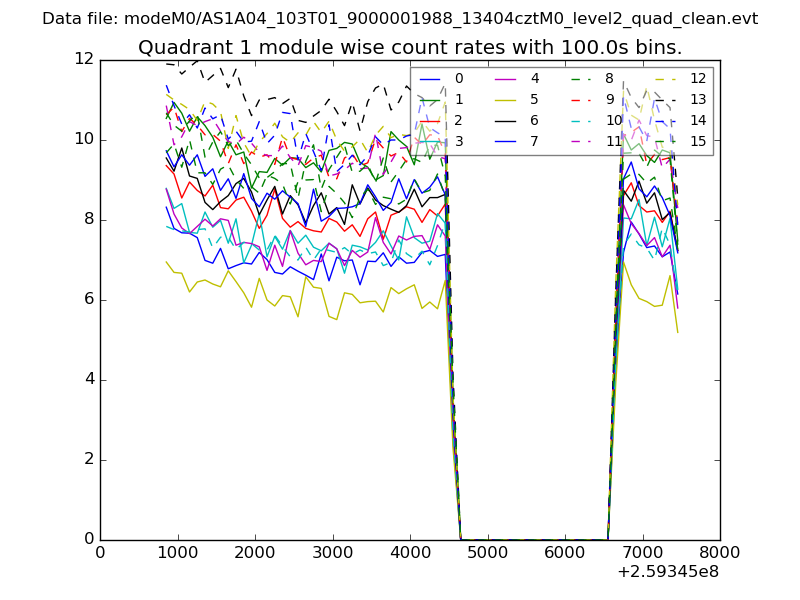
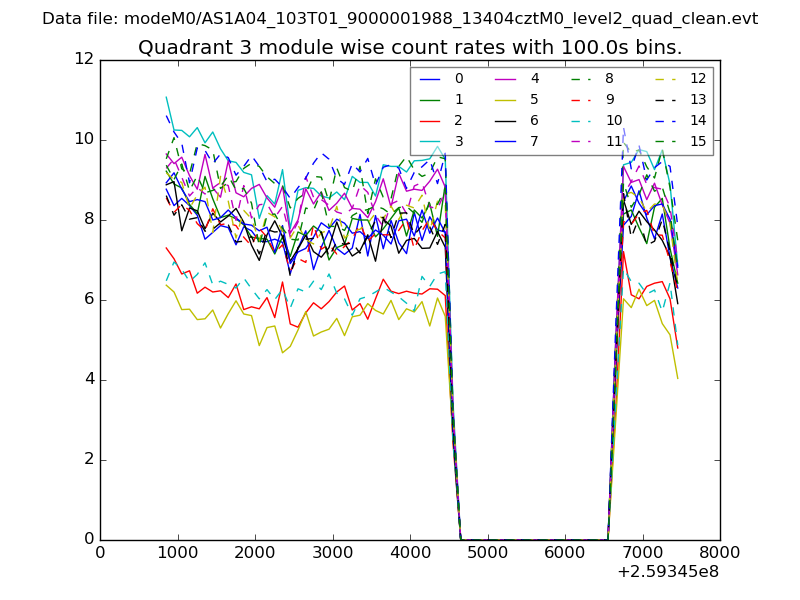
| Module-wise count rates for Quadrant A Data is divided into 100 sec bins |
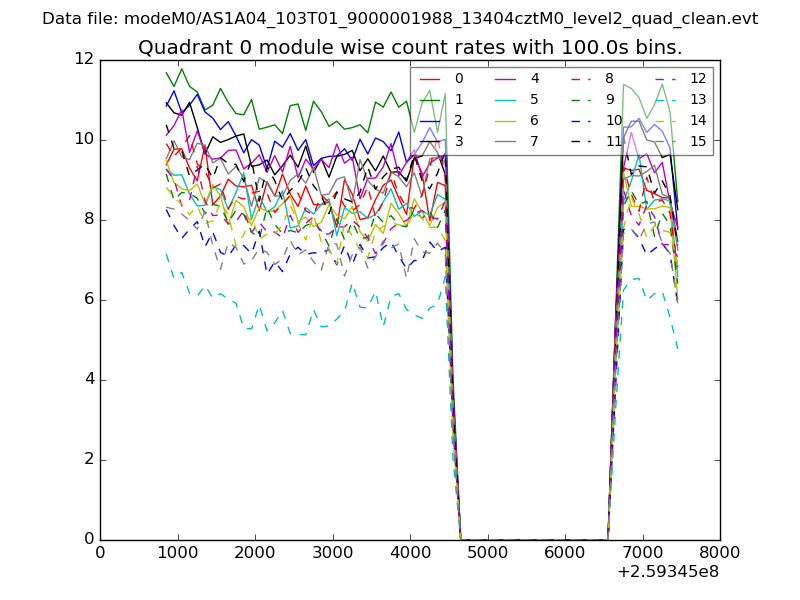 |
 |
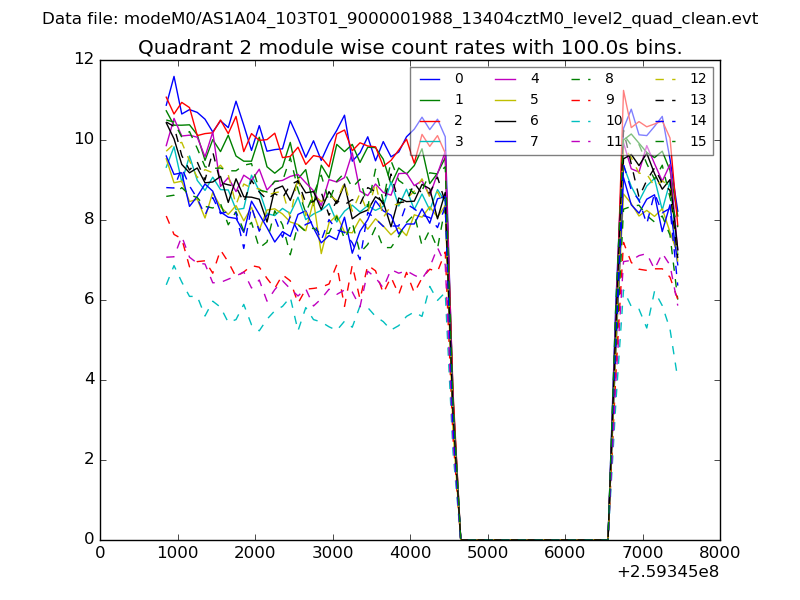
| Module-wise count rates for Quadrant B Data is divided into 100 sec bins |
 |
 |
| Module-wise count rates for Quadrant C Data is divided into 100 sec bins |
 |
 |
| Module-wise count rates for Quadrant D Data is divided into 100 sec bins |
 |
 |
| Parameter | Plot |
|---|---|
| CZT HV Monitor |  |
| D_VDD | 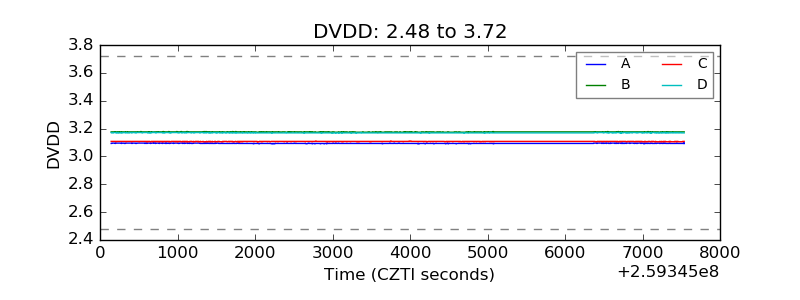 |
| Temperature 1 | 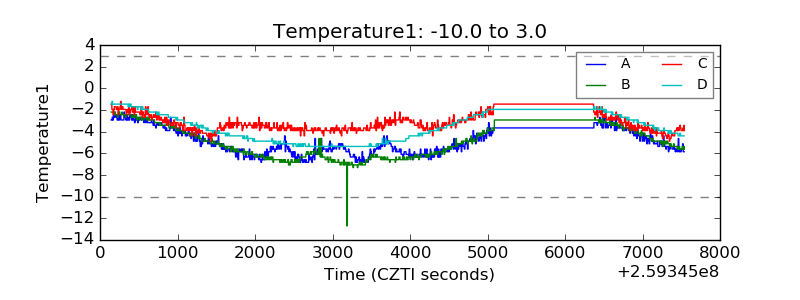 |
| Veto HV Monitor | 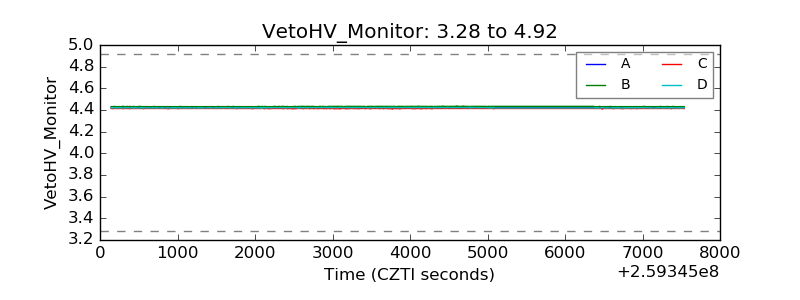 |
| Veto LLD | 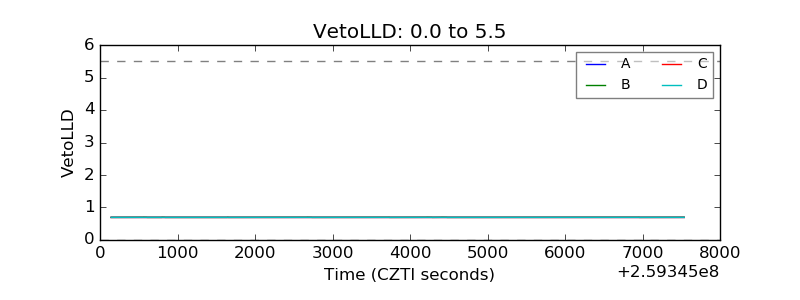 |
| Alpha Counter | 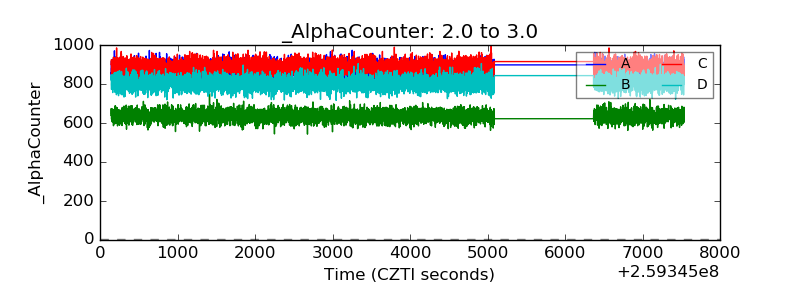 |
| _CPM_Rate | 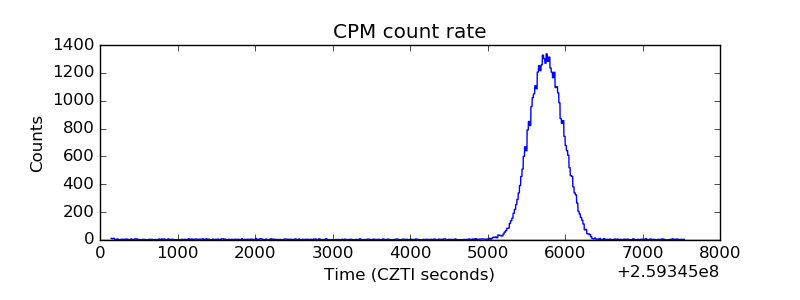 |
| CZT Counter | 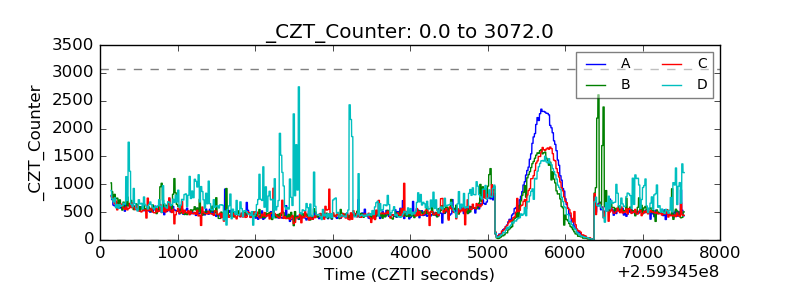 |
| +2.5 Volts monitor |  |
| +5 Volts monitor | 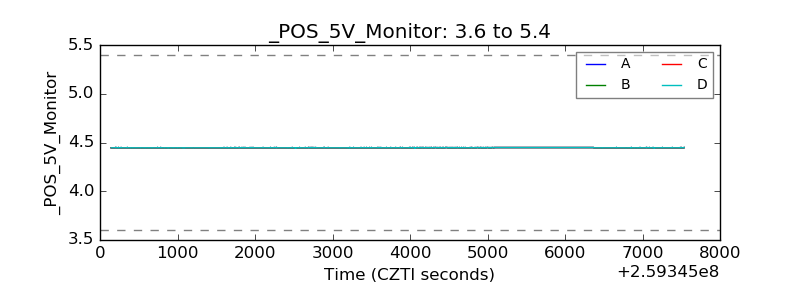 |
| _ROLL_ROT | 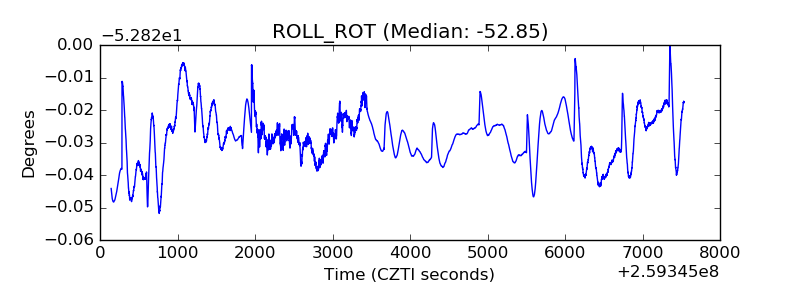 |
| _Roll_DEC | 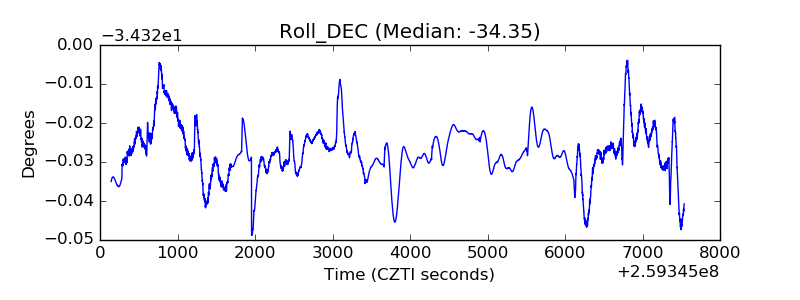 |
| _Roll_RA | 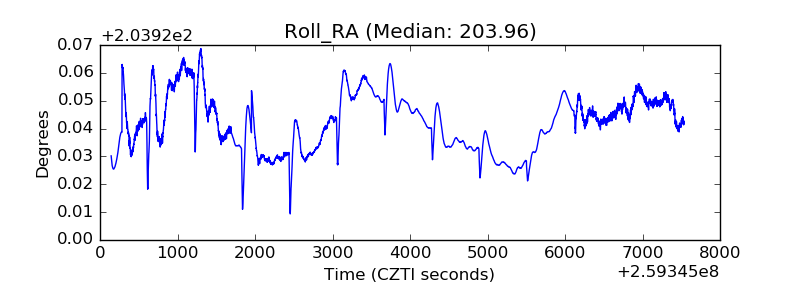 |
| Veto Counter | 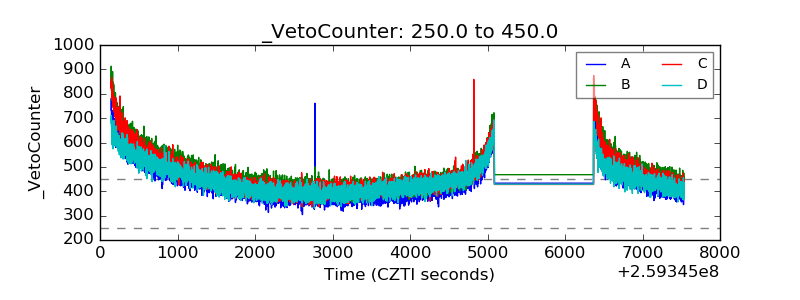 |