| Param | Original file | Final file |
|---|---|---|
| Filename | modeM0/AS1A04_103T01_9000001988_13405cztM0_level2.evt | modeM0/AS1A04_103T01_9000001988_13405cztM0_level2_quad_clean.evt |
| Size (bytes) | 480,035,520 | 102,000,960 |
| Size | 457.8 MB | 97.3 MB |
| Events in quadrant A | 3,111,201 | 667,247 |
| Events in quadrant B | 3,482,757 | 686,307 |
| Events in quadrant C | 3,127,594 | 660,887 |
| Events in quadrant D | 4,369,968 | 616,414 |
| Mode M0 | |||
|---|---|---|---|
| Quadrant | BADHDUFLAG | Total packets | Discarded packets |
| A | 0 | 13598 | 3 |
| B | 0 | 14628 | 2 |
| C | 0 | 13600 | 2 |
| D | 0 | 17538 | 2 |
| Mode SS | |||
|---|---|---|---|
| Quadrant | BADHDUFLAG | Total packets | Discarded packets |
| A | 0 | 134 | 0 |
| B | 0 | 134 | 0 |
| C | 0 | 134 | 0 |
| D | 0 | 134 | 0 |
| Mode M9 | |||
|---|---|---|---|
| Quadrant | BADHDUFLAG | Total packets | Discarded packets |
| A | 0 | 13 | 0 |
| B | 0 | 13 | 0 |
| C | 0 | 13 | 0 |
| D | 0 | 14 | 0 |
| Quadrant | Total seconds | Saturated seconds | Saturation percentage |
|---|---|---|---|
| A | 6571 | 60 | 0.913103% |
| B | 6571 | 157 | 2.389286% |
| C | 6571 | 26 | 0.395678% |
| D | 6571 | 140 | 2.130574% |
Noise dominated data is calculated using 1-second bins in cleaned event files. If a bin has >2000 counts, and if more than 50% of those come from <1% of pixels, then it is considered to be noise-dominated and hence unusable.
| Quadrant | # 1 sec bins | Bins with >0 counts | Bins with >2000 counts | High rate bins dominated by noise | Noise dominated (total time) | Noise dominated (detector-on time) | Marked lightcurve |
|---|---|---|---|---|---|---|---|
| A | 7637 | 6572 | 0 | 0 | 0.00% | 0.00% | 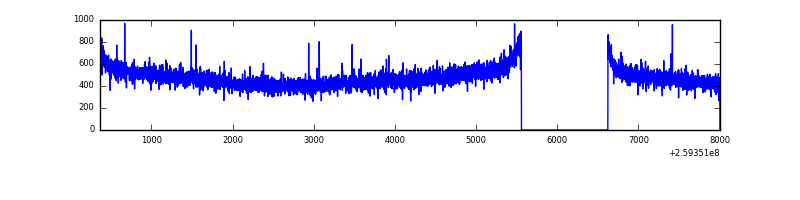 |
| B | 7636 | 6571 | 43 | 43 | 0.56% | 0.65% | 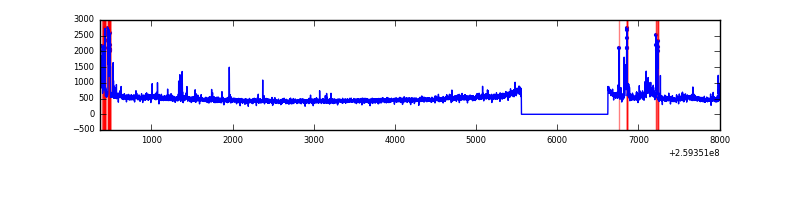 |
| C | 7637 | 6572 | 4 | 4 | 0.05% | 0.06% | 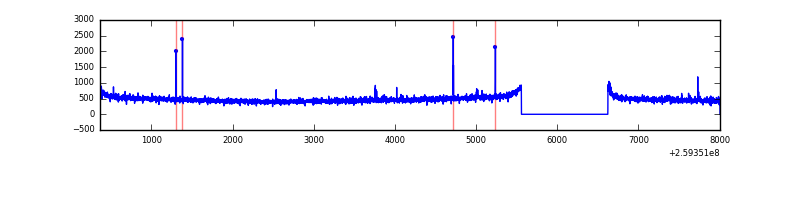 |
| D | 7637 | 6572 | 115 | 115 | 1.51% | 1.75% | 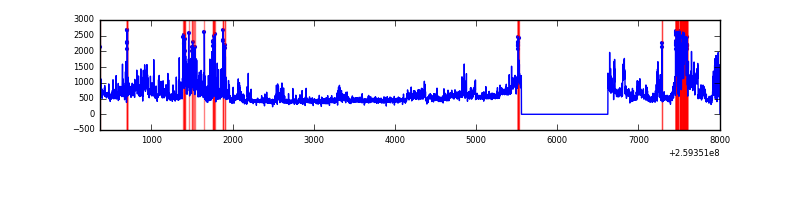 |
Top three noisy pixels from each quadrant. If the there are fewer than three noisy pixels in the level2.evt file, extra rows are filled as -1
| Pixel properties | Quadrant properties | ||||||
|---|---|---|---|---|---|---|---|
| Quadrant | DetID | PixID | Counts | Sigma | Mean | Median | Sigma |
| A | 0 | 226 | 7234 | 39.3 | 806 | 789 | 164.0 |
| A | 12 | 194 | 6078 | 32.25 | 806 | 789 | 164.0 |
| A | 1 | 162 | 5240 | 27.14 | 806 | 789 | 164.0 |
| B | 3 | 64 | 124855 | 809.27 | 809 | 789 | 153.3 |
| B | 10 | 244 | 114749 | 743.35 | 809 | 789 | 153.3 |
| B | 4 | 142 | 52578 | 337.81 | 809 | 789 | 153.3 |
| C | 3 | 233 | 53729 | 295.99 | 780 | 787 | 178.9 |
| C | 14 | 220 | 31465 | 171.51 | 780 | 787 | 178.9 |
| C | 13 | 61 | 5624 | 27.04 | 780 | 787 | 178.9 |
| D | 8 | 195 | 799834 | 4355.57 | 762 | 740 | 183.5 |
| D | 1 | 52 | 378561 | 2059.36 | 762 | 740 | 183.5 |
| D | 2 | 136 | 223179 | 1212.43 | 762 | 740 | 183.5 |
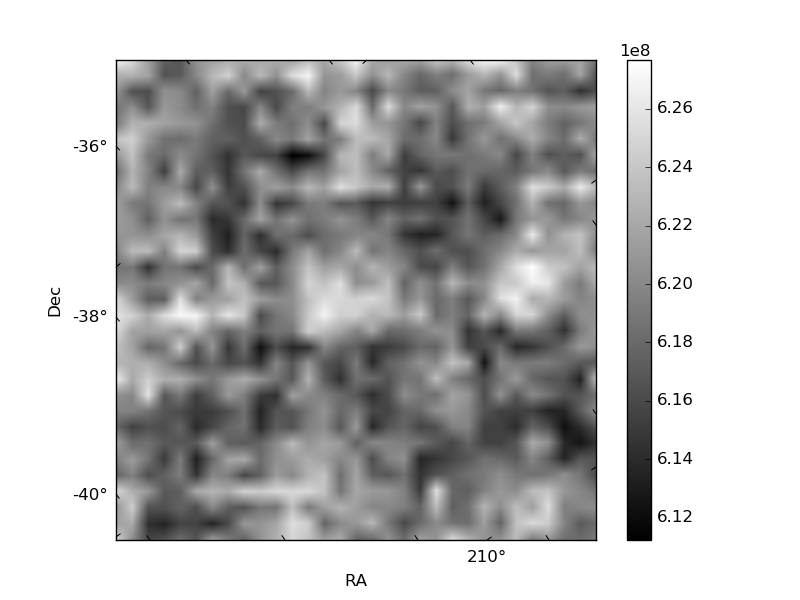
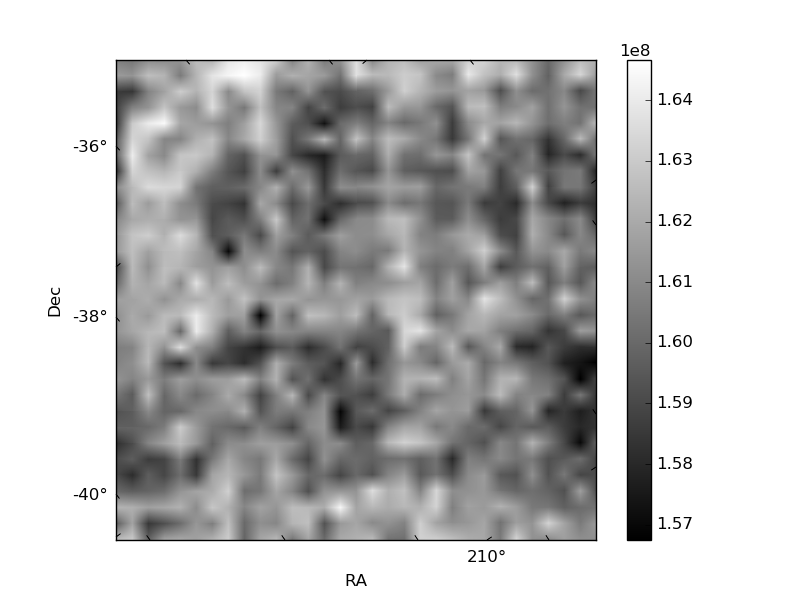
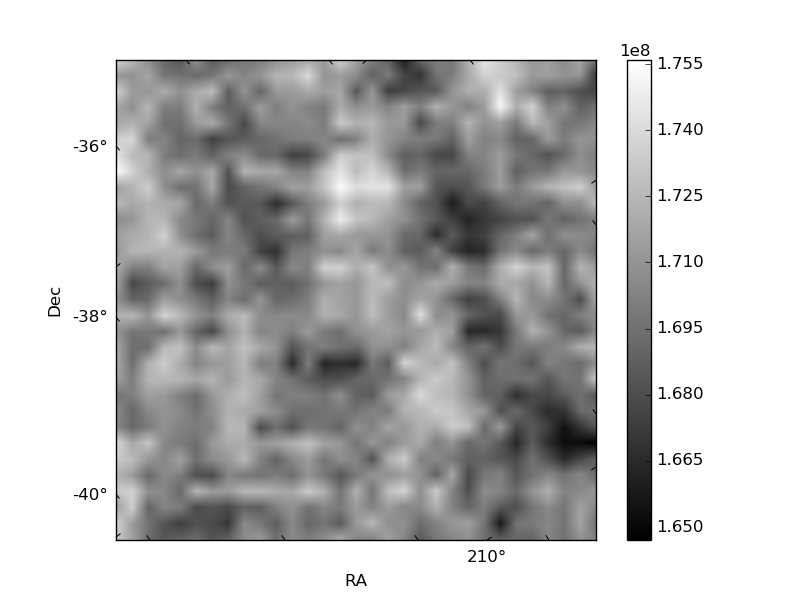
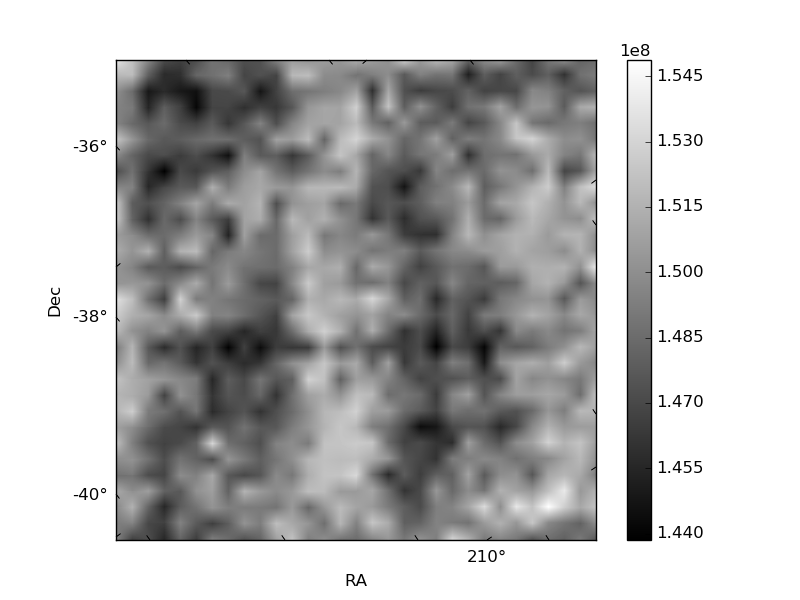
Histogram calculated using DETX and DETY for each event in the final _common_clean file
| Quadrant A | 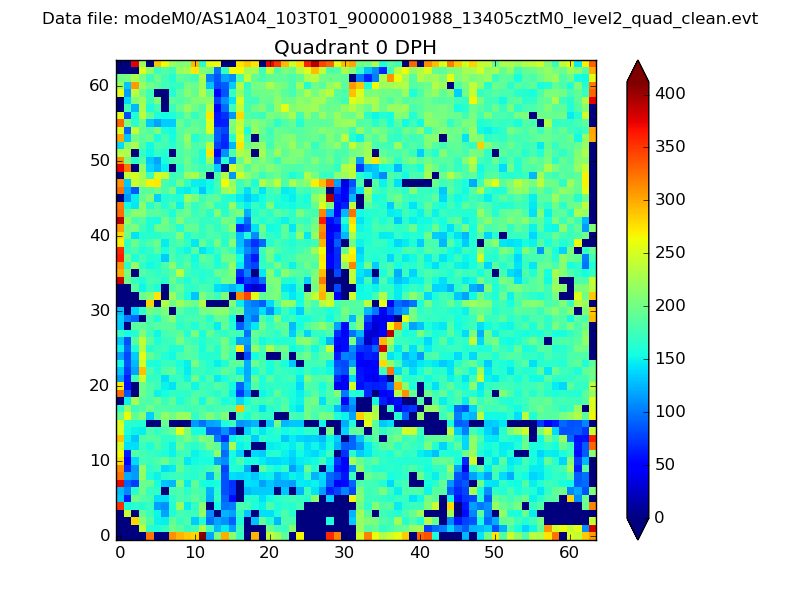 |
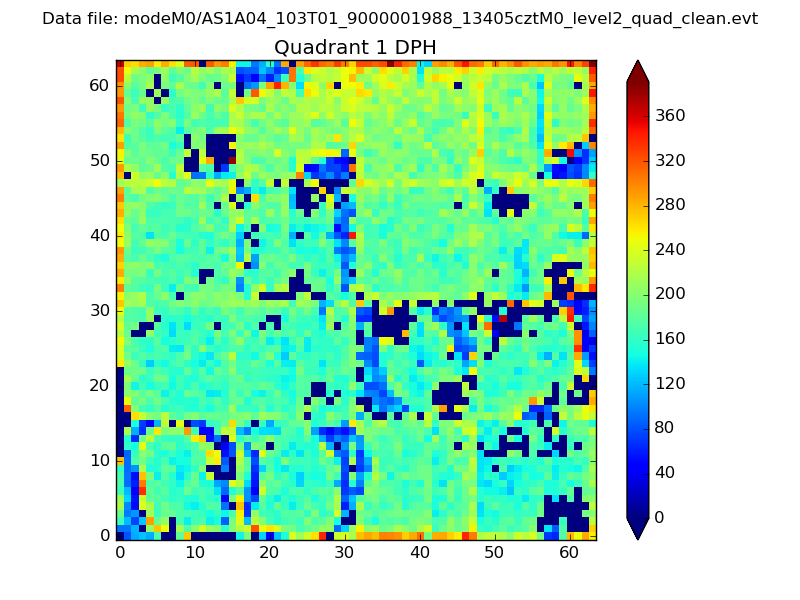 |
Quadrant B |
|---|---|---|---|
| Quadrant D | 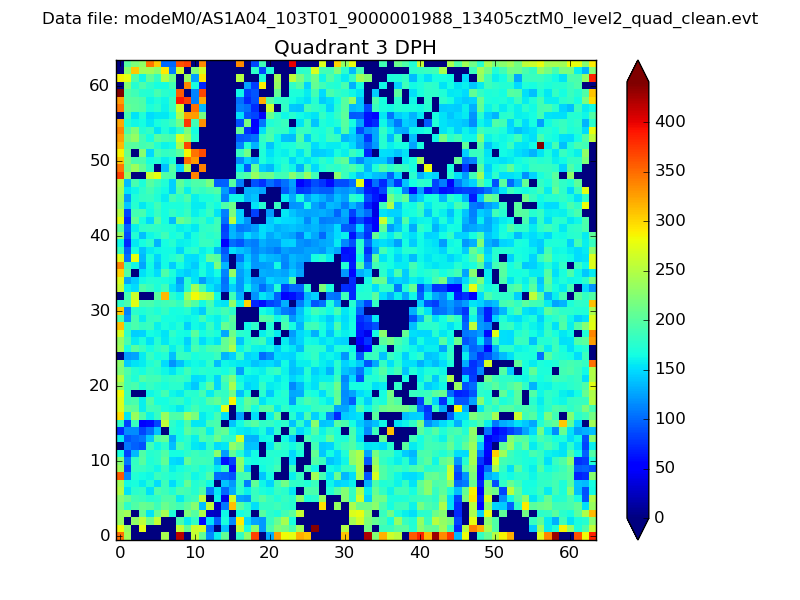 |
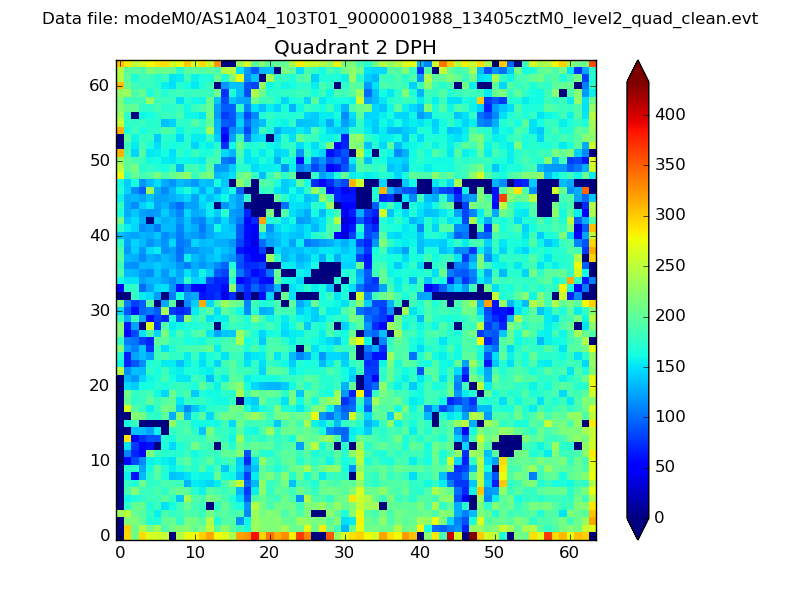 |
Quadrant C |
| Plot type | Count rate plots | Images |
|---|---|---|
| Comparison with Poisson distribution Blue bars denote a histogram of data divided into 1 sec bins. Red curve is a Poisson curve with rate = median count rate of data. |
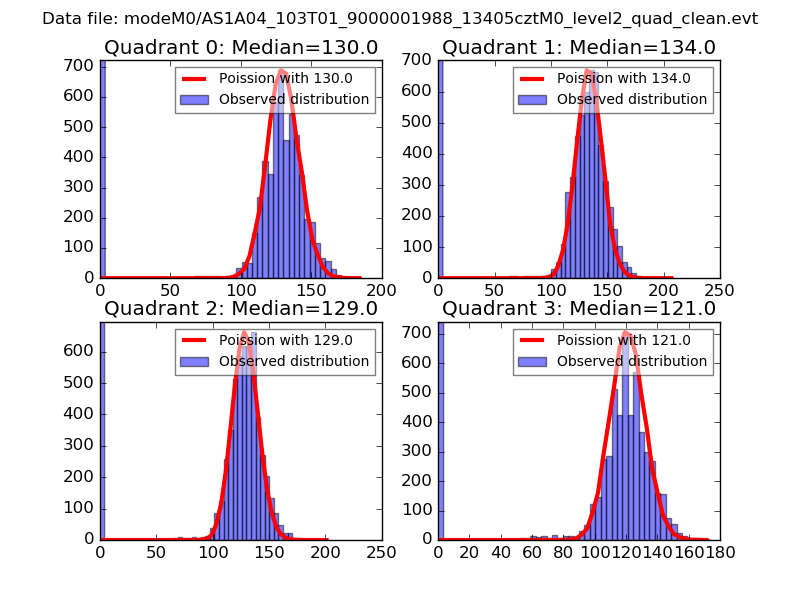 |
 |
| Quadrant-wise count rates Data is divided into 100 sec bins |
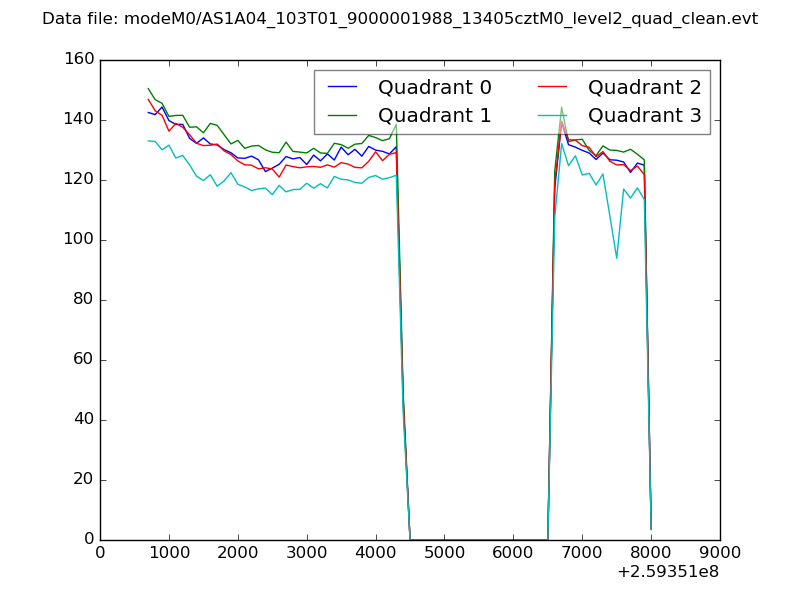 |
|
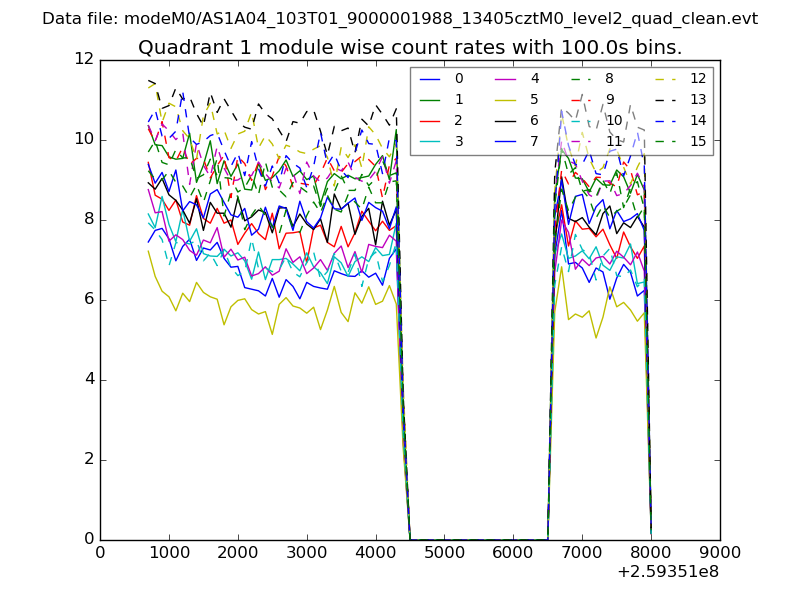
| Module-wise count rates for Quadrant A Data is divided into 100 sec bins |
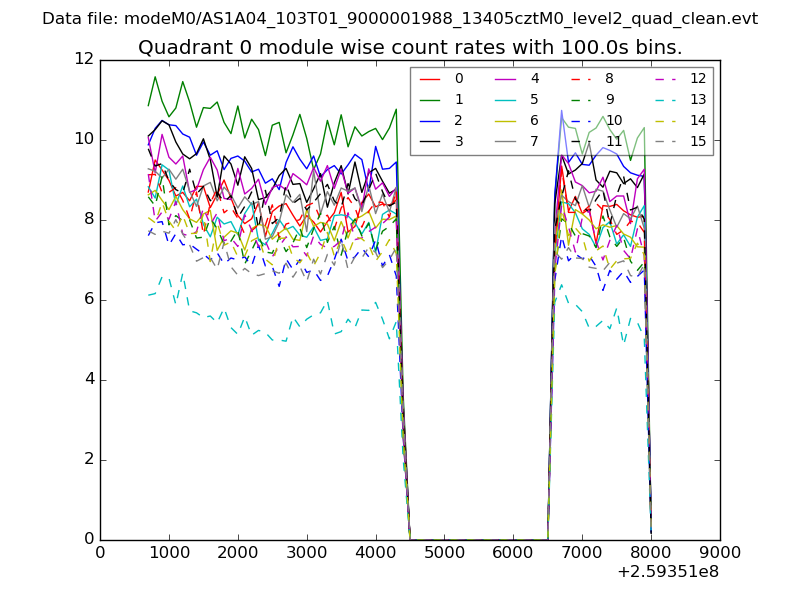 |
 |
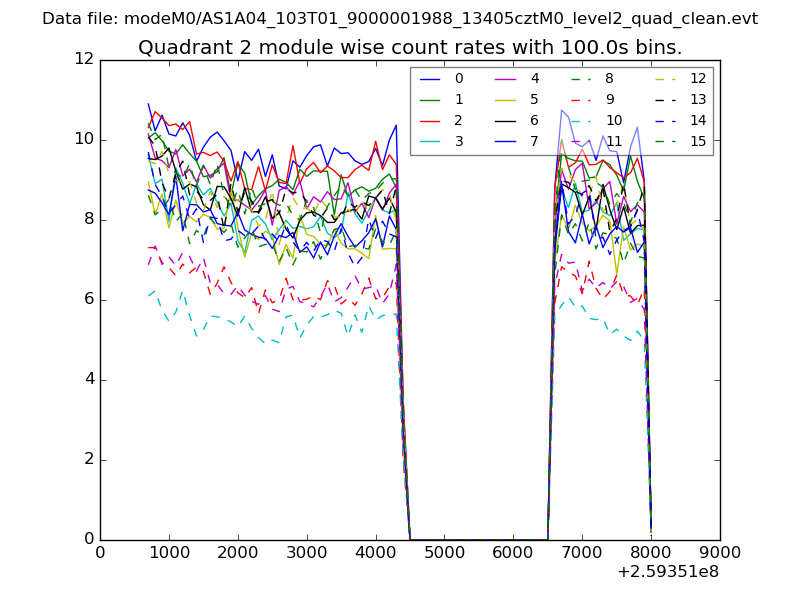
| Module-wise count rates for Quadrant B Data is divided into 100 sec bins |
 |
 |
| Module-wise count rates for Quadrant C Data is divided into 100 sec bins |
 |
 |
| Module-wise count rates for Quadrant D Data is divided into 100 sec bins |
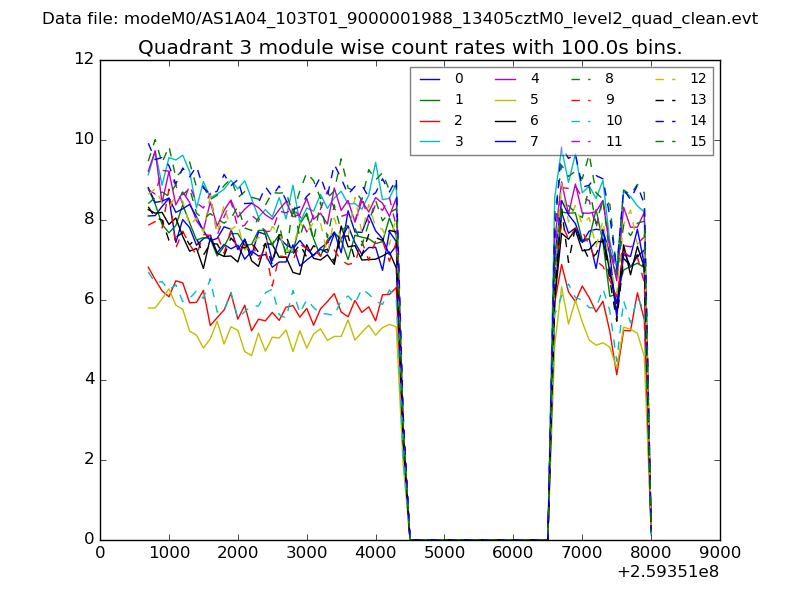 |
 |
| Parameter | Plot |
|---|---|
| CZT HV Monitor | 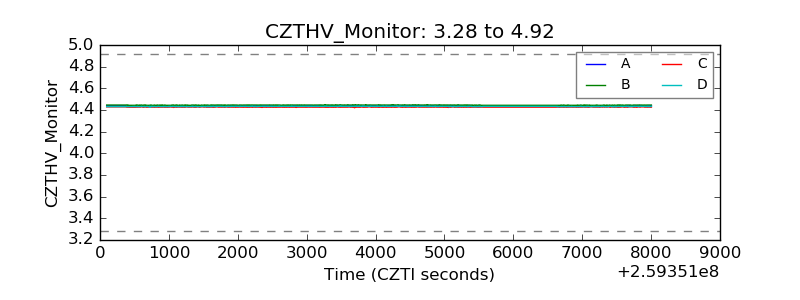 |
| D_VDD | 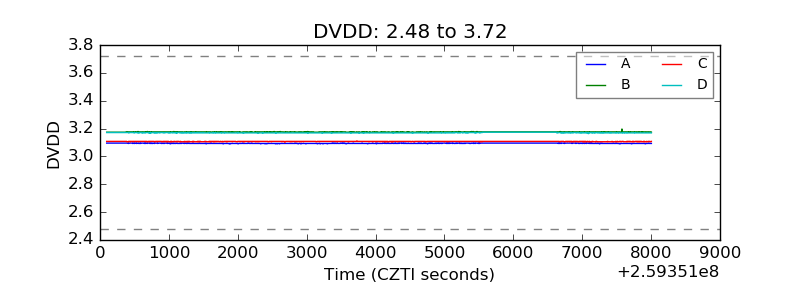 |
| Temperature 1 | 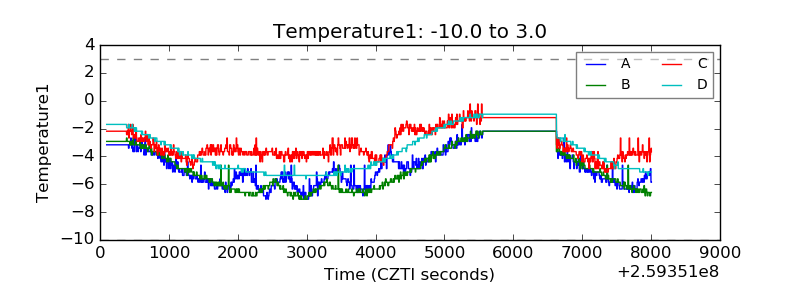 |
| Veto HV Monitor | 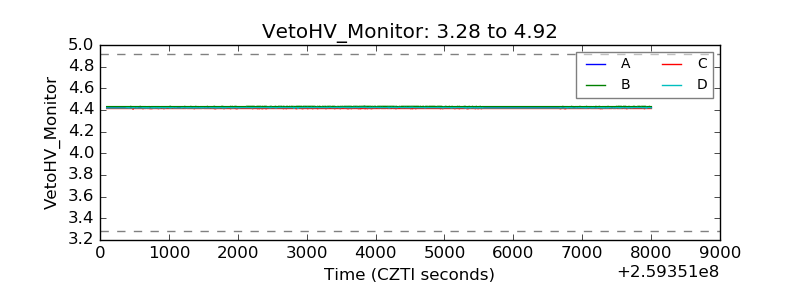 |
| Veto LLD | 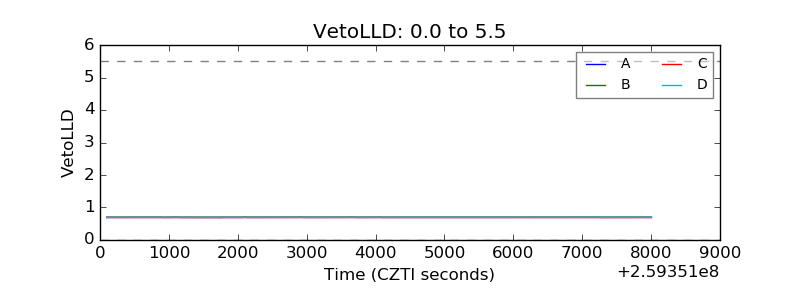 |
| Alpha Counter | 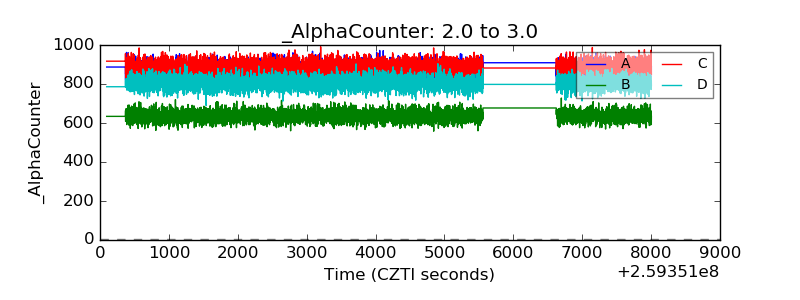 |
| _CPM_Rate | 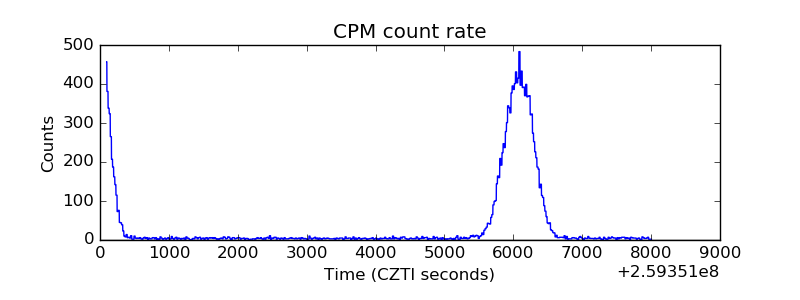 |
| CZT Counter | 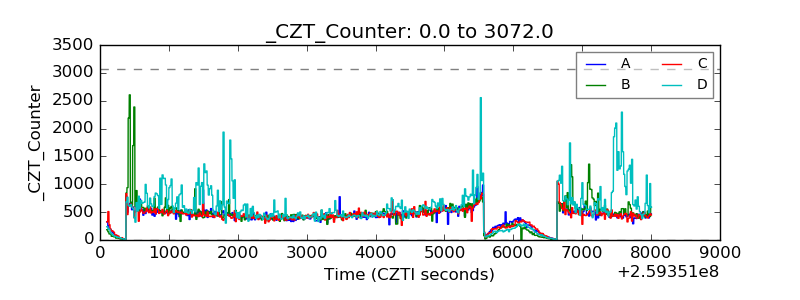 |
| +2.5 Volts monitor |  |
| +5 Volts monitor |  |
| _ROLL_ROT | 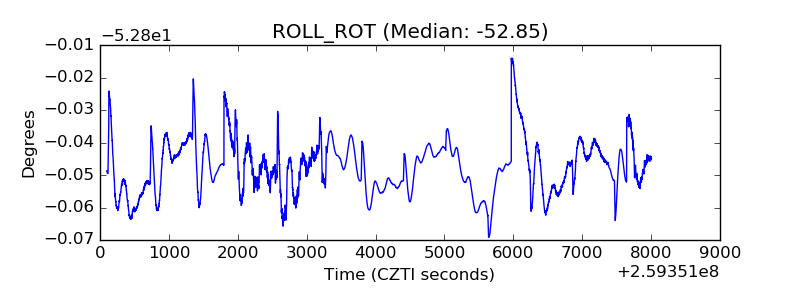 |
| _Roll_DEC | 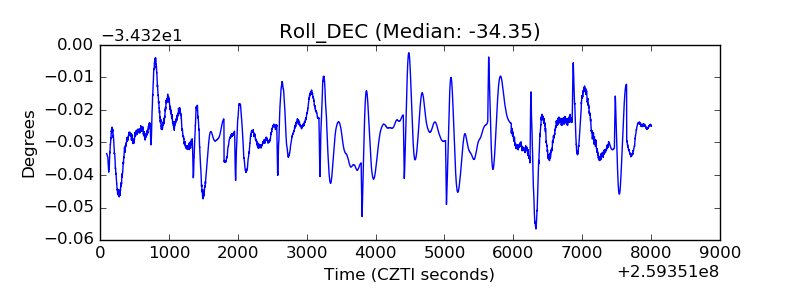 |
| _Roll_RA | 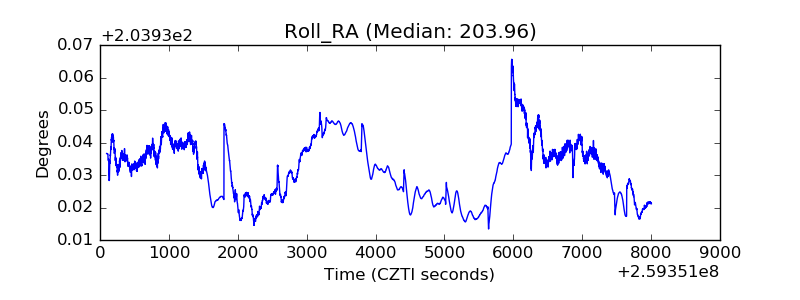 |
| Veto Counter | 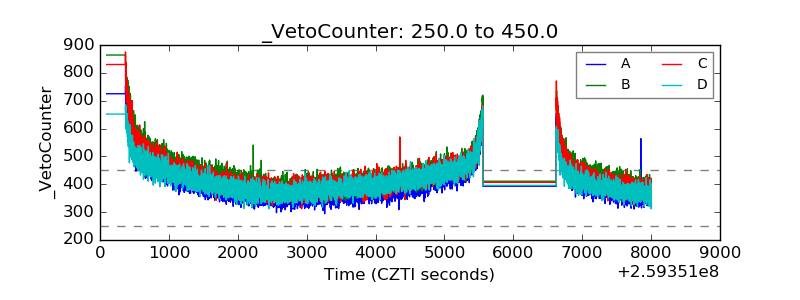 |