| Param | Original file | Final file |
|---|---|---|
| Filename | modeM0/AS1A04_103T01_9000001988_13406cztM0_level2.evt | modeM0/AS1A04_103T01_9000001988_13406cztM0_level2_quad_clean.evt |
| Size (bytes) | 530,714,880 | 102,029,760 |
| Size | 506.1 MB | 97.3 MB |
| Events in quadrant A | 3,275,429 | 659,567 |
| Events in quadrant B | 4,141,326 | 669,453 |
| Events in quadrant C | 3,318,098 | 654,542 |
| Events in quadrant D | 4,856,018 | 611,714 |
| Mode M0 | |||
|---|---|---|---|
| Quadrant | BADHDUFLAG | Total packets | Discarded packets |
| A | 0 | 14610 | 3 |
| B | 0 | 16832 | 2 |
| C | 0 | 14592 | 2 |
| D | 0 | 19278 | 2 |
| Mode SS | |||
|---|---|---|---|
| Quadrant | BADHDUFLAG | Total packets | Discarded packets |
| A | 0 | 144 | 0 |
| B | 0 | 144 | 0 |
| C | 0 | 144 | 0 |
| D | 0 | 144 | 0 |
| Mode M9 | |||
|---|---|---|---|
| Quadrant | BADHDUFLAG | Total packets | Discarded packets |
| A | 0 | 15 | 0 |
| B | 0 | 15 | 0 |
| C | 0 | 15 | 0 |
| D | 0 | 16 | 0 |
| Quadrant | Total seconds | Saturated seconds | Saturation percentage |
|---|---|---|---|
| A | 7105 | 18 | 0.253343% |
| B | 7105 | 188 | 2.646024% |
| C | 7105 | 5 | 0.070373% |
| D | 7105 | 116 | 1.632653% |
Noise dominated data is calculated using 1-second bins in cleaned event files. If a bin has >2000 counts, and if more than 50% of those come from <1% of pixels, then it is considered to be noise-dominated and hence unusable.
| Quadrant | # 1 sec bins | Bins with >0 counts | Bins with >2000 counts | High rate bins dominated by noise | Noise dominated (total time) | Noise dominated (detector-on time) | Marked lightcurve |
|---|---|---|---|---|---|---|---|
| A | 7826 | 7107 | 0 | 0 | 0.00% | 0.00% | 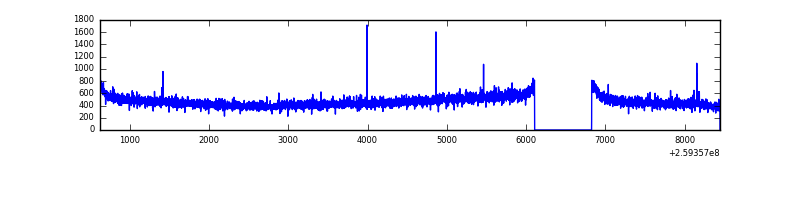 |
| B | 7826 | 7106 | 73 | 73 | 0.93% | 1.03% | 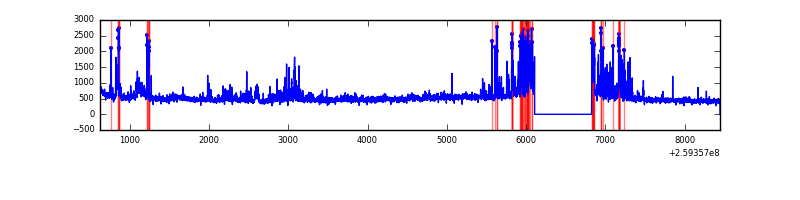 |
| C | 7826 | 7107 | 0 | 0 | 0.00% | 0.00% | 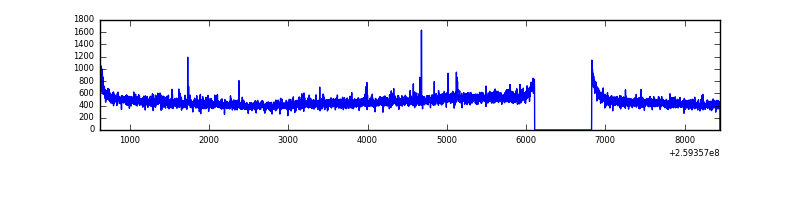 |
| D | 7826 | 7107 | 106 | 106 | 1.35% | 1.49% | 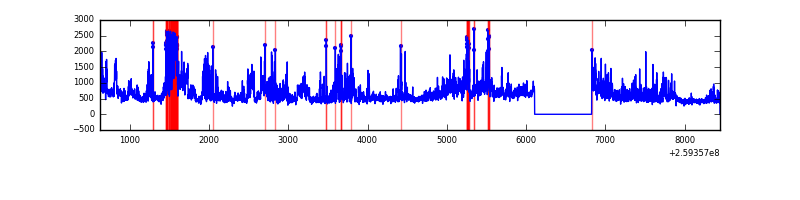 |
Top three noisy pixels from each quadrant. If the there are fewer than three noisy pixels in the level2.evt file, extra rows are filled as -1
| Pixel properties | Quadrant properties | ||||||
|---|---|---|---|---|---|---|---|
| Quadrant | DetID | PixID | Counts | Sigma | Mean | Median | Sigma |
| A | 15 | 69 | 11147 | 59.56 | 846 | 829 | 173.2 |
| A | 0 | 226 | 7498 | 38.49 | 846 | 829 | 173.2 |
| A | 1 | 162 | 7126 | 36.35 | 846 | 829 | 173.2 |
| B | 3 | 64 | 440609 | 2733.64 | 844 | 823 | 160.9 |
| B | 10 | 244 | 318691 | 1975.82 | 844 | 823 | 160.9 |
| B | 4 | 142 | 43079 | 262.66 | 844 | 823 | 160.9 |
| C | 3 | 233 | 73837 | 382.29 | 822 | 827 | 191.0 |
| C | 14 | 220 | 41366 | 212.27 | 822 | 827 | 191.0 |
| C | 13 | 61 | 5856 | 26.33 | 822 | 827 | 191.0 |
| D | 8 | 195 | 764778 | 3956.5 | 803 | 780 | 193.1 |
| D | 1 | 52 | 476434 | 2463.26 | 803 | 780 | 193.1 |
| D | 2 | 136 | 296244 | 1530.11 | 803 | 780 | 193.1 |
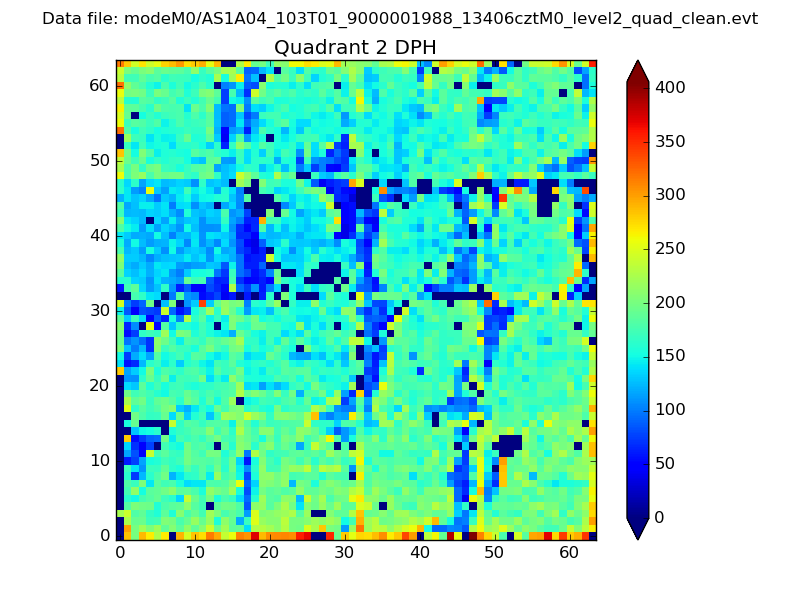
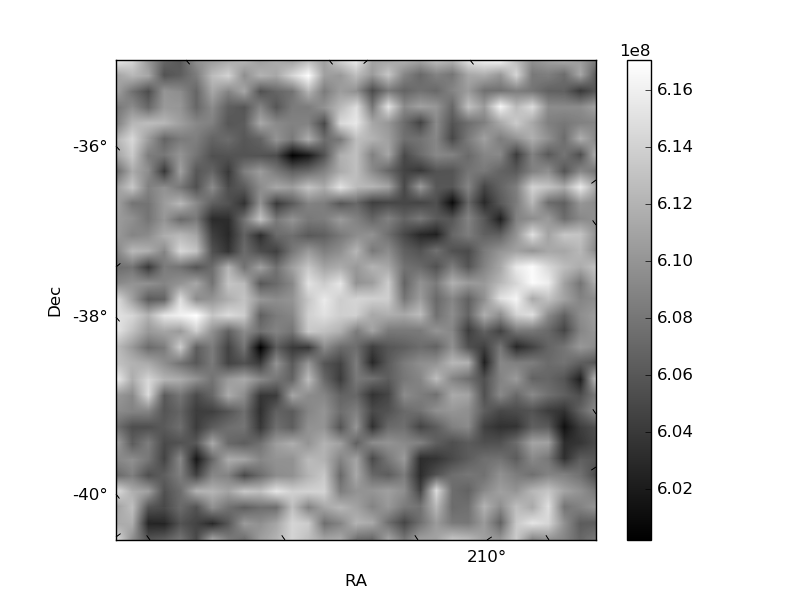
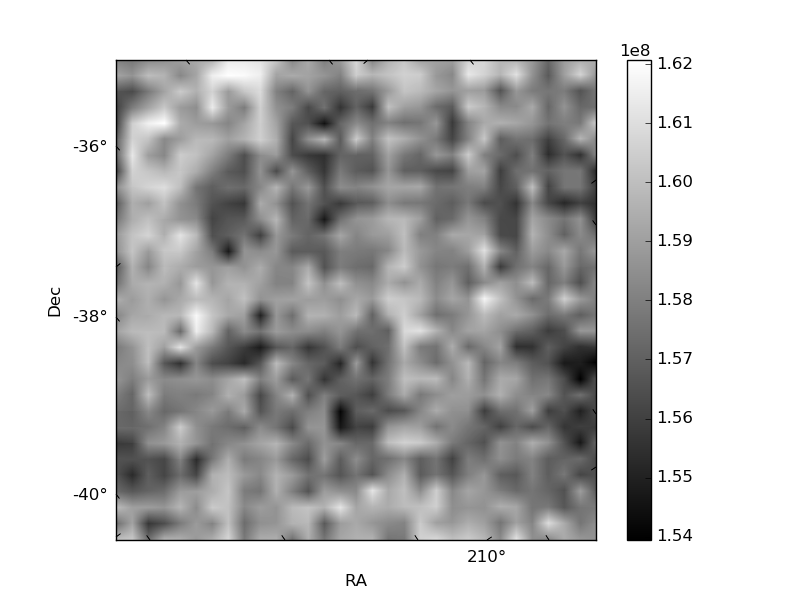
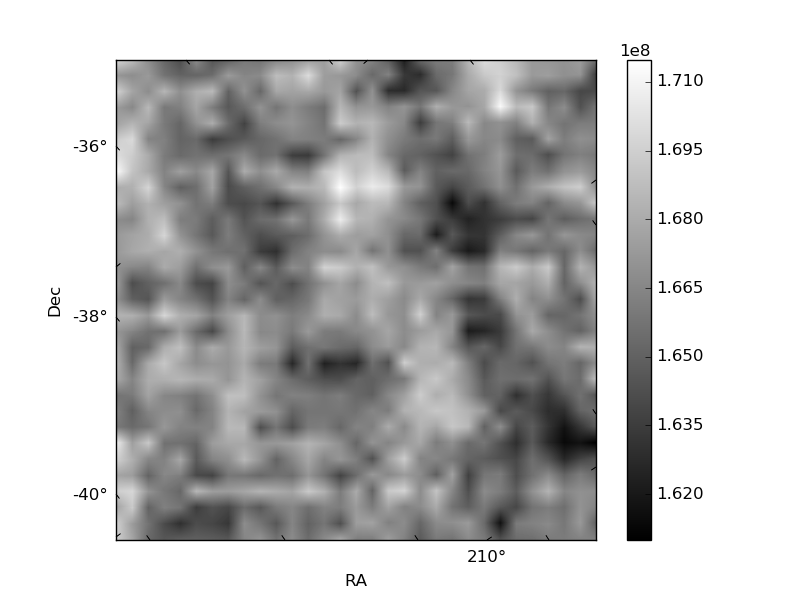
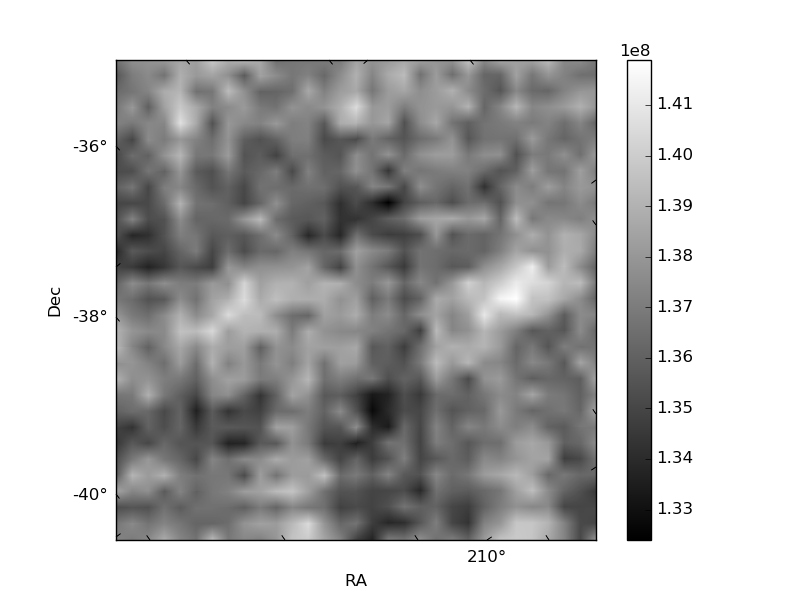
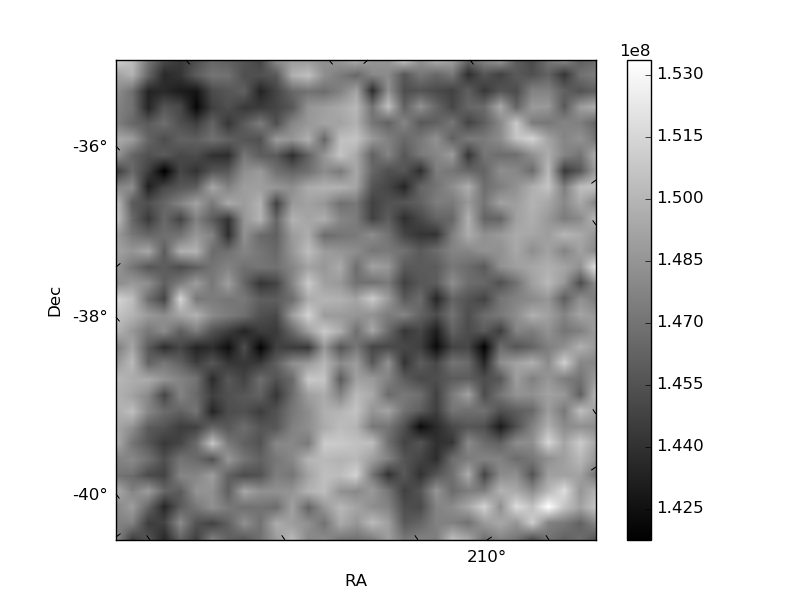
Histogram calculated using DETX and DETY for each event in the final _common_clean file
| Quadrant A | 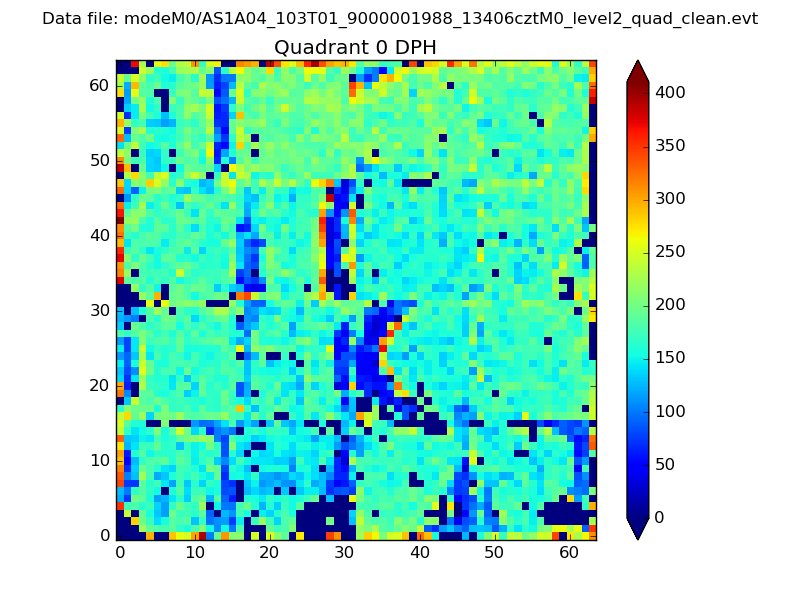 |
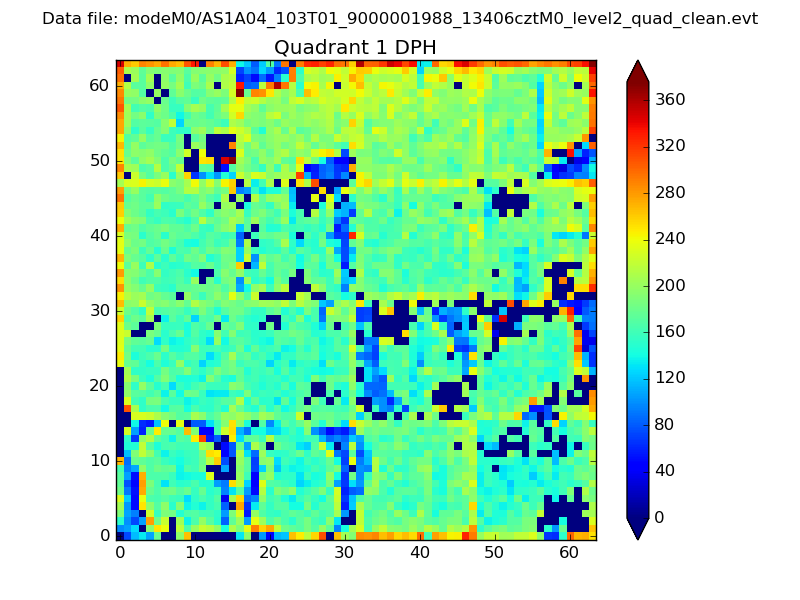 |
Quadrant B |
|---|---|---|---|
| Quadrant D | 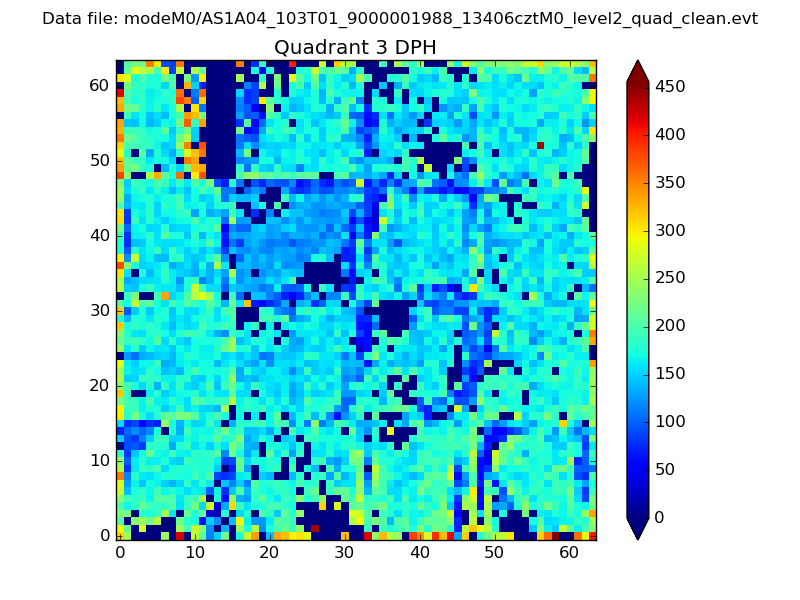 |
 |
Quadrant C |
| Plot type | Count rate plots | Images |
|---|---|---|
| Comparison with Poisson distribution Blue bars denote a histogram of data divided into 1 sec bins. Red curve is a Poisson curve with rate = median count rate of data. |
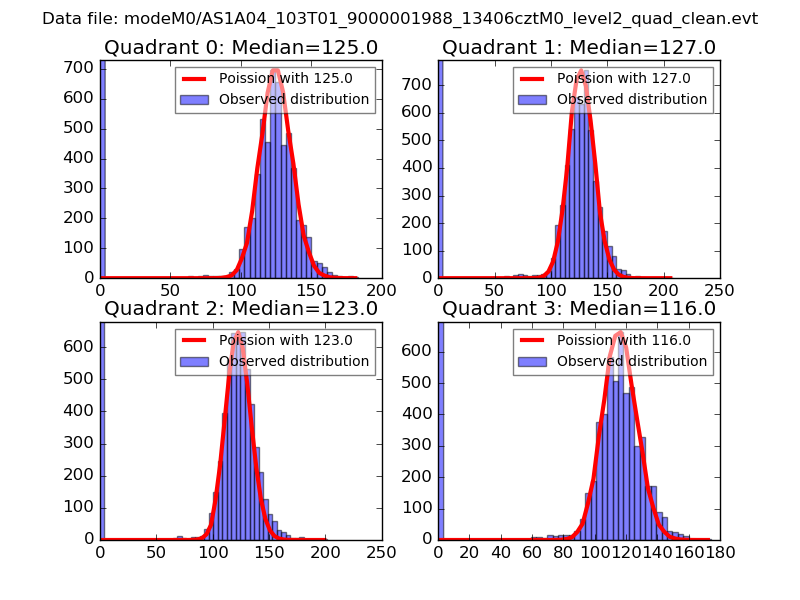 |
 |
| Quadrant-wise count rates Data is divided into 100 sec bins |
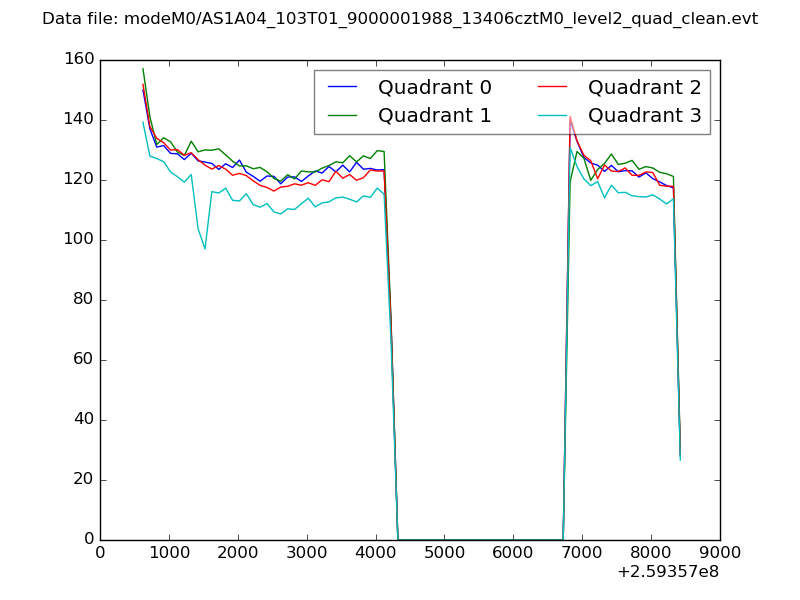 |
|
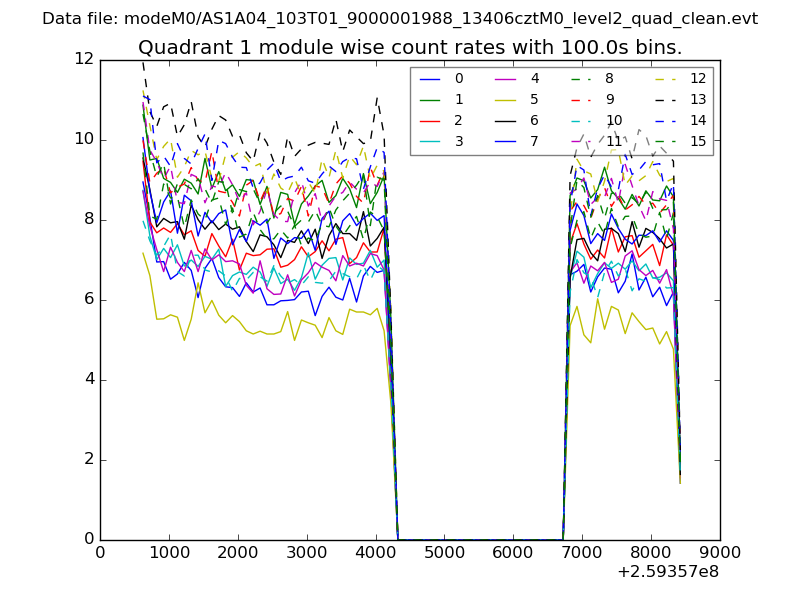
| Module-wise count rates for Quadrant A Data is divided into 100 sec bins |
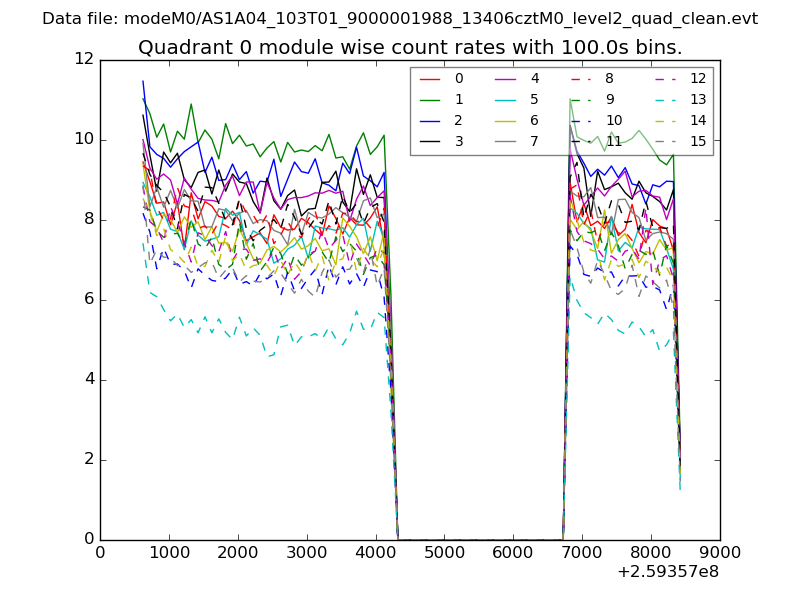 |
 |
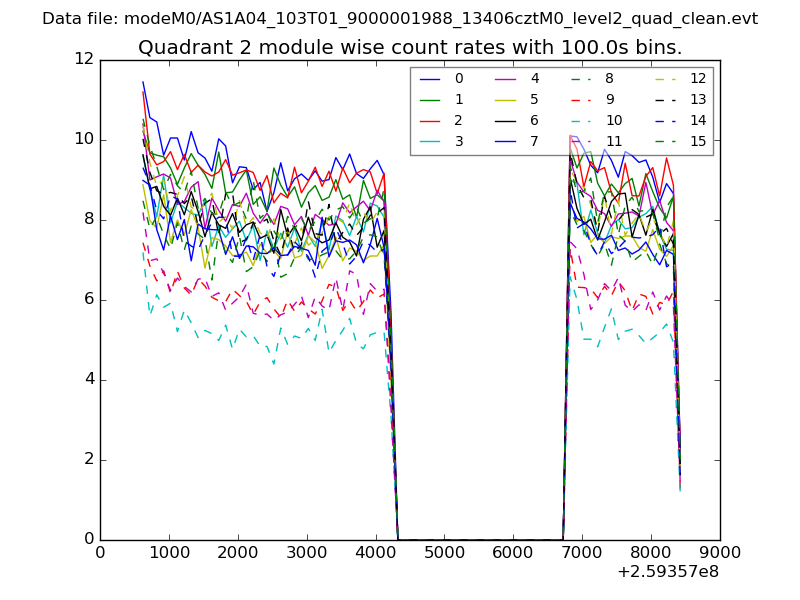
| Module-wise count rates for Quadrant B Data is divided into 100 sec bins |
 |
 |
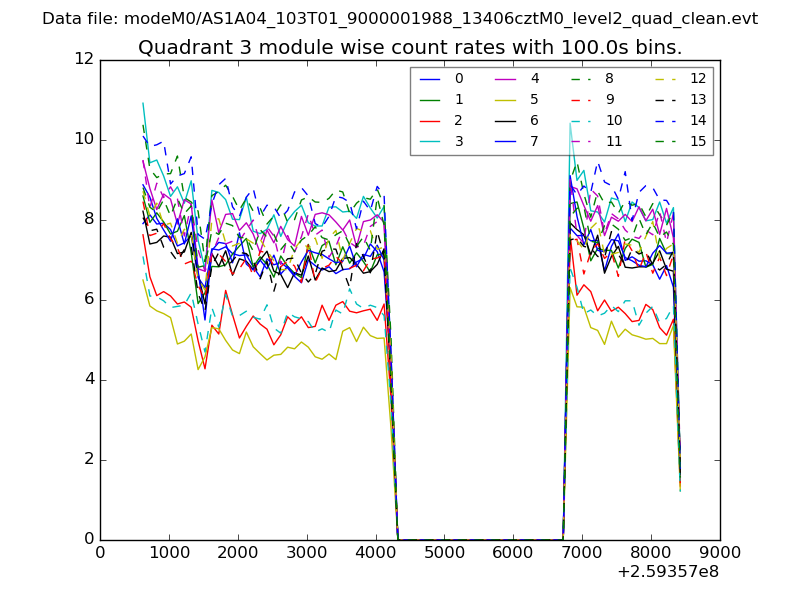
| Module-wise count rates for Quadrant C Data is divided into 100 sec bins |
 |
 |
| Module-wise count rates for Quadrant D Data is divided into 100 sec bins |
 |
 |
| Parameter | Plot |
|---|---|
| CZT HV Monitor | 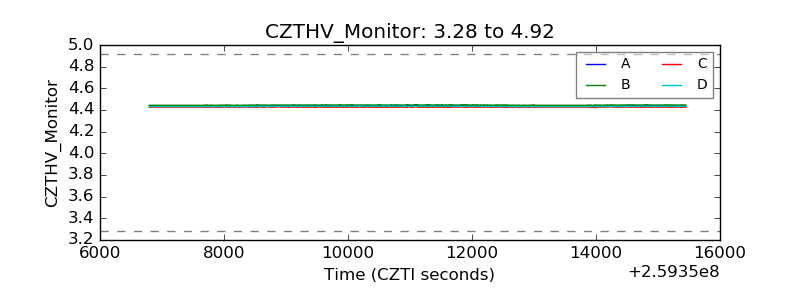 |
| D_VDD | 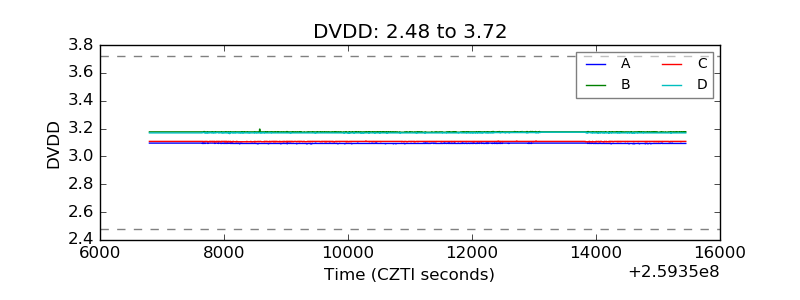 |
| Temperature 1 | 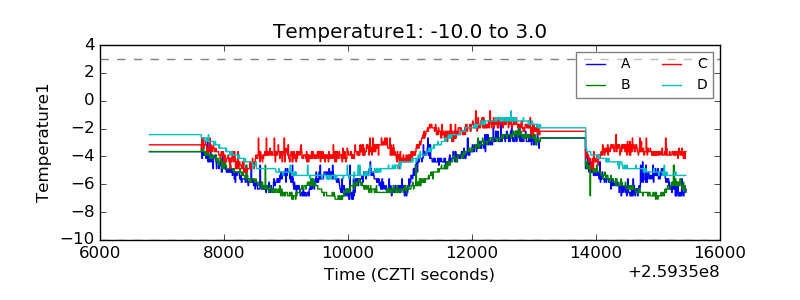 |
| Veto HV Monitor | 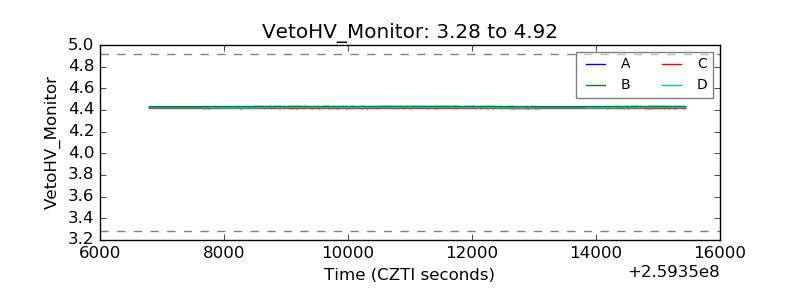 |
| Veto LLD | 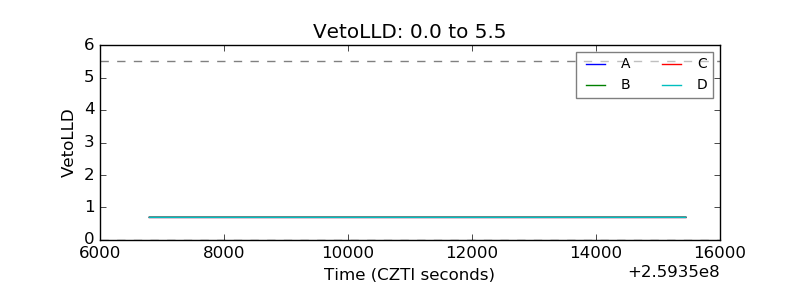 |
| Alpha Counter | 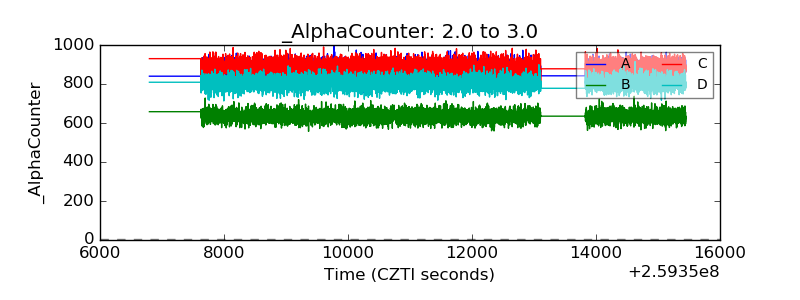 |
| _CPM_Rate | 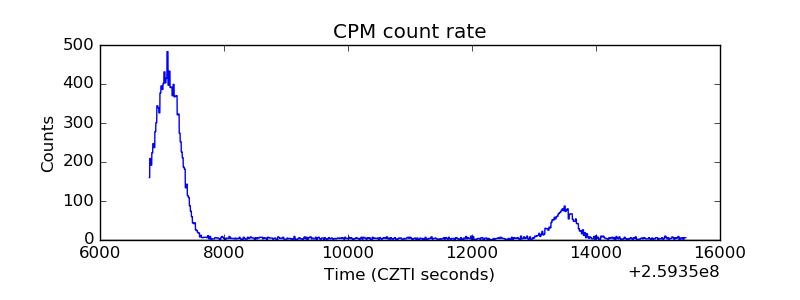 |
| CZT Counter | 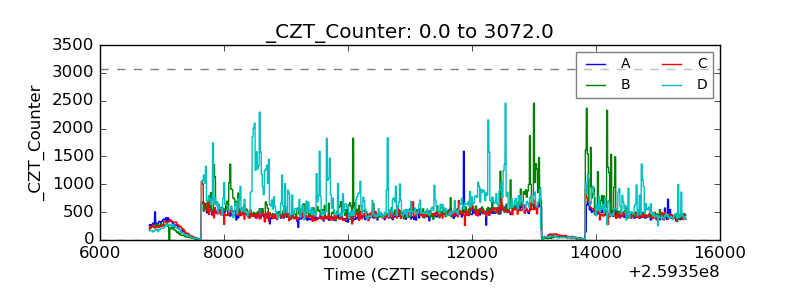 |
| +2.5 Volts monitor |  |
| +5 Volts monitor | 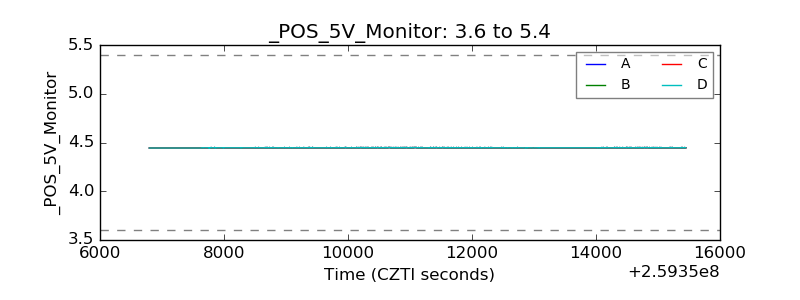 |
| _ROLL_ROT | 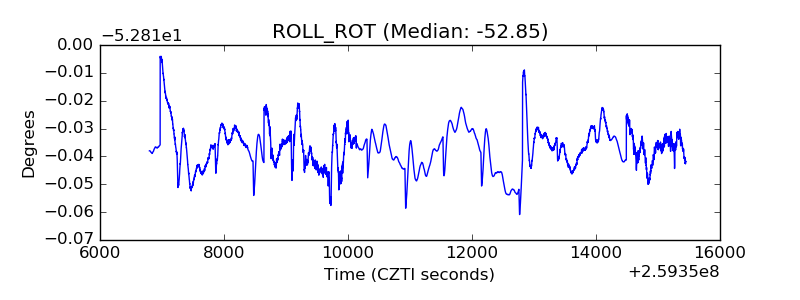 |
| _Roll_DEC | 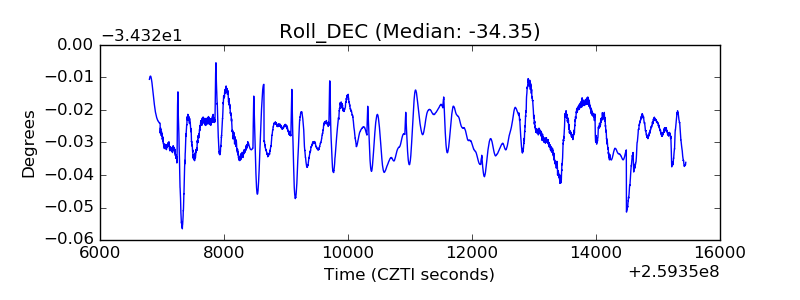 |
| _Roll_RA | 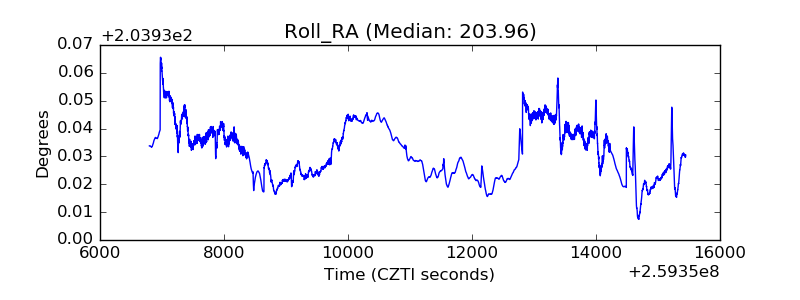 |
| Veto Counter | 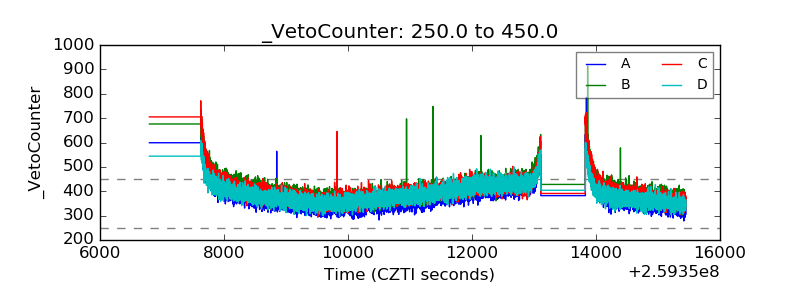 |