| Param | Original file | Final file |
|---|---|---|
| Filename | modeM0/AS1A04_103T01_9000001988_13407cztM0_level2.evt | modeM0/AS1A04_103T01_9000001988_13407cztM0_level2_quad_clean.evt |
| Size (bytes) | 593,447,040 | 104,618,880 |
| Size | 566.0 MB | 99.8 MB |
| Events in quadrant A | 3,764,317 | 665,048 |
| Events in quadrant B | 4,262,142 | 678,058 |
| Events in quadrant C | 3,746,968 | 663,158 |
| Events in quadrant D | 5,657,449 | 606,623 |
| Mode M0 | |||
|---|---|---|---|
| Quadrant | BADHDUFLAG | Total packets | Discarded packets |
| A | 0 | 16673 | 3 |
| B | 0 | 17995 | 2 |
| C | 0 | 16495 | 2 |
| D | 0 | 22429 | 2 |
| Mode SS | |||
|---|---|---|---|
| Quadrant | BADHDUFLAG | Total packets | Discarded packets |
| A | 0 | 164 | 0 |
| B | 0 | 164 | 0 |
| C | 0 | 164 | 0 |
| D | 0 | 164 | 0 |
| Mode M9 | |||
|---|---|---|---|
| Quadrant | BADHDUFLAG | Total packets | Discarded packets |
| A | 0 | 10 | 0 |
| B | 0 | 10 | 0 |
| C | 0 | 10 | 0 |
| D | 0 | 10 | 0 |
| Quadrant | Total seconds | Saturated seconds | Saturation percentage |
|---|---|---|---|
| A | 7989 | 30 | 0.375516% |
| B | 7989 | 194 | 2.428339% |
| C | 7989 | 28 | 0.350482% |
| D | 7989 | 412 | 5.157091% |
Noise dominated data is calculated using 1-second bins in cleaned event files. If a bin has >2000 counts, and if more than 50% of those come from <1% of pixels, then it is considered to be noise-dominated and hence unusable.
| Quadrant | # 1 sec bins | Bins with >0 counts | Bins with >2000 counts | High rate bins dominated by noise | Noise dominated (total time) | Noise dominated (detector-on time) | Marked lightcurve |
|---|---|---|---|---|---|---|---|
| A | 9015 | 7992 | 4 | 4 | 0.04% | 0.05% | 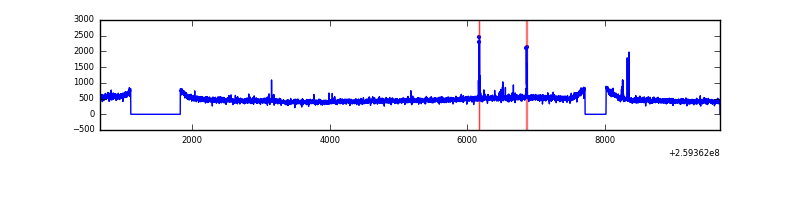 |
| B | 9015 | 7991 | 61 | 61 | 0.68% | 0.76% | 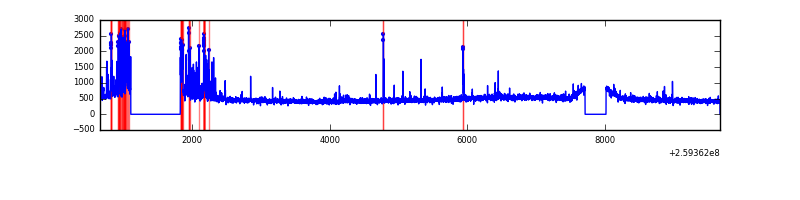 |
| C | 9015 | 7992 | 0 | 0 | 0.00% | 0.00% | 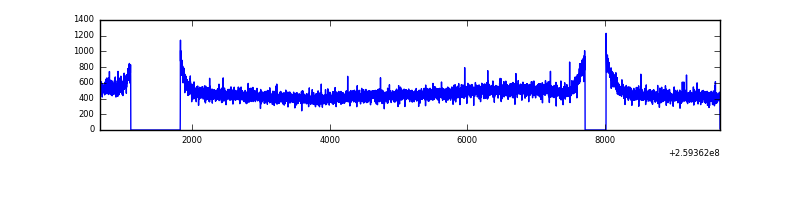 |
| D | 9015 | 7992 | 423 | 423 | 4.69% | 5.29% | 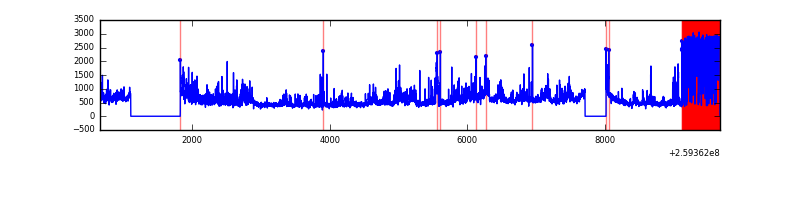 |
Top three noisy pixels from each quadrant. If the there are fewer than three noisy pixels in the level2.evt file, extra rows are filled as -1
| Pixel properties | Quadrant properties | ||||||
|---|---|---|---|---|---|---|---|
| Quadrant | DetID | PixID | Counts | Sigma | Mean | Median | Sigma |
| A | 15 | 69 | 41523 | 207.33 | 961 | 939 | 195.7 |
| A | 1 | 162 | 12672 | 59.94 | 961 | 939 | 195.7 |
| A | 0 | 226 | 8668 | 39.49 | 961 | 939 | 195.7 |
| B | 3 | 64 | 410174 | 2222.6 | 963 | 938 | 184.1 |
| B | 0 | 230 | 27621 | 144.92 | 963 | 938 | 184.1 |
| B | 12 | 111 | 22355 | 116.32 | 963 | 938 | 184.1 |
| C | 3 | 233 | 75220 | 339.36 | 940 | 946 | 218.9 |
| C | 14 | 220 | 8903 | 36.36 | 940 | 946 | 218.9 |
| C | 13 | 61 | 6812 | 26.8 | 940 | 946 | 218.9 |
| D | 5 | 222 | 1338405 | 6128.99 | 908 | 882 | 218.2 |
| D | 8 | 195 | 629785 | 2881.85 | 908 | 882 | 218.2 |
| D | 1 | 52 | 168898 | 769.91 | 908 | 882 | 218.2 |
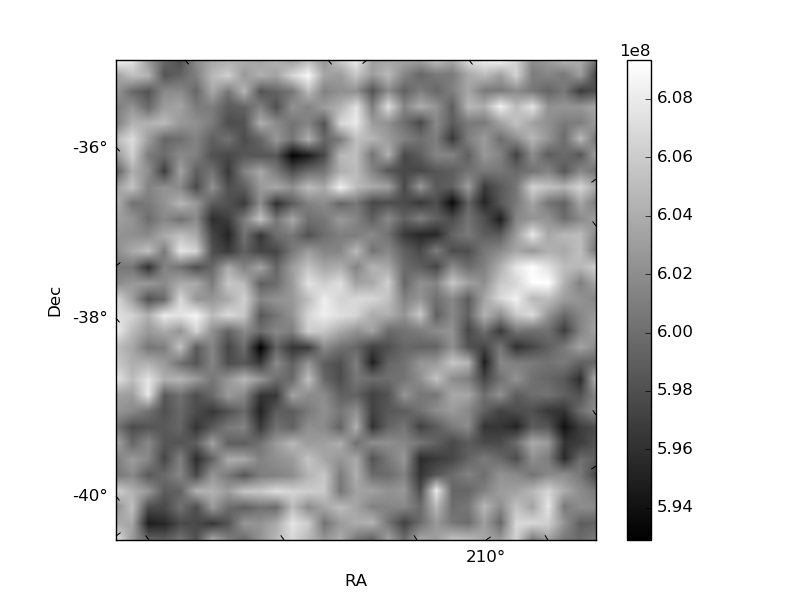
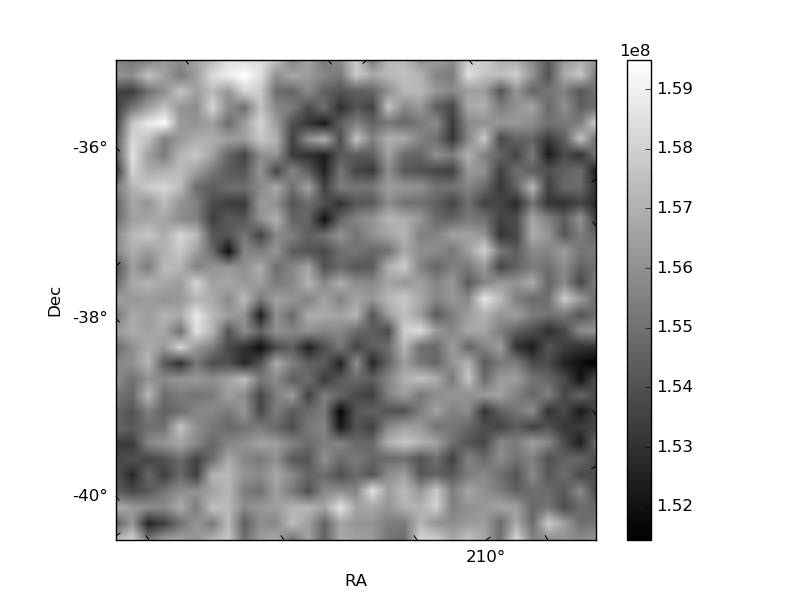
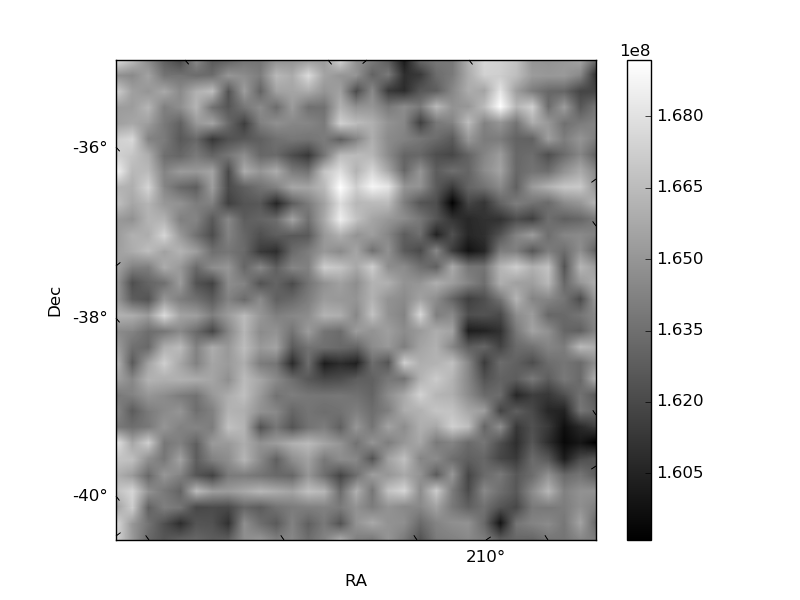
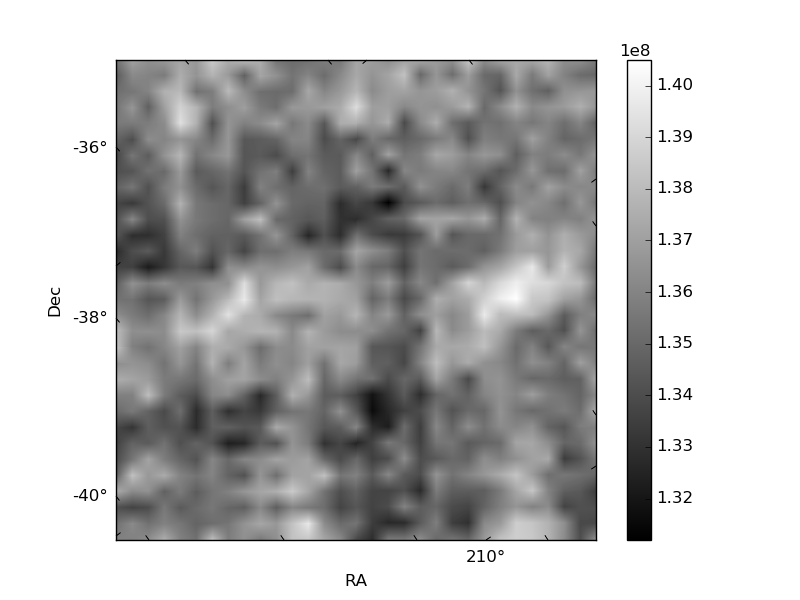
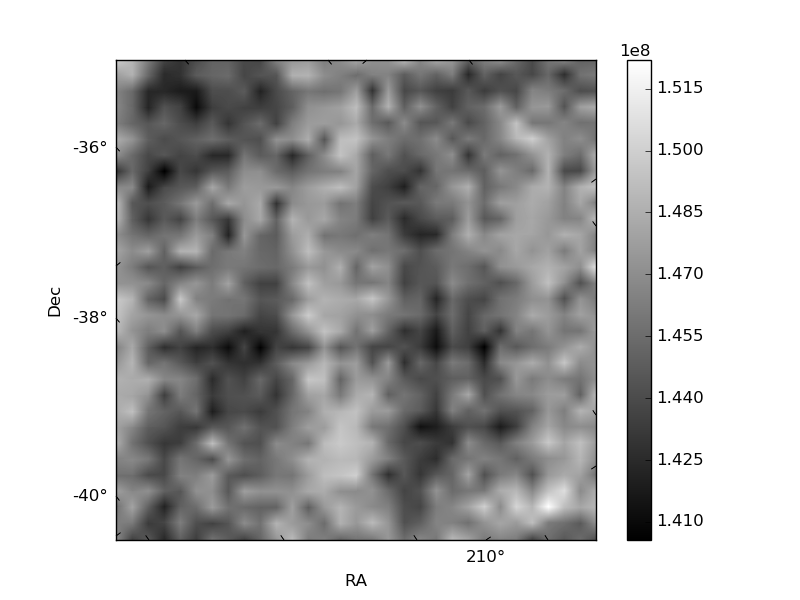
Histogram calculated using DETX and DETY for each event in the final _common_clean file
| Quadrant A | 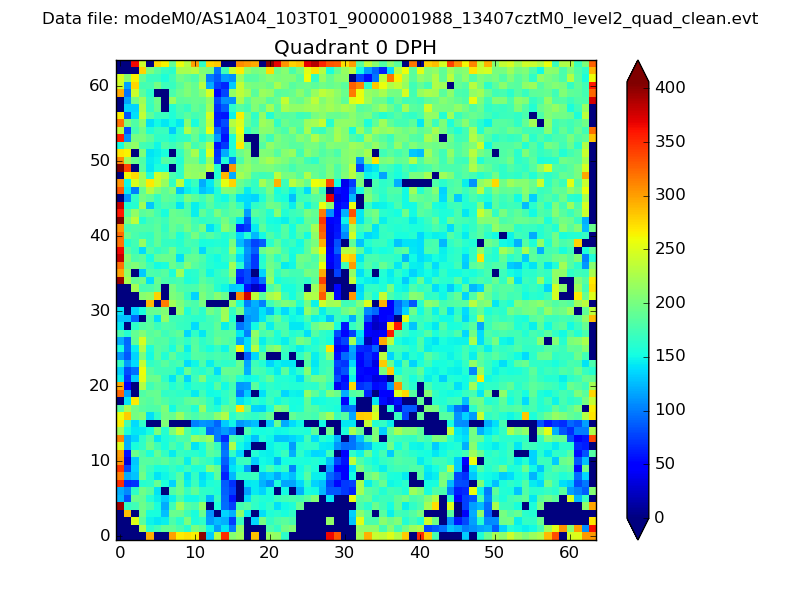 |
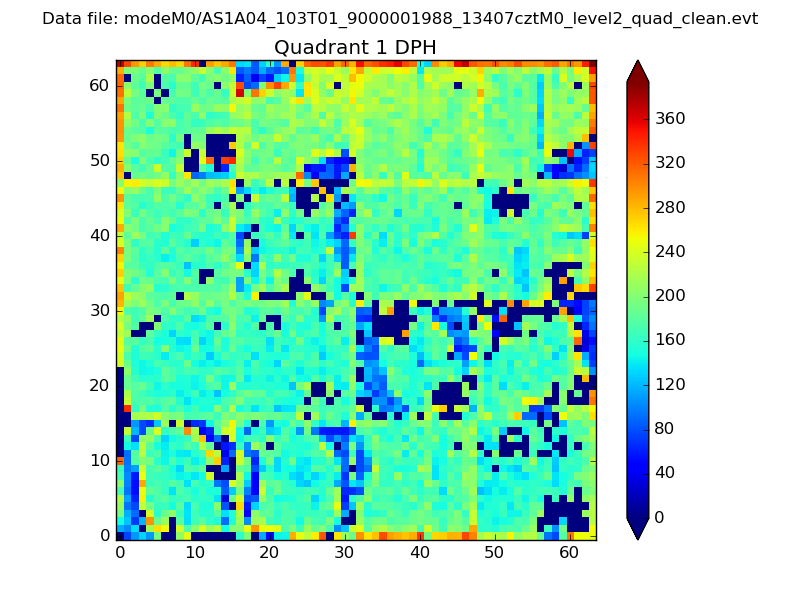 |
Quadrant B |
|---|---|---|---|
| Quadrant D | 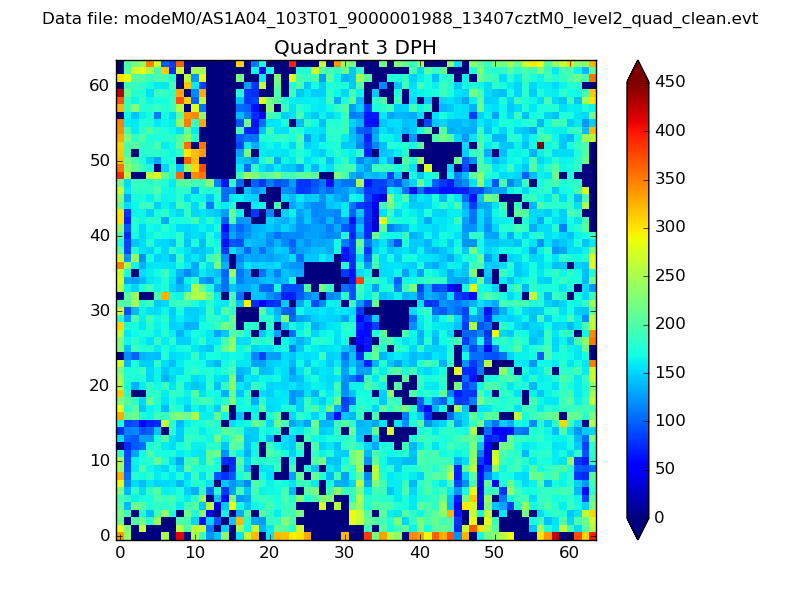 |
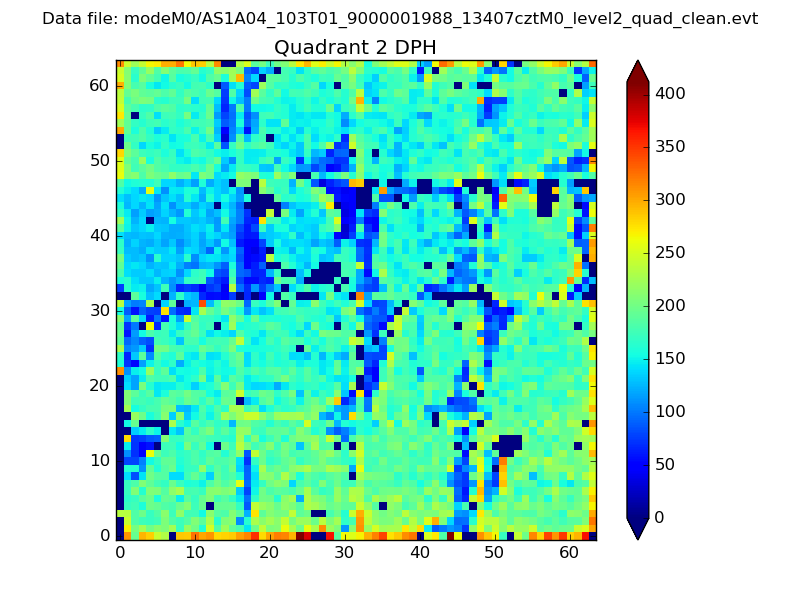 |
Quadrant C |
| Plot type | Count rate plots | Images |
|---|---|---|
| Comparison with Poisson distribution Blue bars denote a histogram of data divided into 1 sec bins. Red curve is a Poisson curve with rate = median count rate of data. |
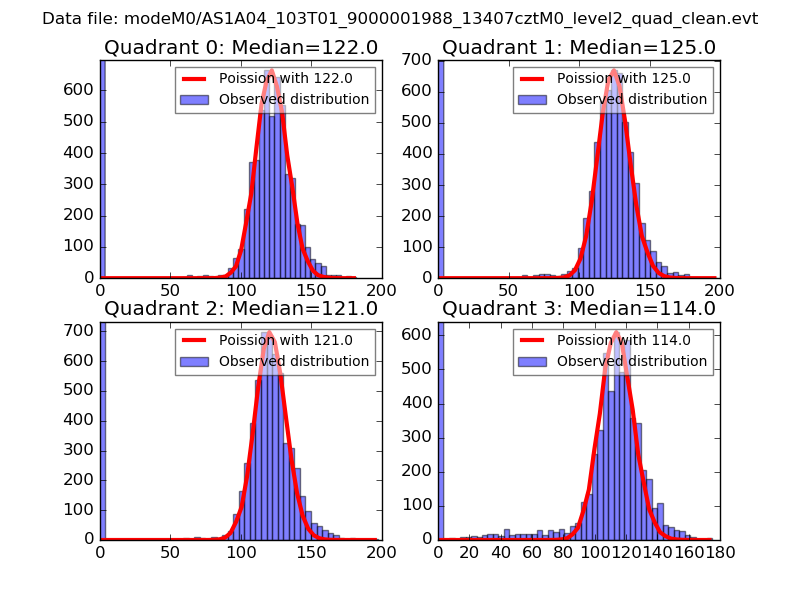 |
 |
| Quadrant-wise count rates Data is divided into 100 sec bins |
 |
|
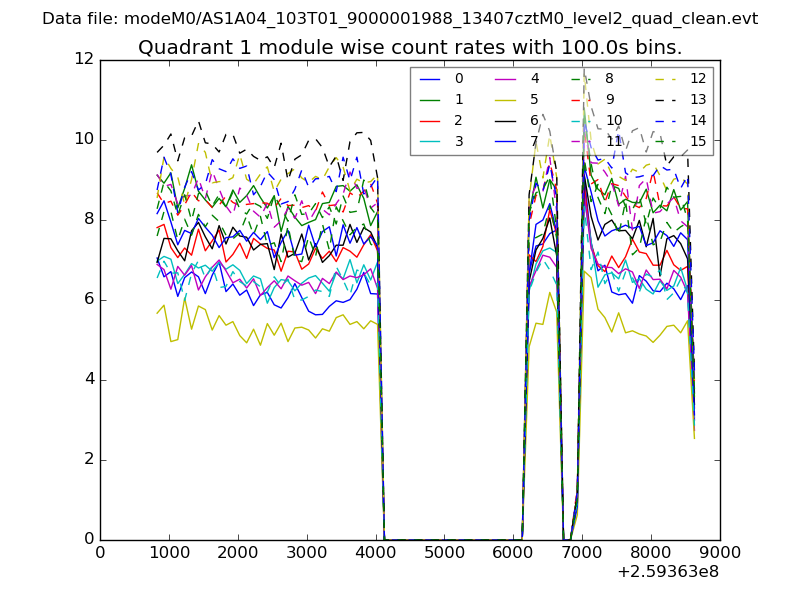
| Module-wise count rates for Quadrant A Data is divided into 100 sec bins |
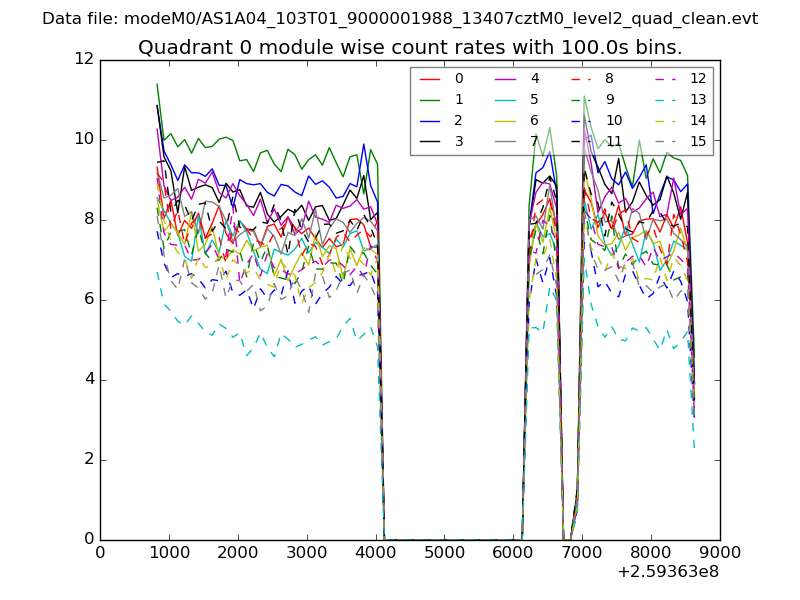 |
 |
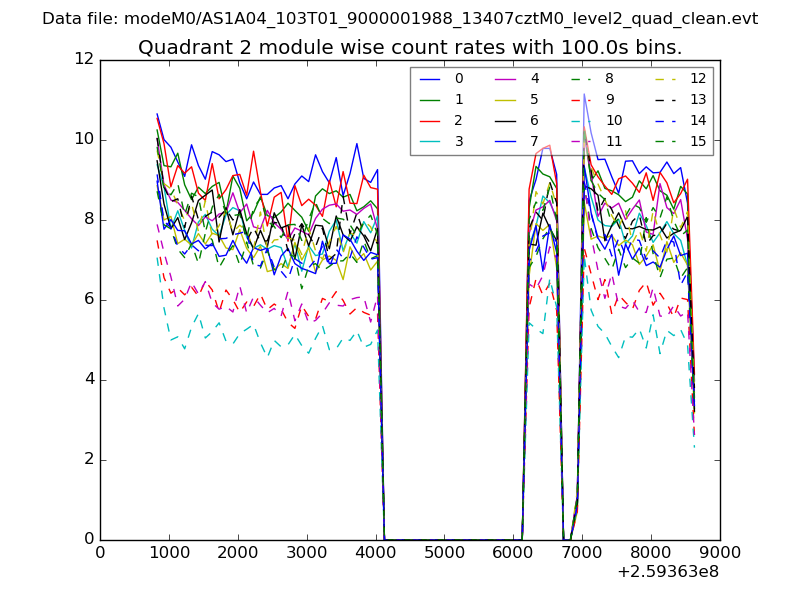
| Module-wise count rates for Quadrant B Data is divided into 100 sec bins |
 |
 |
| Module-wise count rates for Quadrant C Data is divided into 100 sec bins |
 |
 |
| Module-wise count rates for Quadrant D Data is divided into 100 sec bins |
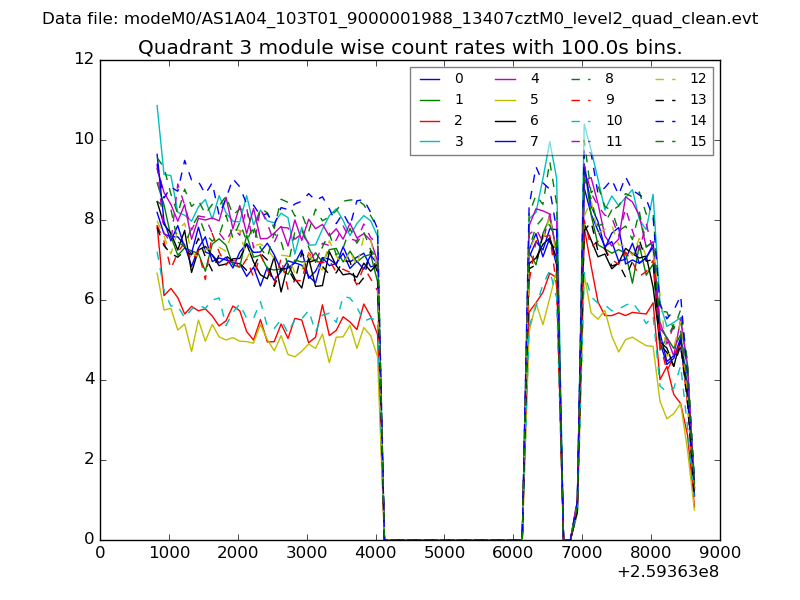 |
 |
| Parameter | Plot |
|---|---|
| CZT HV Monitor | 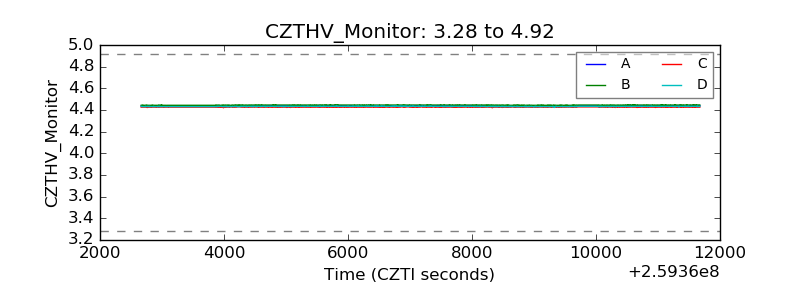 |
| D_VDD | 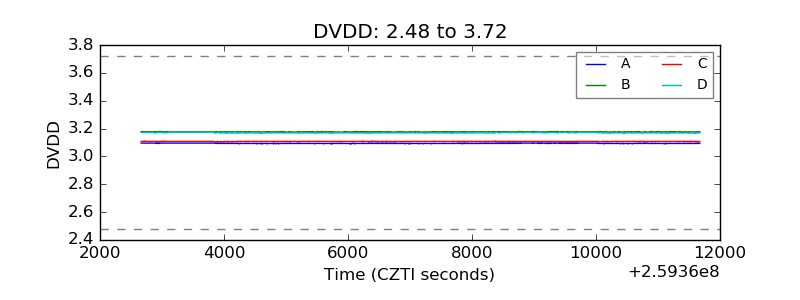 |
| Temperature 1 | 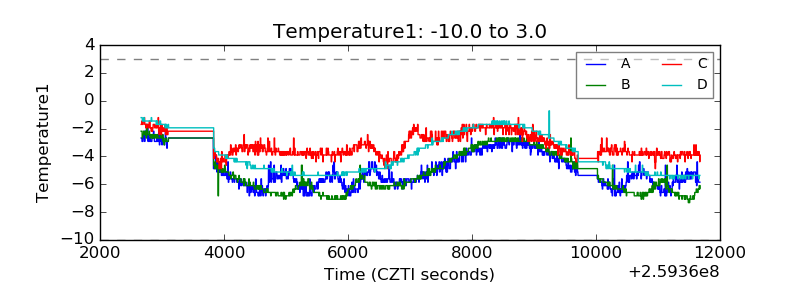 |
| Veto HV Monitor | 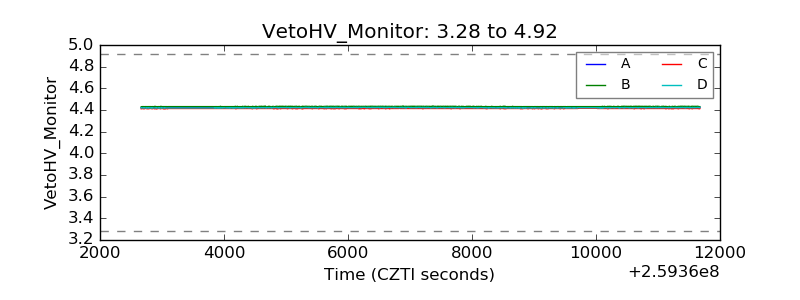 |
| Veto LLD | 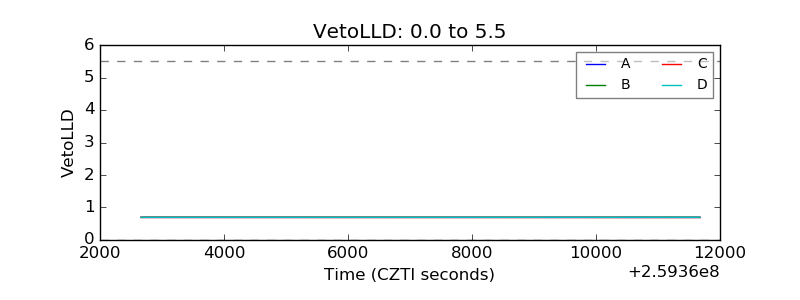 |
| Alpha Counter | 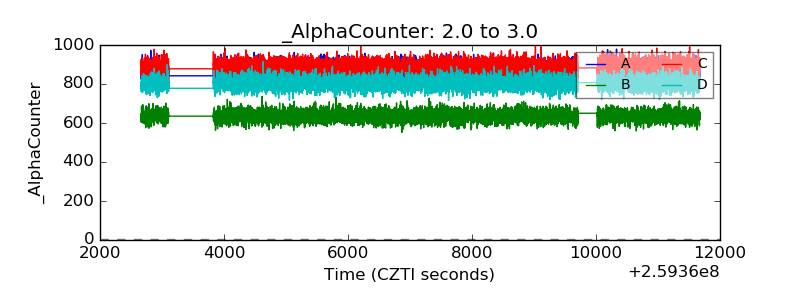 |
| _CPM_Rate | 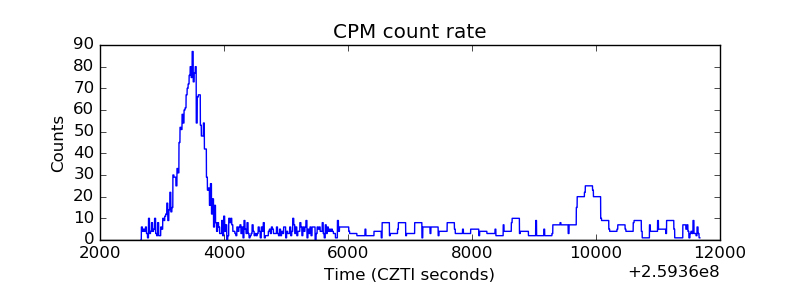 |
| CZT Counter | 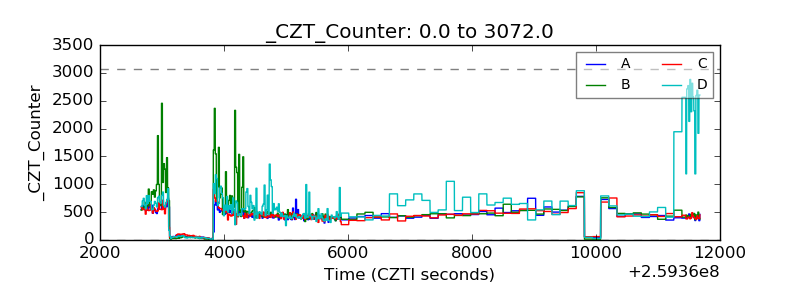 |
| +2.5 Volts monitor |  |
| +5 Volts monitor |  |
| _ROLL_ROT | 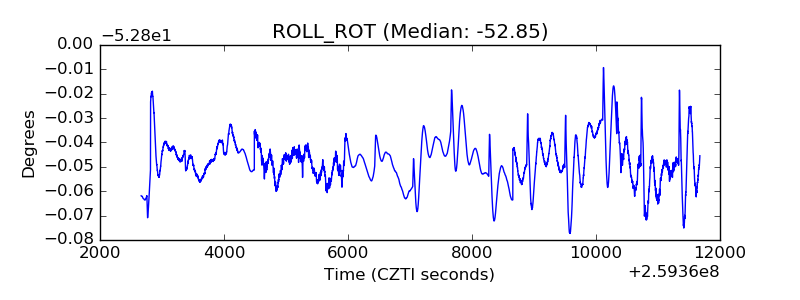 |
| _Roll_DEC | 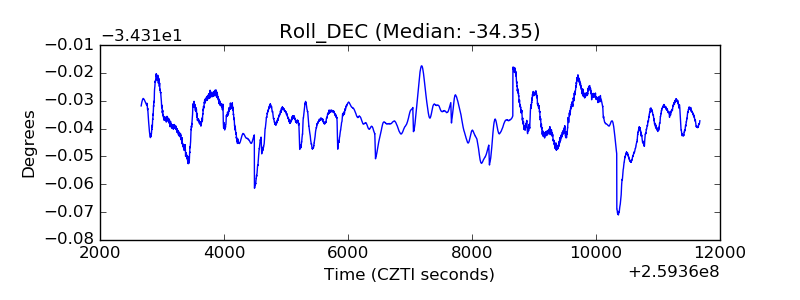 |
| _Roll_RA | 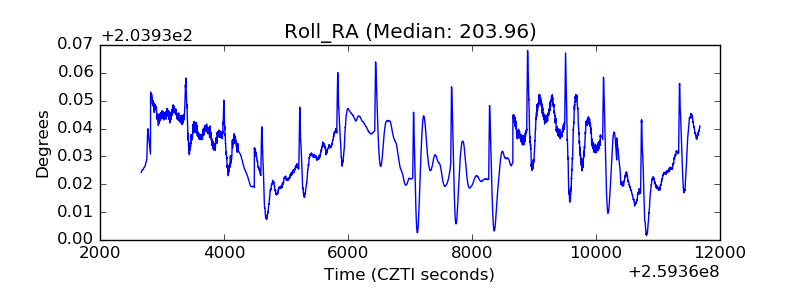 |
| Veto Counter | 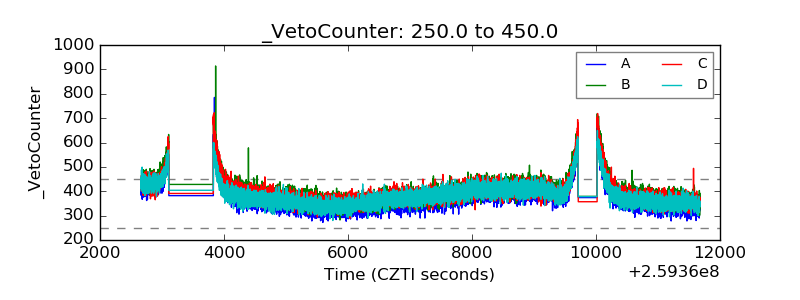 |