| Param | Original file | Final file |
|---|---|---|
| Filename | modeM0/AS1A04_103T01_9000001988_13408cztM0_level2.evt | modeM0/AS1A04_103T01_9000001988_13408cztM0_level2_quad_clean.evt |
| Size (bytes) | 543,274,560 | 106,560,000 |
| Size | 518.1 MB | 101.6 MB |
| Events in quadrant A | 3,567,318 | 683,613 |
| Events in quadrant B | 3,739,931 | 701,815 |
| Events in quadrant C | 3,624,162 | 680,422 |
| Events in quadrant D | 4,997,028 | 623,697 |
| Mode M0 | |||
|---|---|---|---|
| Quadrant | BADHDUFLAG | Total packets | Discarded packets |
| A | 0 | 15964 | 3 |
| B | 0 | 16314 | 2 |
| C | 0 | 15935 | 2 |
| D | 0 | 20146 | 2 |
| Mode SS | |||
|---|---|---|---|
| Quadrant | BADHDUFLAG | Total packets | Discarded packets |
| A | 0 | 158 | 0 |
| B | 0 | 158 | 0 |
| C | 0 | 158 | 0 |
| D | 0 | 158 | 0 |
| Mode M9 | |||
|---|---|---|---|
| Quadrant | BADHDUFLAG | Total packets | Discarded packets |
| A | 0 | 2 | 0 |
| B | 0 | 2 | 0 |
| C | 0 | 2 | 0 |
| D | 0 | 2 | 0 |
| Quadrant | Total seconds | Saturated seconds | Saturation percentage |
|---|---|---|---|
| A | 7723 | 56 | 0.725107% |
| B | 7723 | 110 | 1.424317% |
| C | 7723 | 50 | 0.647417% |
| D | 7723 | 443 | 5.736113% |
Noise dominated data is calculated using 1-second bins in cleaned event files. If a bin has >2000 counts, and if more than 50% of those come from <1% of pixels, then it is considered to be noise-dominated and hence unusable.
| Quadrant | # 1 sec bins | Bins with >0 counts | Bins with >2000 counts | High rate bins dominated by noise | Noise dominated (total time) | Noise dominated (detector-on time) | Marked lightcurve |
|---|---|---|---|---|---|---|---|
| A | 7944 | 7724 | 2 | 2 | 0.03% | 0.03% | 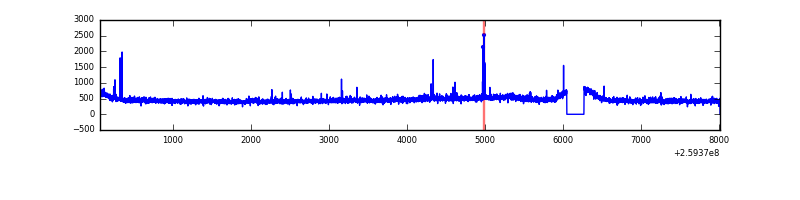 |
| B | 7944 | 7724 | 11 | 11 | 0.14% | 0.14% | 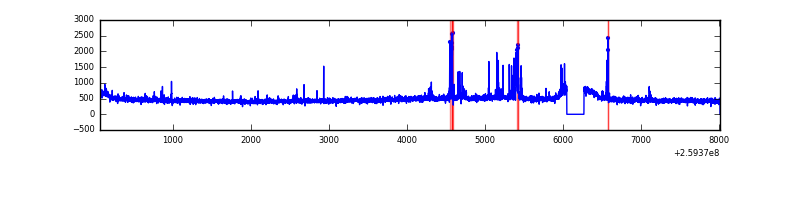 |
| C | 7944 | 7725 | 3 | 3 | 0.04% | 0.04% | 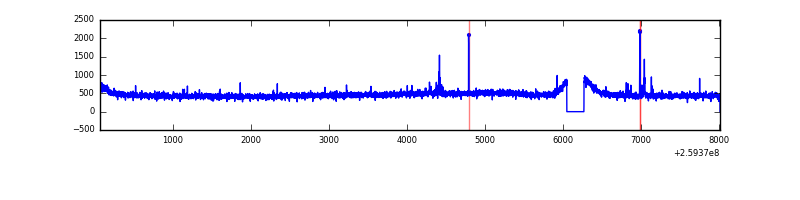 |
| D | 7944 | 7725 | 454 | 454 | 5.72% | 5.88% | 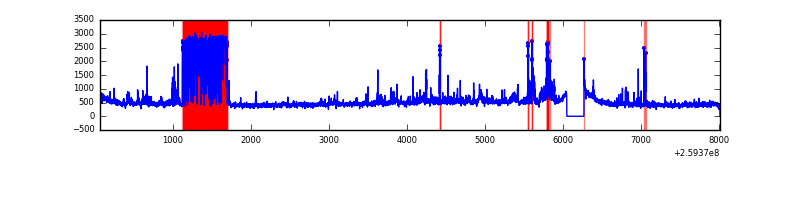 |
Top three noisy pixels from each quadrant. If the there are fewer than three noisy pixels in the level2.evt file, extra rows are filled as -1
| Pixel properties | Quadrant properties | ||||||
|---|---|---|---|---|---|---|---|
| Quadrant | DetID | PixID | Counts | Sigma | Mean | Median | Sigma |
| A | 15 | 69 | 38850 | 203.42 | 909 | 888 | 186.6 |
| A | 1 | 162 | 20324 | 104.15 | 909 | 888 | 186.6 |
| A | 0 | 226 | 8061 | 38.44 | 909 | 888 | 186.6 |
| B | 4 | 142 | 80770 | 457.34 | 915 | 891 | 174.7 |
| B | 3 | 64 | 43740 | 245.33 | 915 | 891 | 174.7 |
| B | 12 | 111 | 20945 | 114.82 | 915 | 891 | 174.7 |
| C | 3 | 233 | 98084 | 469.81 | 891 | 895 | 206.9 |
| C | 14 | 220 | 52347 | 248.72 | 891 | 895 | 206.9 |
| C | 13 | 61 | 6332 | 26.28 | 891 | 895 | 206.9 |
| D | 5 | 222 | 1156608 | 5595.41 | 859 | 834 | 206.6 |
| D | 8 | 195 | 340969 | 1646.68 | 859 | 834 | 206.6 |
| D | 1 | 52 | 138538 | 666.66 | 859 | 834 | 206.6 |
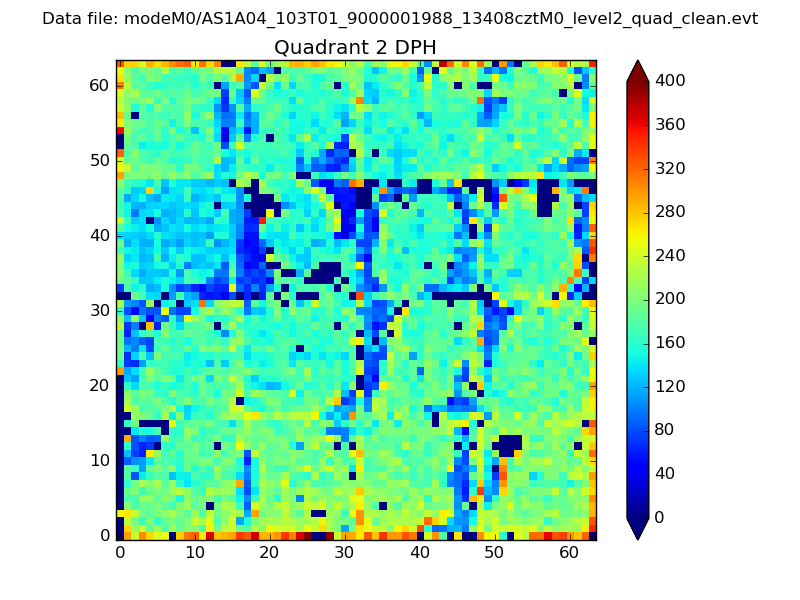
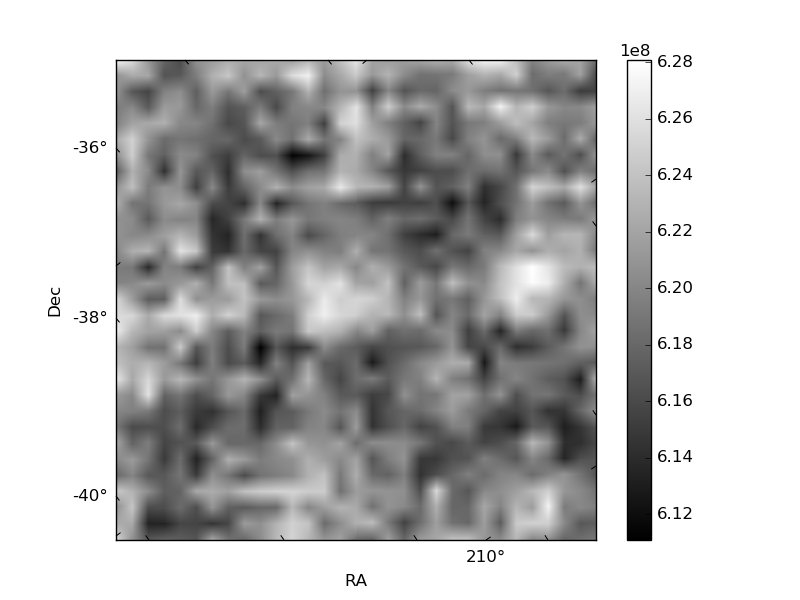
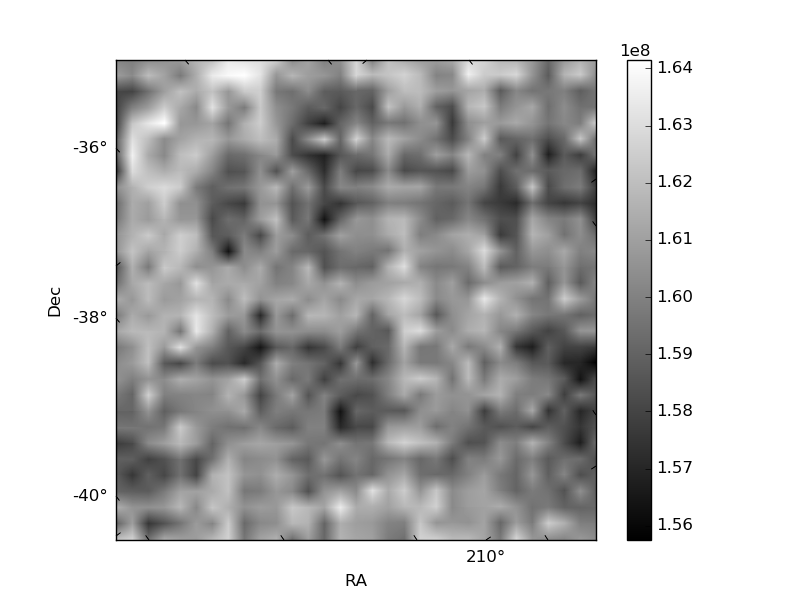
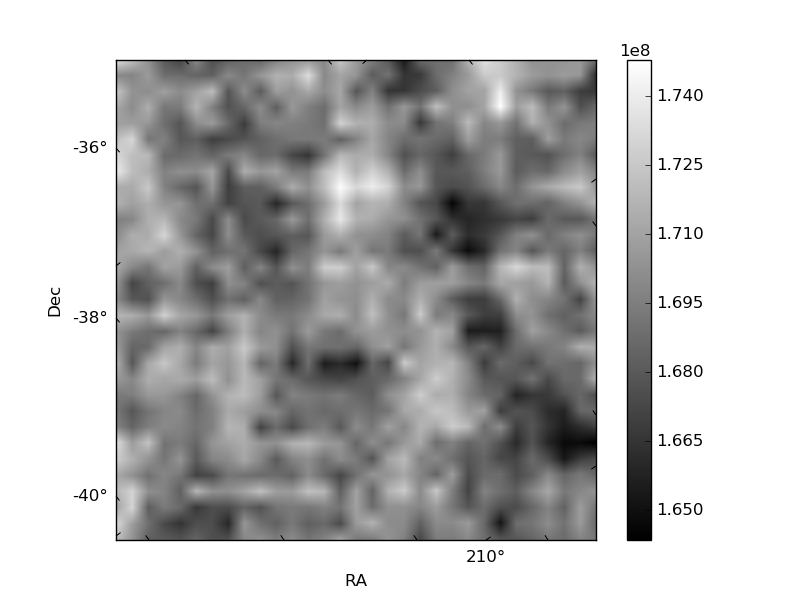
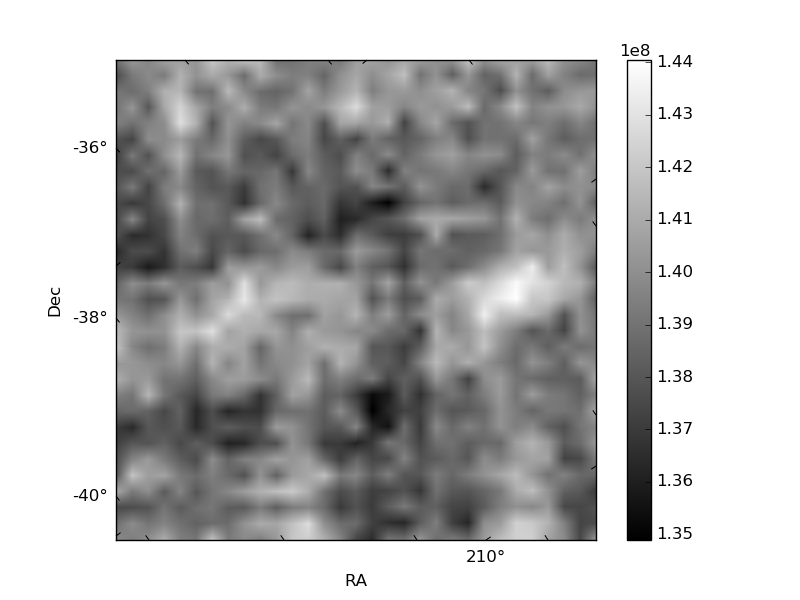
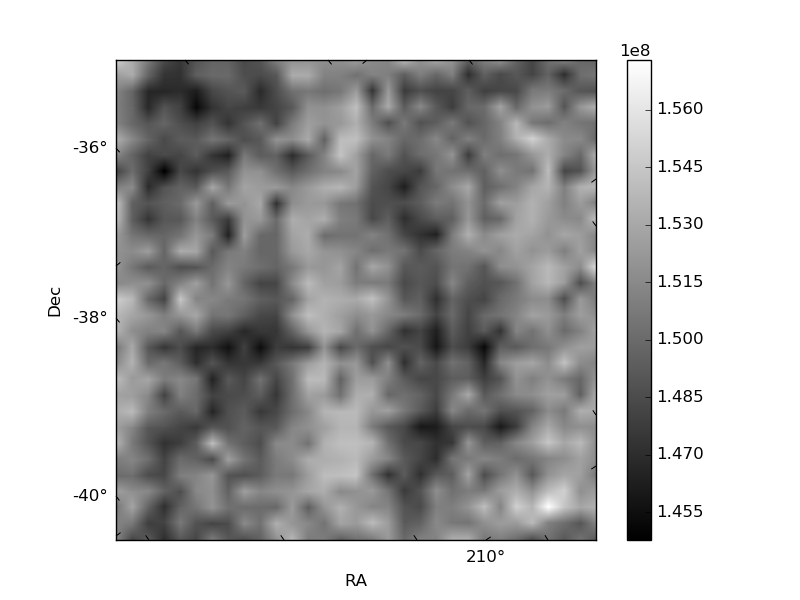
Histogram calculated using DETX and DETY for each event in the final _common_clean file
| Quadrant A | 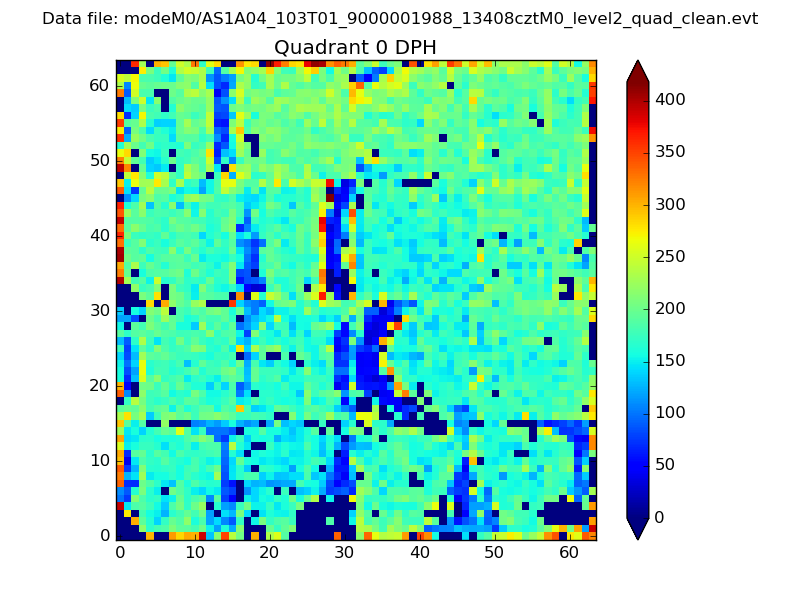 |
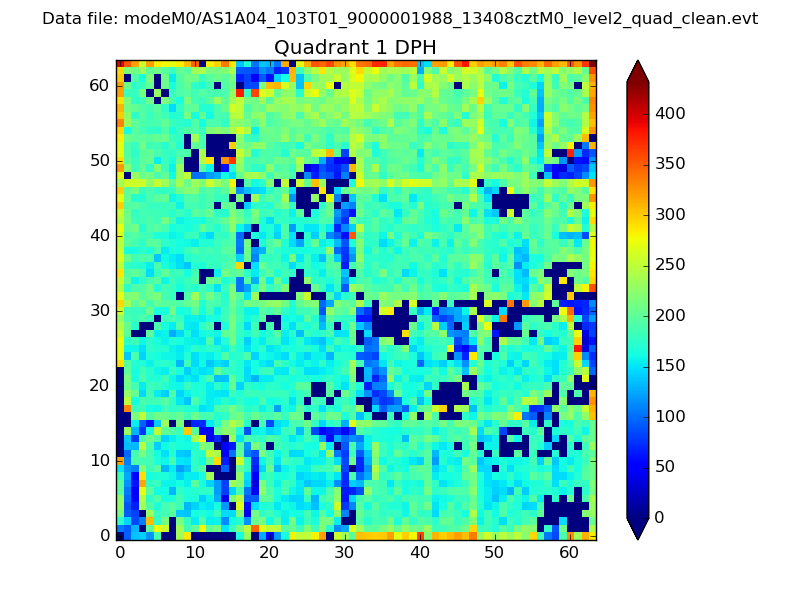 |
Quadrant B |
|---|---|---|---|
| Quadrant D | 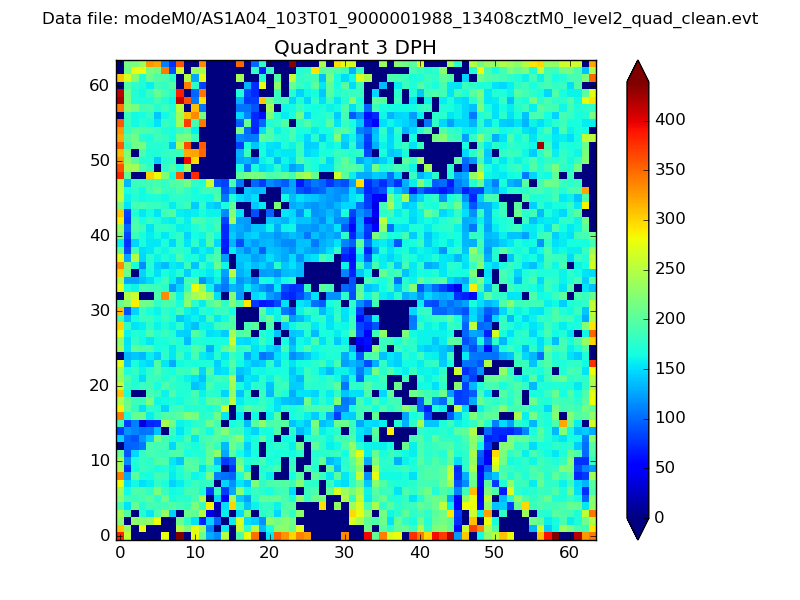 |
 |
Quadrant C |
| Plot type | Count rate plots | Images |
|---|---|---|
| Comparison with Poisson distribution Blue bars denote a histogram of data divided into 1 sec bins. Red curve is a Poisson curve with rate = median count rate of data. |
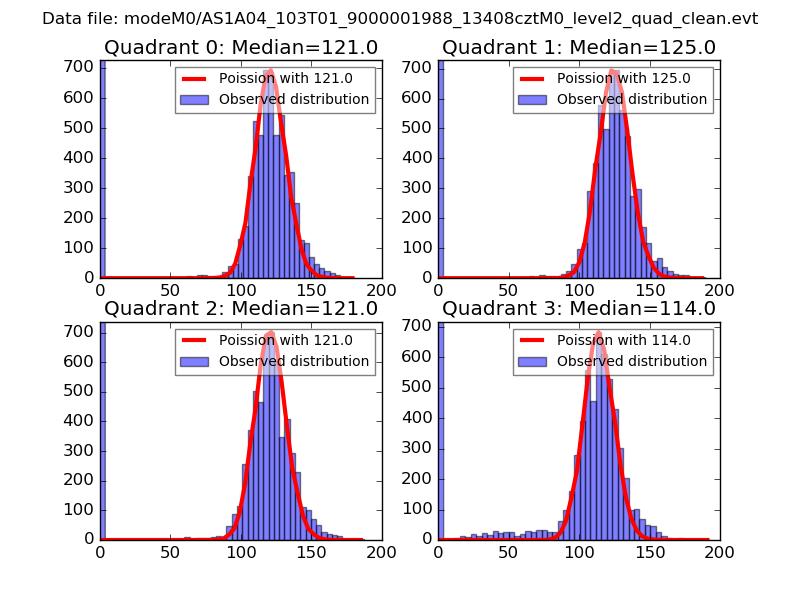 |
 |
| Quadrant-wise count rates Data is divided into 100 sec bins |
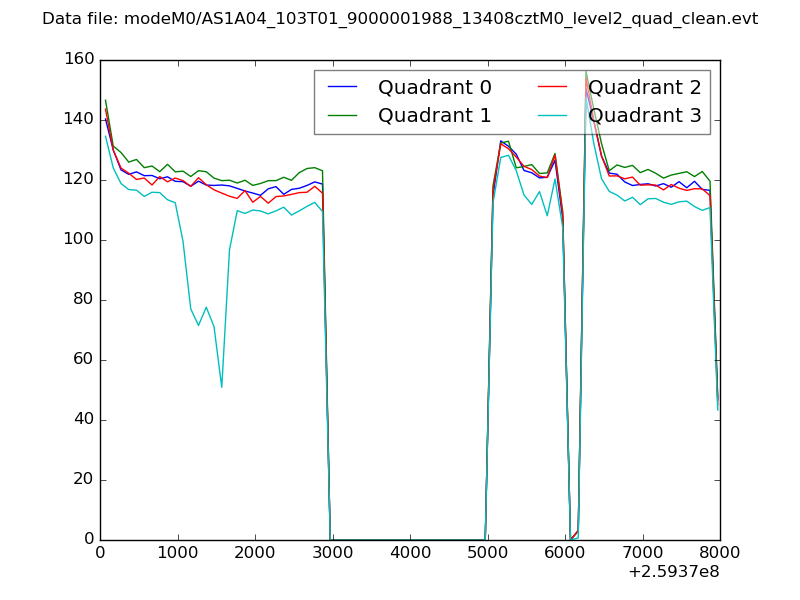 |
|
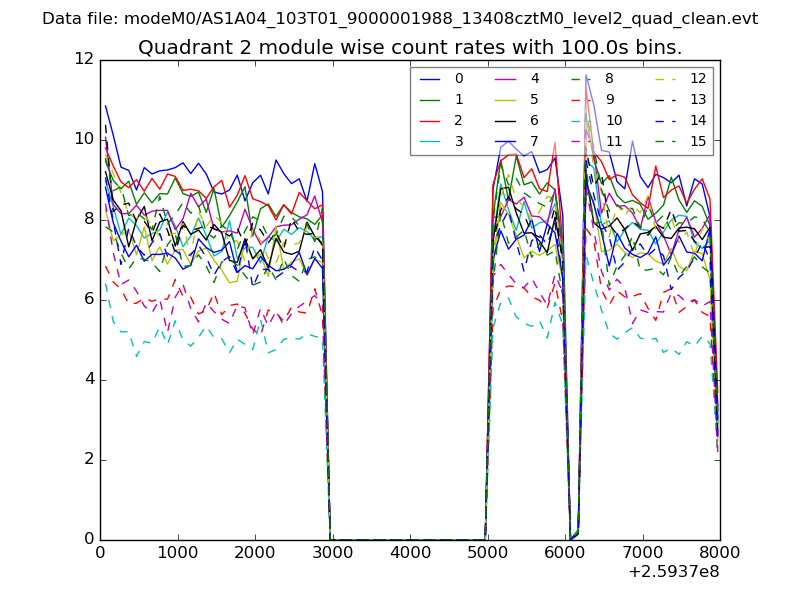
| Module-wise count rates for Quadrant A Data is divided into 100 sec bins |
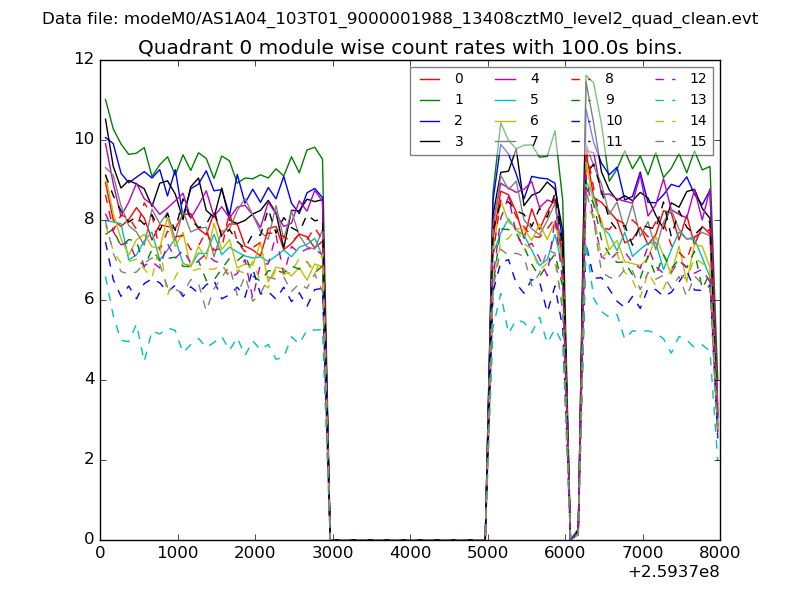 |
 |
| Module-wise count rates for Quadrant B Data is divided into 100 sec bins |
 |
 |
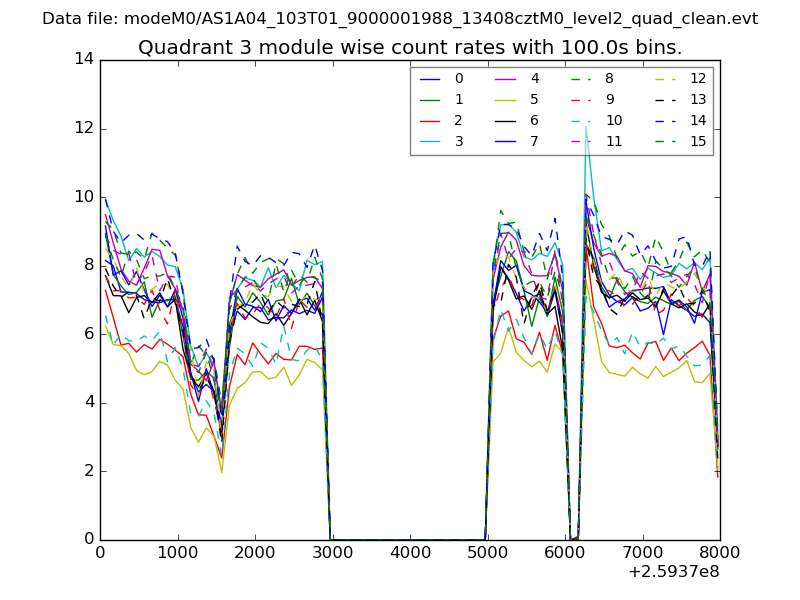
| Module-wise count rates for Quadrant C Data is divided into 100 sec bins |
 |
 |
| Module-wise count rates for Quadrant D Data is divided into 100 sec bins |
 |
 |
| Parameter | Plot |
|---|---|
| CZT HV Monitor | 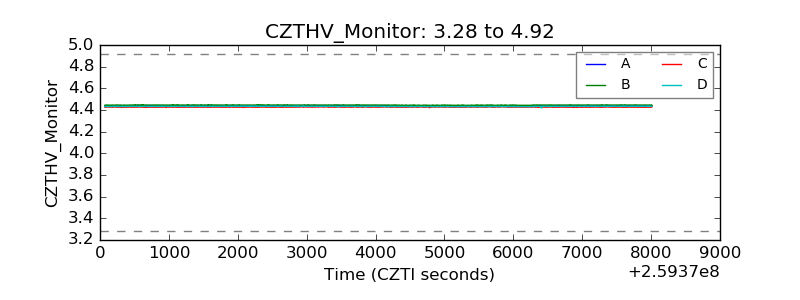 |
| D_VDD | 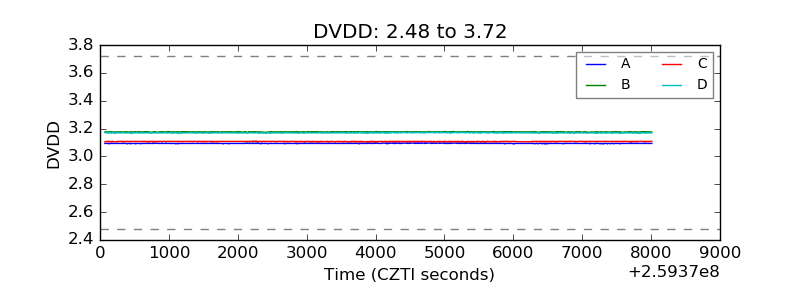 |
| Temperature 1 |  |
| Veto HV Monitor | 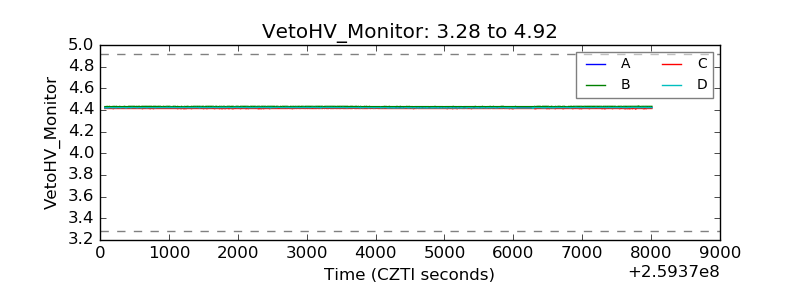 |
| Veto LLD | 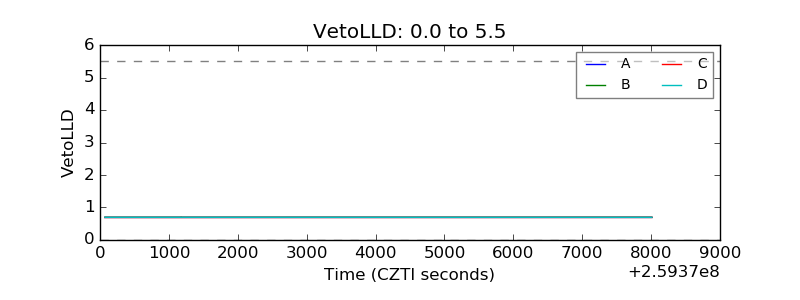 |
| Alpha Counter | 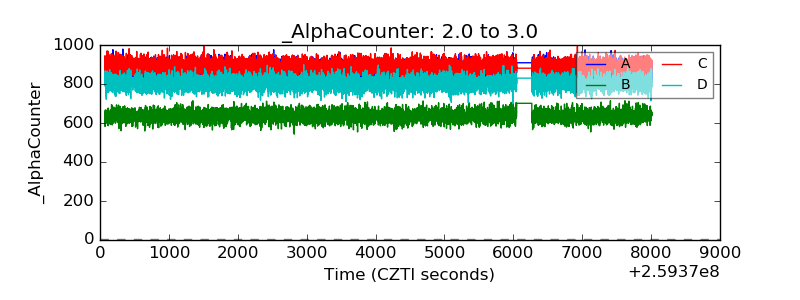 |
| _CPM_Rate | 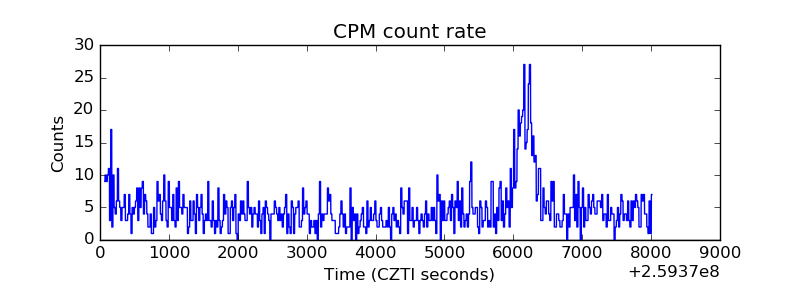 |
| CZT Counter | 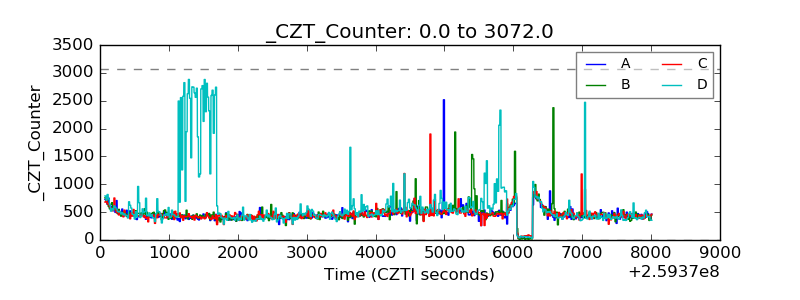 |
| +2.5 Volts monitor | 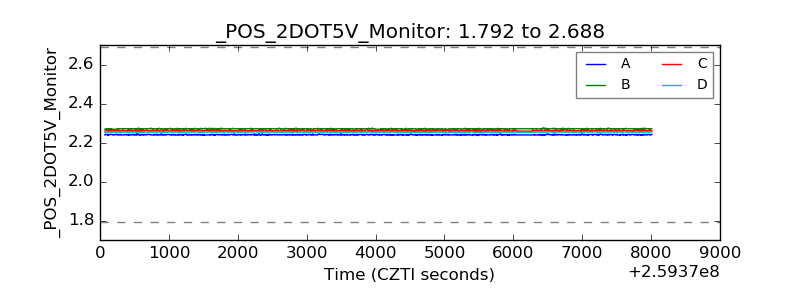 |
| +5 Volts monitor |  |
| _ROLL_ROT | 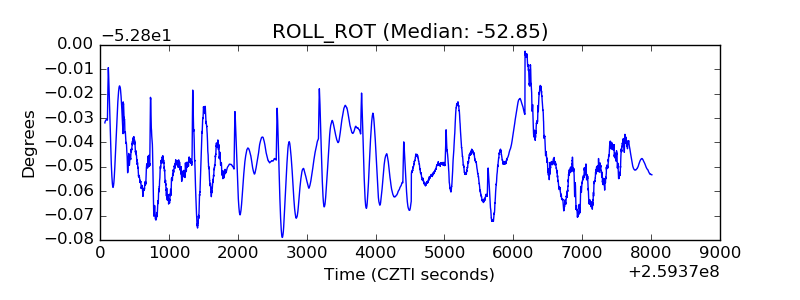 |
| _Roll_DEC | 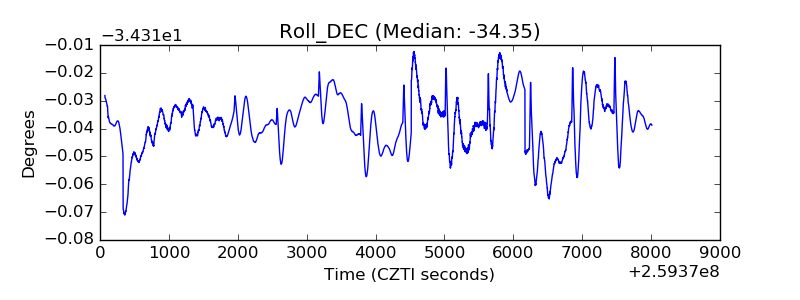 |
| _Roll_RA | 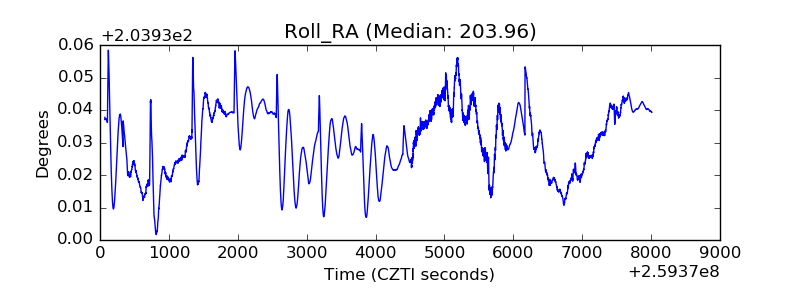 |
| Veto Counter | 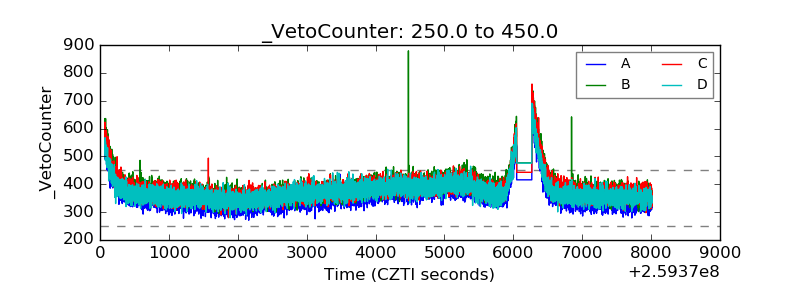 |