| Param | Original file | Final file |
|---|---|---|
| Filename | modeM0/AS1A04_103T01_9000001988_13411cztM0_level2.evt | modeM0/AS1A04_103T01_9000001988_13411cztM0_level2_quad_clean.evt |
| Size (bytes) | 1,295,936,640 | 246,127,680 |
| Size | 1.2 GB | 234.7 MB |
| Events in quadrant A | 8,795,957 | 1,547,350 |
| Events in quadrant B | 9,164,940 | 1,583,209 |
| Events in quadrant C | 9,032,254 | 1,543,572 |
| Events in quadrant D | 10,957,899 | 1,459,623 |
| Mode M0 | |||
|---|---|---|---|
| Quadrant | BADHDUFLAG | Total packets | Discarded packets |
| A | 0 | 39056 | 5 |
| B | 0 | 39642 | 4 |
| C | 0 | 39243 | 4 |
| D | 0 | 45190 | 4 |
| Mode SS | |||
|---|---|---|---|
| Quadrant | BADHDUFLAG | Total packets | Discarded packets |
| A | 0 | 396 | 0 |
| B | 0 | 396 | 0 |
| C | 0 | 396 | 0 |
| D | 0 | 396 | 0 |
| Mode M9 | |||
|---|---|---|---|
| Quadrant | BADHDUFLAG | Total packets | Discarded packets |
| A | 0 | 17 | 0 |
| B | 0 | 17 | 0 |
| C | 0 | 17 | 0 |
| D | 0 | 17 | 0 |
| Quadrant | Total seconds | Saturated seconds | Saturation percentage |
|---|---|---|---|
| A | 19156 | 177 | 0.923992% |
| B | 19156 | 254 | 1.325955% |
| C | 19156 | 189 | 0.986636% |
| D | 19156 | 300 | 1.566089% |
Noise dominated data is calculated using 1-second bins in cleaned event files. If a bin has >2000 counts, and if more than 50% of those come from <1% of pixels, then it is considered to be noise-dominated and hence unusable.
| Quadrant | # 1 sec bins | Bins with >0 counts | Bins with >2000 counts | High rate bins dominated by noise | Noise dominated (total time) | Noise dominated (detector-on time) | Marked lightcurve |
|---|---|---|---|---|---|---|---|
| A | 21042 | 19157 | 4 | 4 | 0.02% | 0.02% | 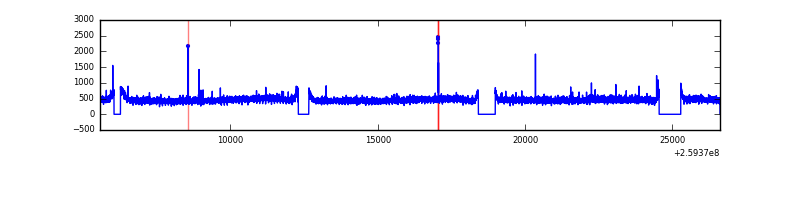 |
| B | 21042 | 19157 | 16 | 16 | 0.08% | 0.08% | 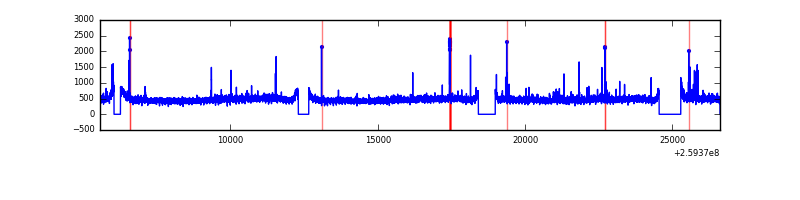 |
| C | 21042 | 19158 | 2 | 2 | 0.01% | 0.01% | 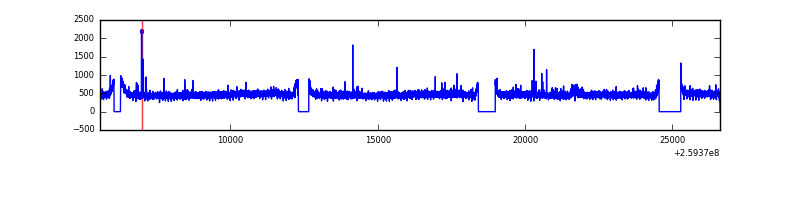 |
| D | 21042 | 19158 | 112 | 112 | 0.53% | 0.58% | 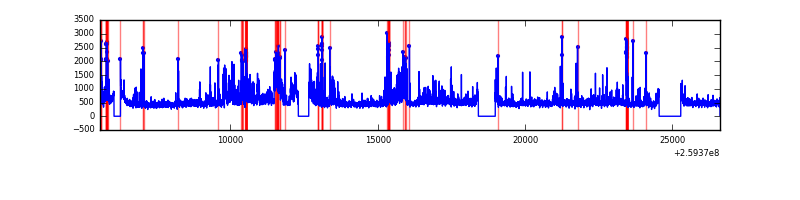 |
Top three noisy pixels from each quadrant. If the there are fewer than three noisy pixels in the level2.evt file, extra rows are filled as -1
| Pixel properties | Quadrant properties | ||||||
|---|---|---|---|---|---|---|---|
| Quadrant | DetID | PixID | Counts | Sigma | Mean | Median | Sigma |
| A | 1 | 162 | 45551 | 94.53 | 2266 | 2214 | 458.4 |
| A | 0 | 226 | 19952 | 38.69 | 2266 | 2214 | 458.4 |
| A | 12 | 194 | 17179 | 32.64 | 2266 | 2214 | 458.4 |
| B | 3 | 64 | 129031 | 290.36 | 2271 | 2208 | 436.8 |
| B | 0 | 214 | 87678 | 195.69 | 2271 | 2208 | 436.8 |
| B | 12 | 111 | 52066 | 114.15 | 2271 | 2208 | 436.8 |
| C | 3 | 233 | 279937 | 542.14 | 2217 | 2224 | 512.2 |
| C | 14 | 220 | 106687 | 203.93 | 2217 | 2224 | 512.2 |
| C | 13 | 61 | 15942 | 26.78 | 2217 | 2224 | 512.2 |
| D | 8 | 195 | 1758012 | 3340.81 | 2188 | 2124 | 525.6 |
| D | 1 | 52 | 292576 | 552.62 | 2188 | 2124 | 525.6 |
| D | 13 | 249 | 264239 | 498.71 | 2188 | 2124 | 525.6 |
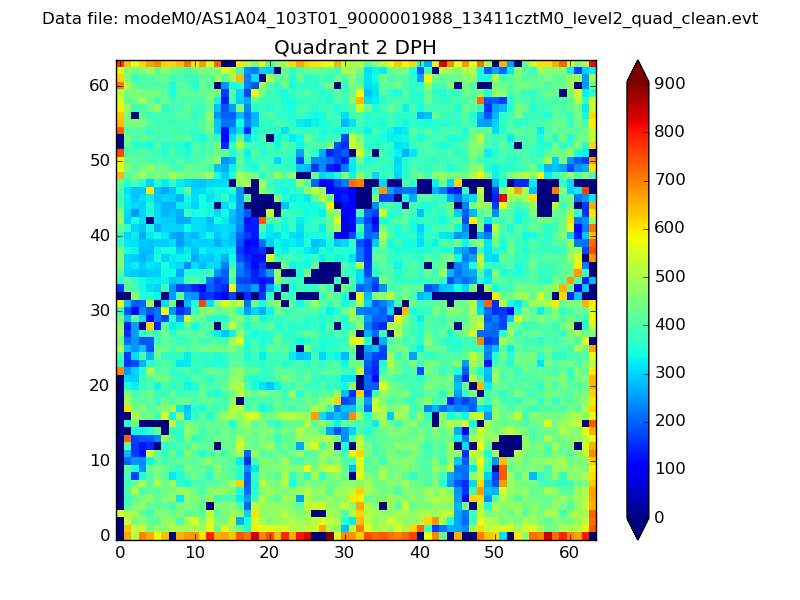
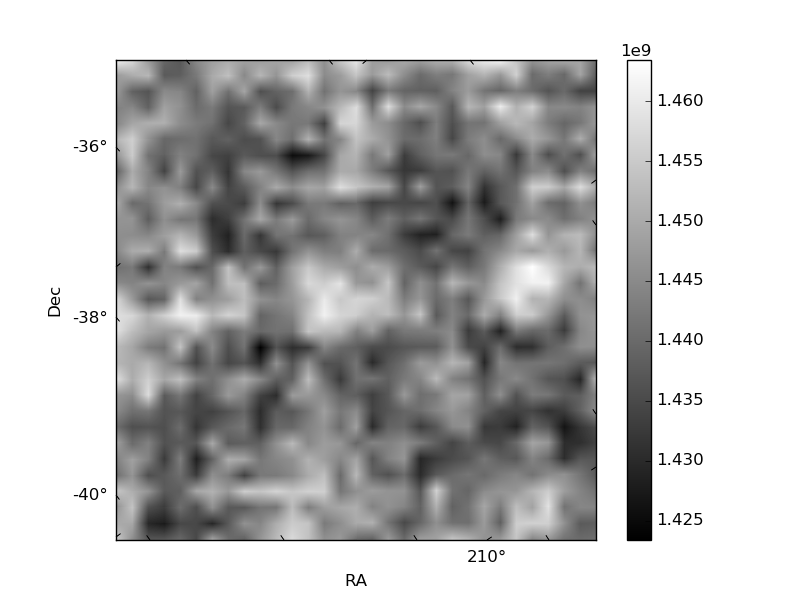
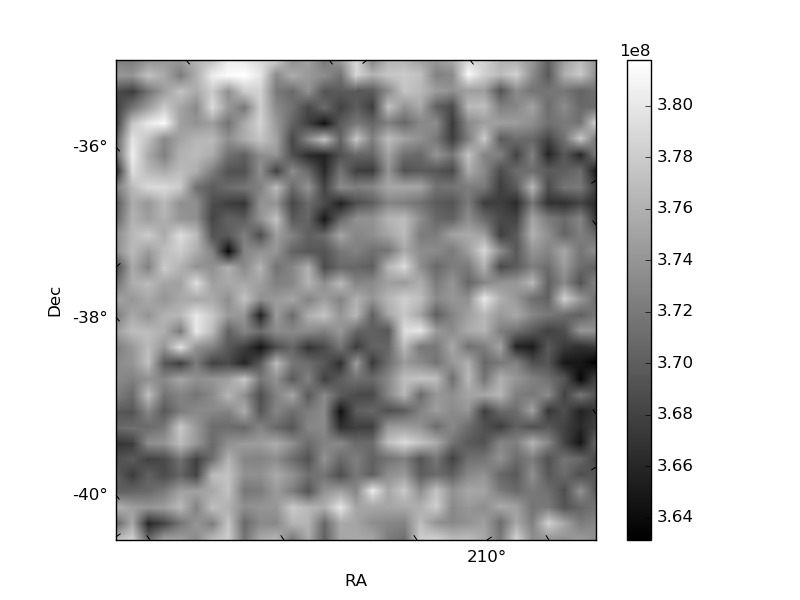
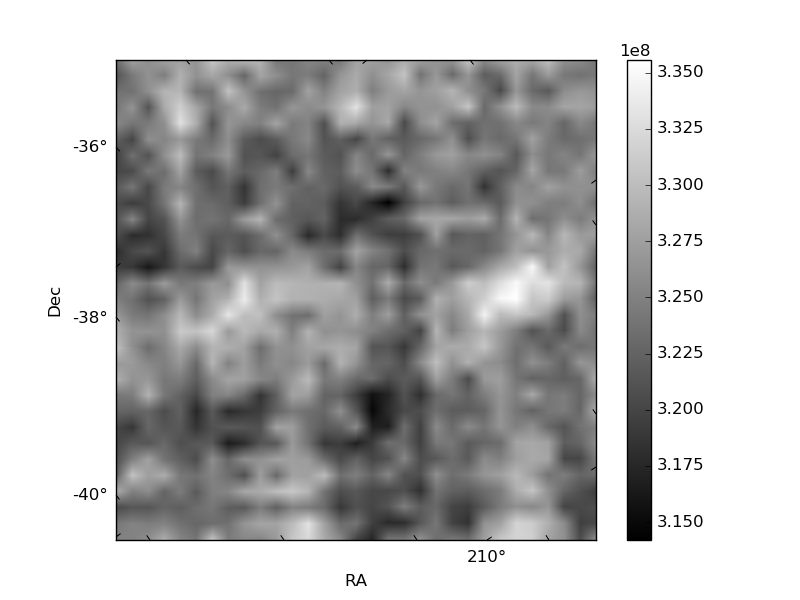
Histogram calculated using DETX and DETY for each event in the final _common_clean file
| Quadrant A | 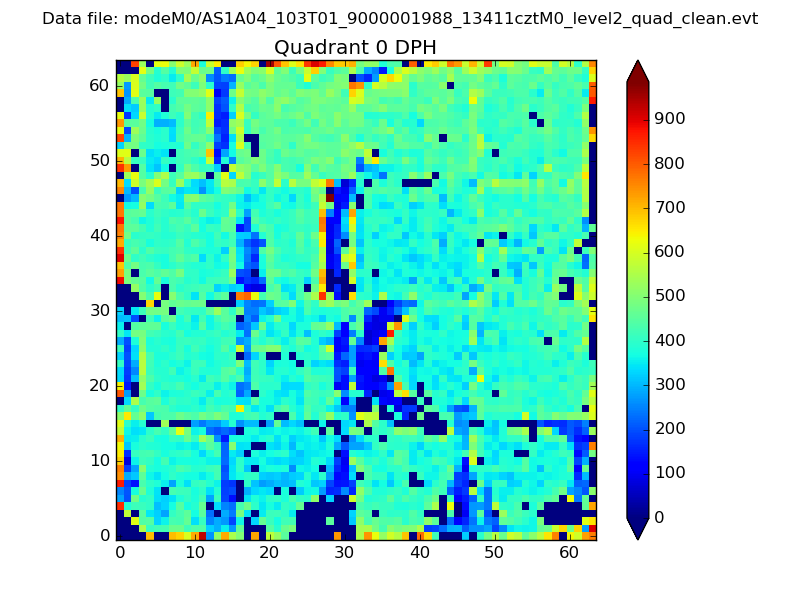 |
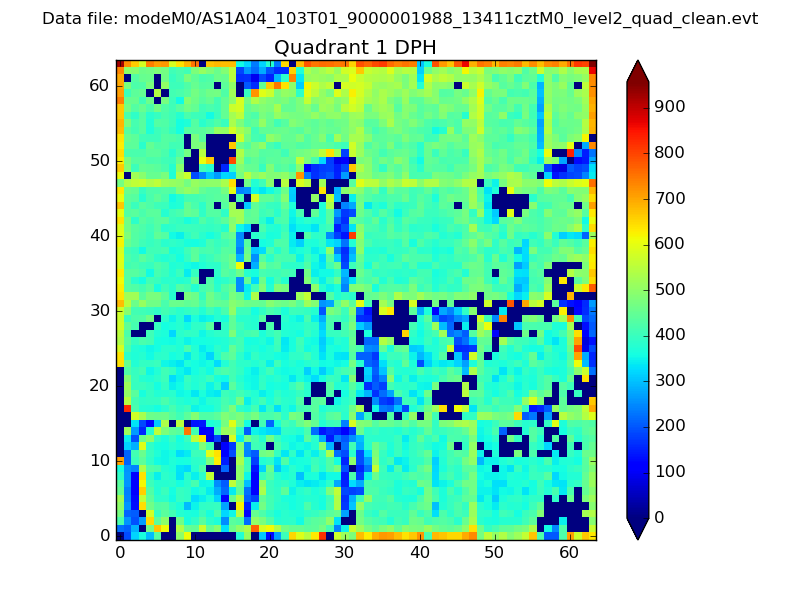 |
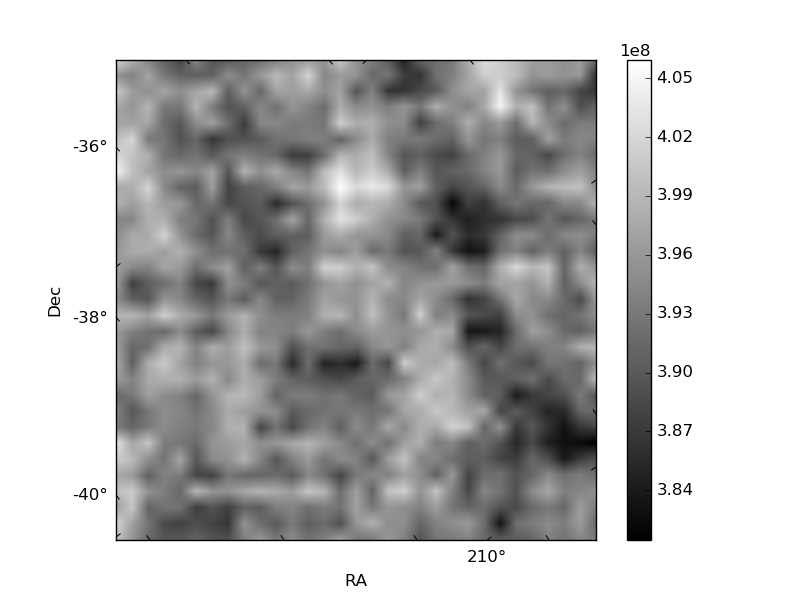
Quadrant B |
|---|---|---|---|
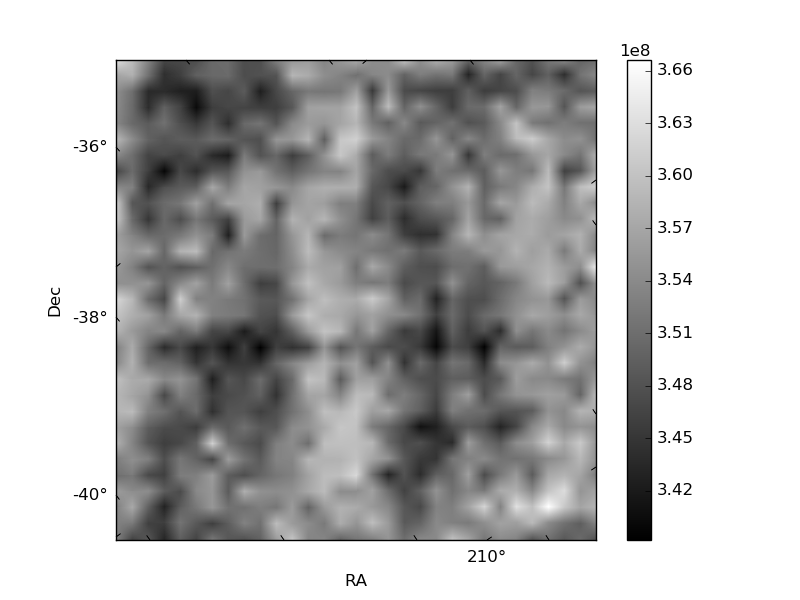
| Quadrant D | 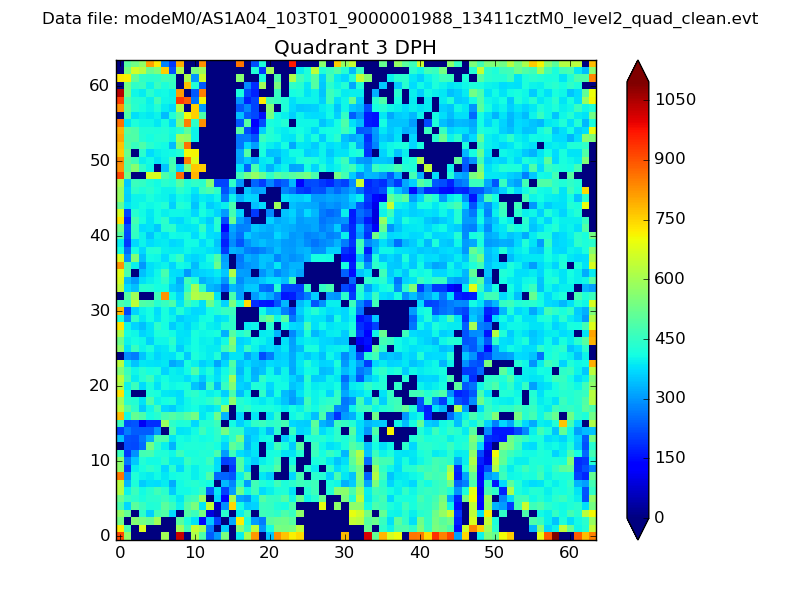 |
 |
Quadrant C |
| Plot type | Count rate plots | Images |
|---|---|---|
| Comparison with Poisson distribution Blue bars denote a histogram of data divided into 1 sec bins. Red curve is a Poisson curve with rate = median count rate of data. |
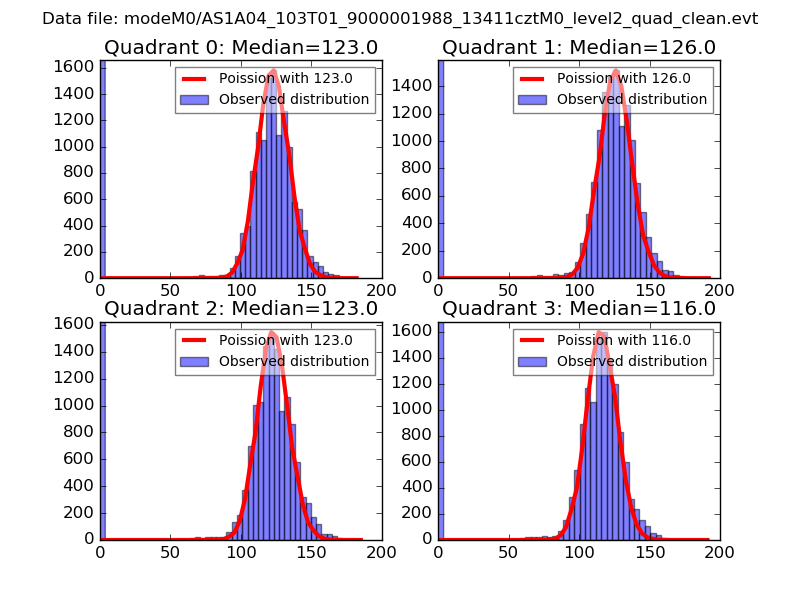 |
 |
| Quadrant-wise count rates Data is divided into 100 sec bins |
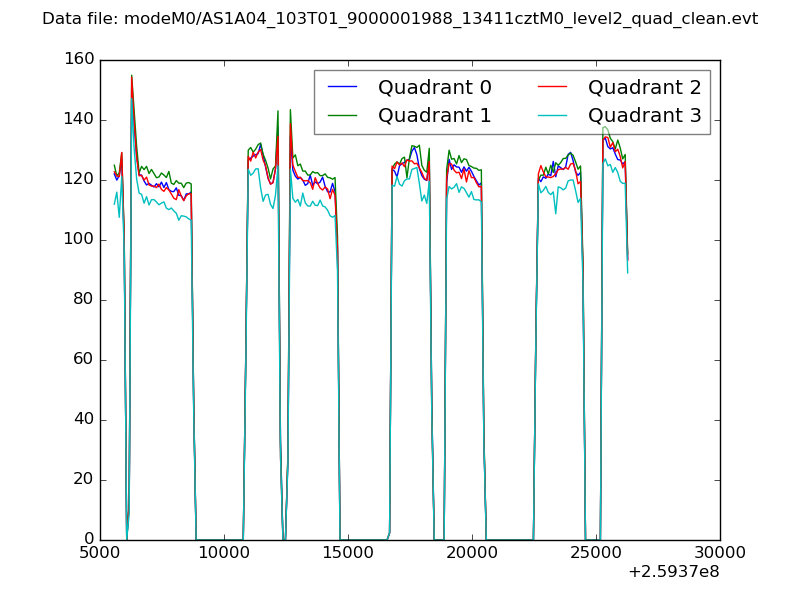 |
|
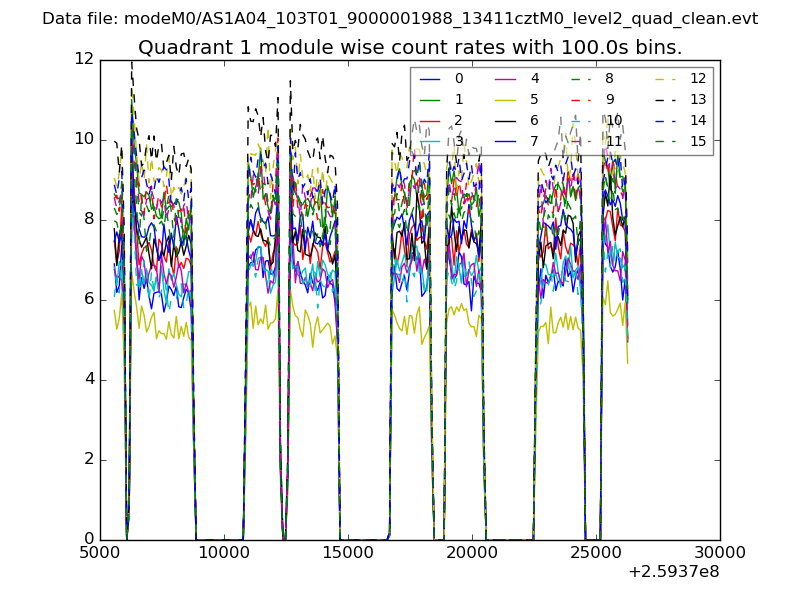
| Module-wise count rates for Quadrant A Data is divided into 100 sec bins |
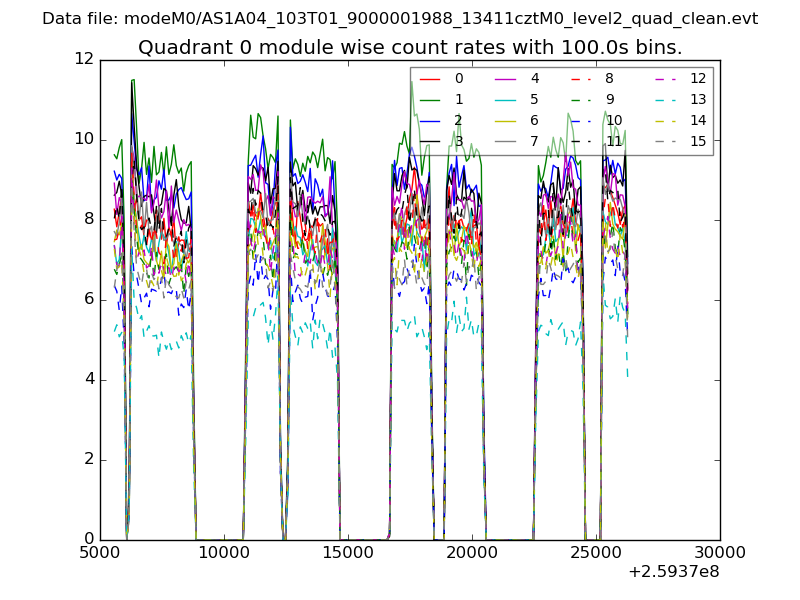 |
 |
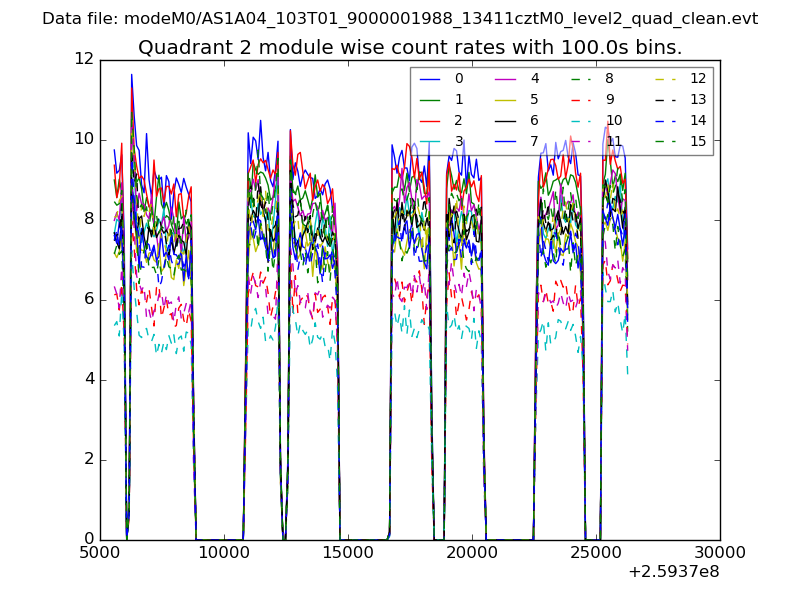
| Module-wise count rates for Quadrant B Data is divided into 100 sec bins |
 |
 |
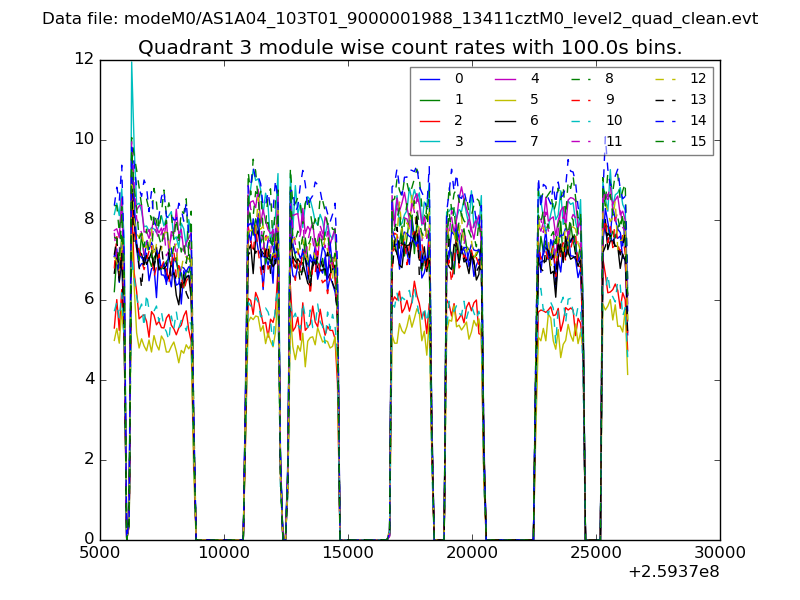
| Module-wise count rates for Quadrant C Data is divided into 100 sec bins |
 |
 |
| Module-wise count rates for Quadrant D Data is divided into 100 sec bins |
 |
 |
| Parameter | Plot |
|---|---|
| CZT HV Monitor | 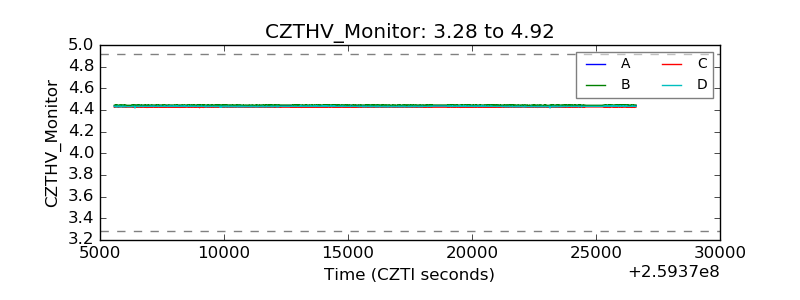 |
| D_VDD | 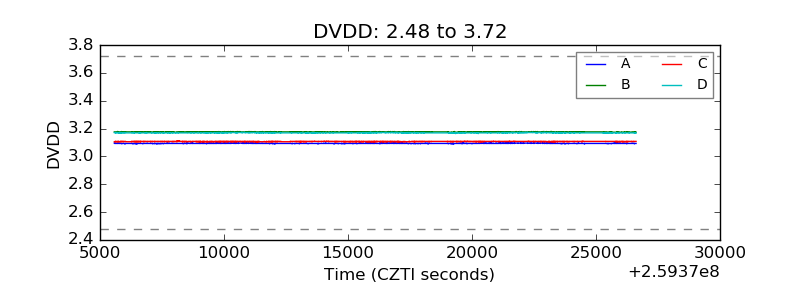 |
| Temperature 1 | 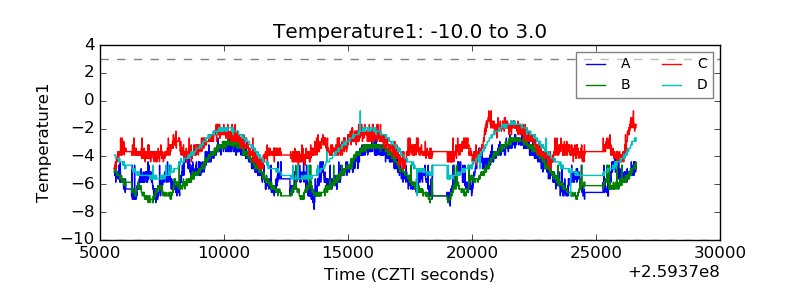 |
| Veto HV Monitor |  |
| Veto LLD | 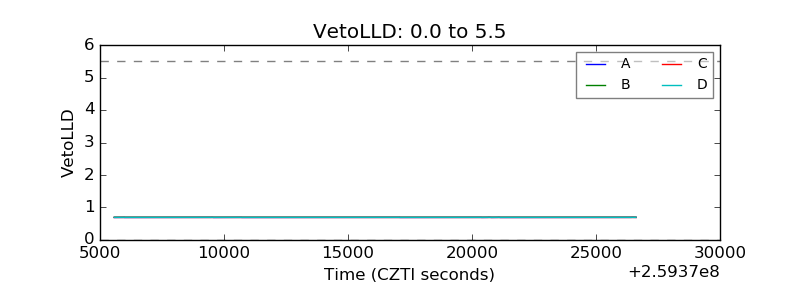 |
| Alpha Counter | 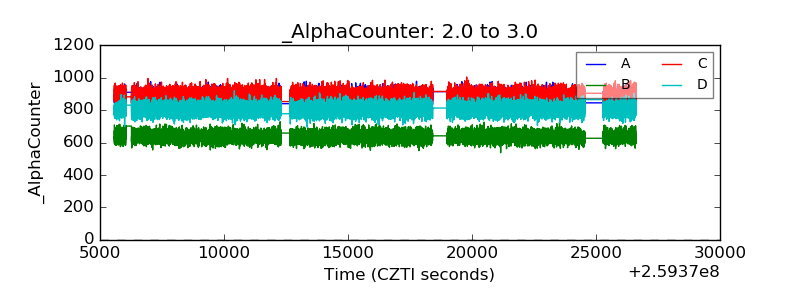 |
| _CPM_Rate | 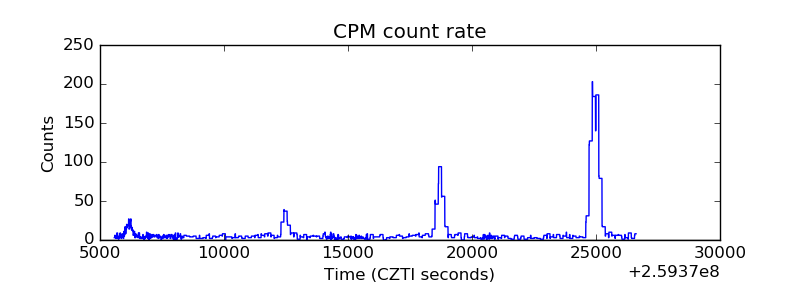 |
| CZT Counter | 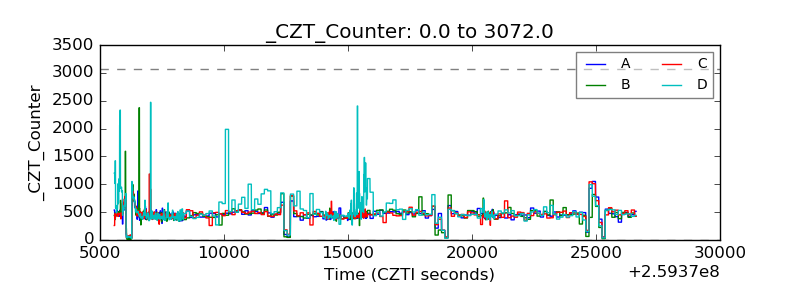 |
| +2.5 Volts monitor |  |
| +5 Volts monitor |  |
| _ROLL_ROT | 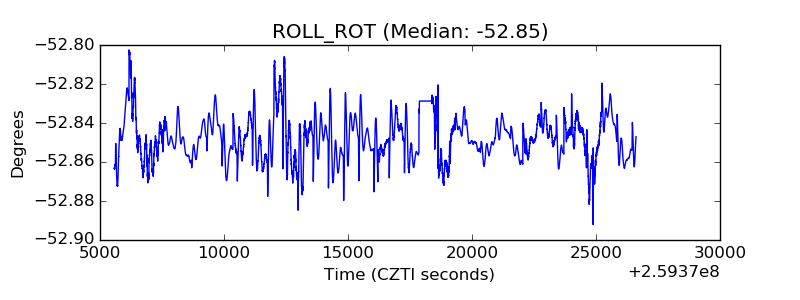 |
| _Roll_DEC |  |
| _Roll_RA | 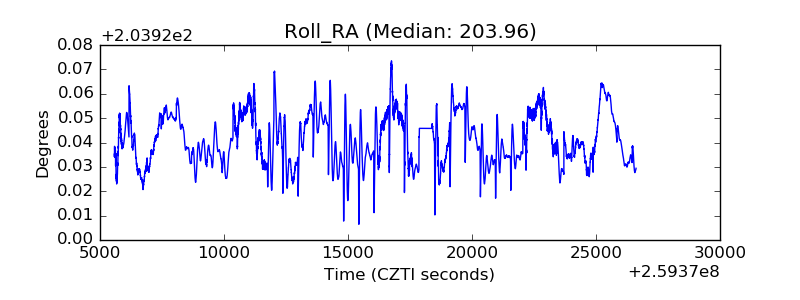 |
| Veto Counter | 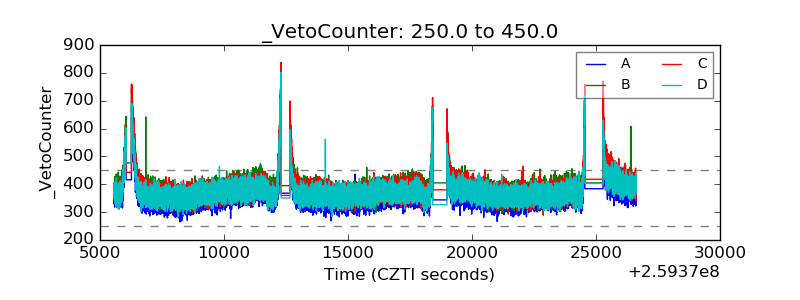 |