| Param | Original file | Final file |
|---|---|---|
| Filename | modeM0/AS1A04_103T01_9000001988_13413cztM0_level2.evt | modeM0/AS1A04_103T01_9000001988_13413cztM0_level2_quad_clean.evt |
| Size (bytes) | 825,189,120 | 121,109,760 |
| Size | 787.0 MB | 115.5 MB |
| Events in quadrant A | 5,302,463 | 745,201 |
| Events in quadrant B | 7,704,277 | 688,177 |
| Events in quadrant C | 5,289,213 | 746,238 |
| Events in quadrant D | 5,933,931 | 710,256 |
| Mode M0 | |||
|---|---|---|---|
| Quadrant | BADHDUFLAG | Total packets | Discarded packets |
| A | 0 | 23199 | 3 |
| B | 0 | 30270 | 2 |
| C | 0 | 23099 | 2 |
| D | 0 | 24945 | 2 |
| Mode SS | |||
|---|---|---|---|
| Quadrant | BADHDUFLAG | Total packets | Discarded packets |
| A | 0 | 230 | 0 |
| B | 0 | 230 | 0 |
| C | 0 | 230 | 0 |
| D | 0 | 230 | 0 |
| Mode M9 | |||
|---|---|---|---|
| Quadrant | BADHDUFLAG | Total packets | Discarded packets |
| A | 0 | 18 | 0 |
| B | 0 | 18 | 0 |
| C | 0 | 18 | 0 |
| D | 0 | 18 | 0 |
| Quadrant | Total seconds | Saturated seconds | Saturation percentage |
|---|---|---|---|
| A | 11230 | 104 | 0.926091% |
| B | 11230 | 1165 | 10.373998% |
| C | 11230 | 92 | 0.819234% |
| D | 11230 | 105 | 0.934996% |
Noise dominated data is calculated using 1-second bins in cleaned event files. If a bin has >2000 counts, and if more than 50% of those come from <1% of pixels, then it is considered to be noise-dominated and hence unusable.
| Quadrant | # 1 sec bins | Bins with >0 counts | Bins with >2000 counts | High rate bins dominated by noise | Noise dominated (total time) | Noise dominated (detector-on time) | Marked lightcurve |
|---|---|---|---|---|---|---|---|
| A | 13161 | 11231 | 0 | 0 | 0.00% | 0.00% | 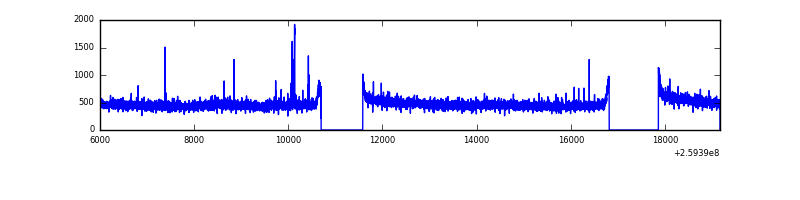 |
| B | 13161 | 11231 | 889 | 889 | 6.75% | 7.92% |  |
| C | 13161 | 11231 | 0 | 0 | 0.00% | 0.00% | 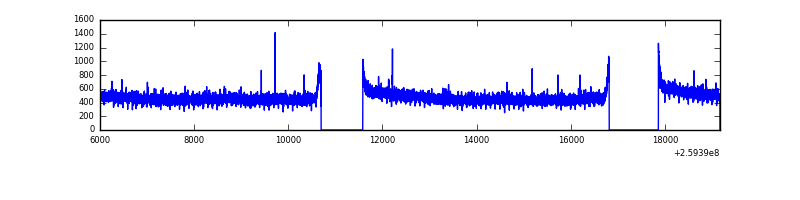 |
| D | 13161 | 11231 | 24 | 24 | 0.18% | 0.21% | 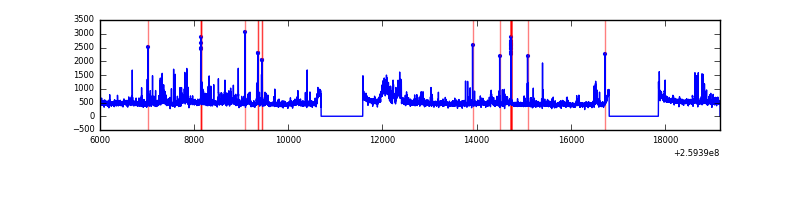 |
Top three noisy pixels from each quadrant. If the there are fewer than three noisy pixels in the level2.evt file, extra rows are filled as -1
| Pixel properties | Quadrant properties | ||||||
|---|---|---|---|---|---|---|---|
| Quadrant | DetID | PixID | Counts | Sigma | Mean | Median | Sigma |
| A | 15 | 69 | 50547 | 179.79 | 1354 | 1323 | 273.8 |
| A | 1 | 162 | 19232 | 65.41 | 1354 | 1323 | 273.8 |
| A | 2 | 250 | 15271 | 50.94 | 1354 | 1323 | 273.8 |
| B | 3 | 64 | 2634714 | 10940.83 | 1267 | 1236 | 240.7 |
| B | 0 | 230 | 46279 | 187.13 | 1267 | 1236 | 240.7 |
| B | 0 | 214 | 35616 | 142.83 | 1267 | 1236 | 240.7 |
| C | 3 | 233 | 125074 | 406.8 | 1322 | 1327 | 304.2 |
| C | 13 | 61 | 9325 | 26.29 | 1322 | 1327 | 304.2 |
| C | 14 | 220 | 9315 | 26.26 | 1322 | 1327 | 304.2 |
| D | 8 | 195 | 511984 | 1615.27 | 1312 | 1271 | 316.2 |
| D | 1 | 52 | 319602 | 1006.81 | 1312 | 1271 | 316.2 |
| D | 2 | 225 | 61225 | 189.62 | 1312 | 1271 | 316.2 |
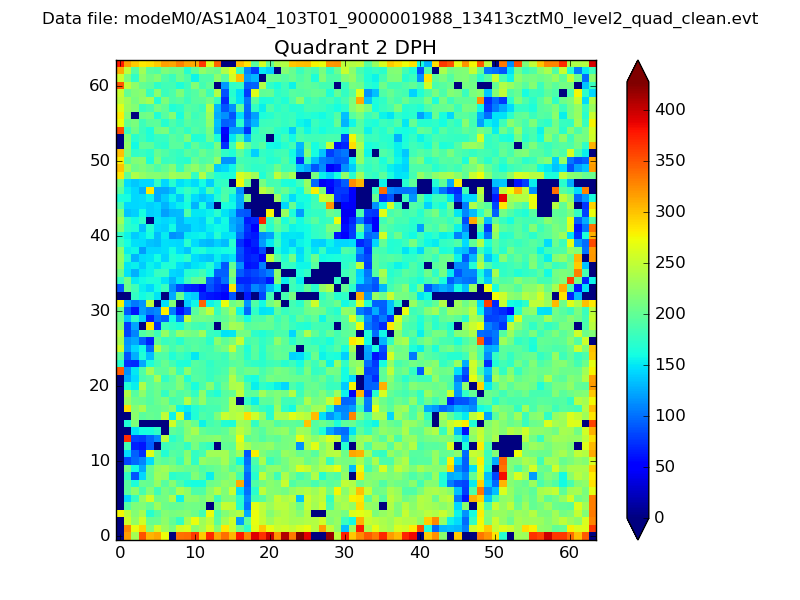
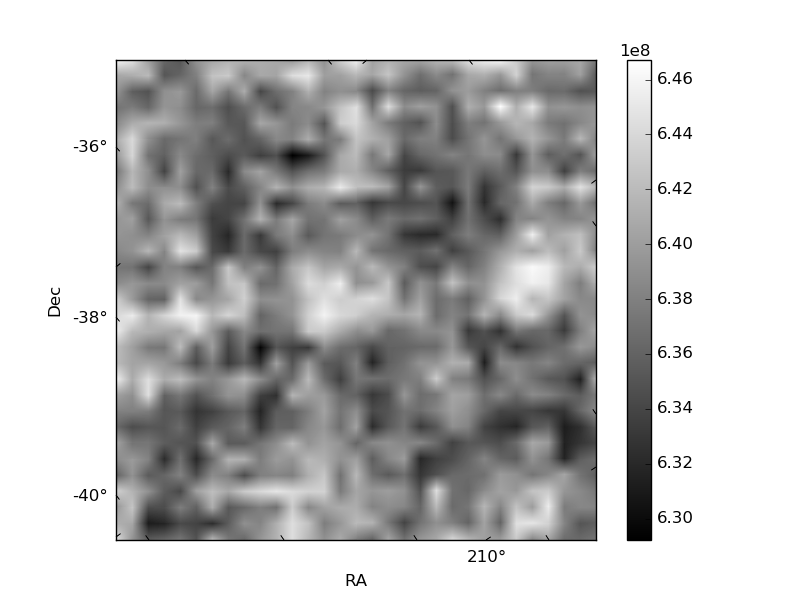
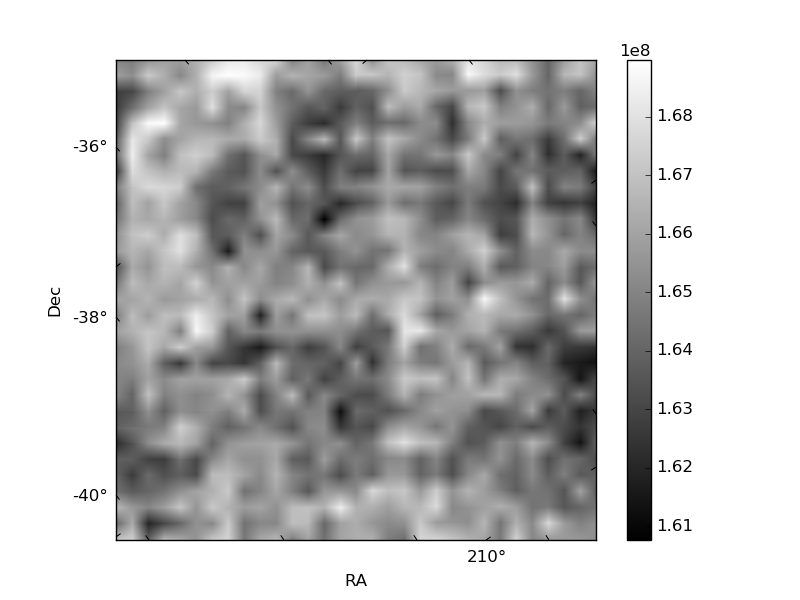
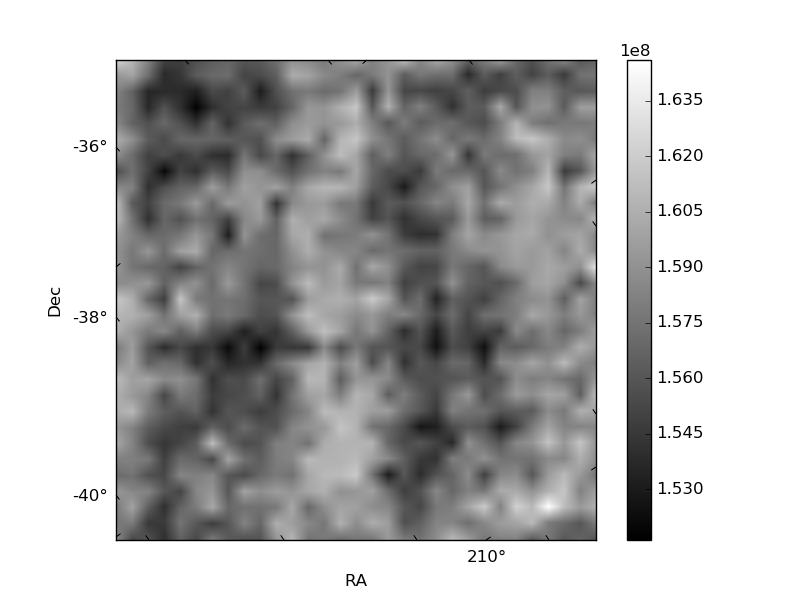
Histogram calculated using DETX and DETY for each event in the final _common_clean file
| Quadrant A | 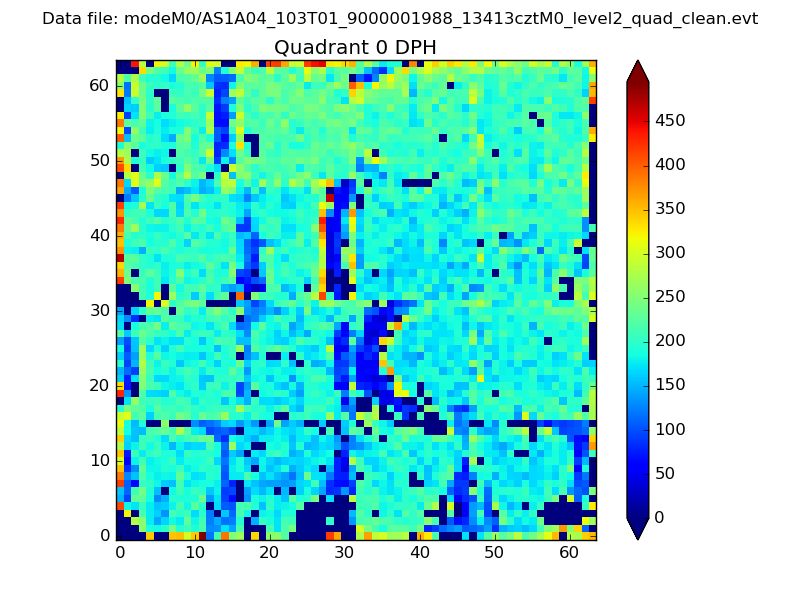 |
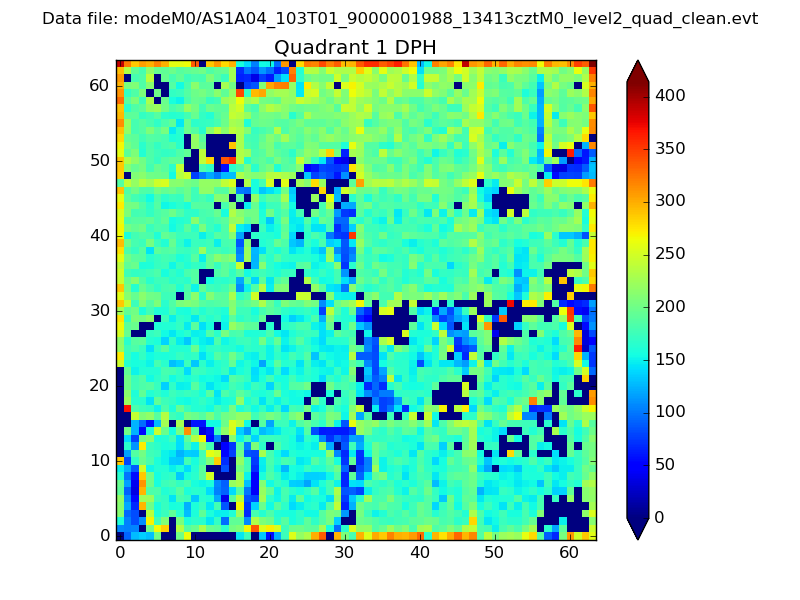 |
Quadrant B |
|---|---|---|---|
| Quadrant D | 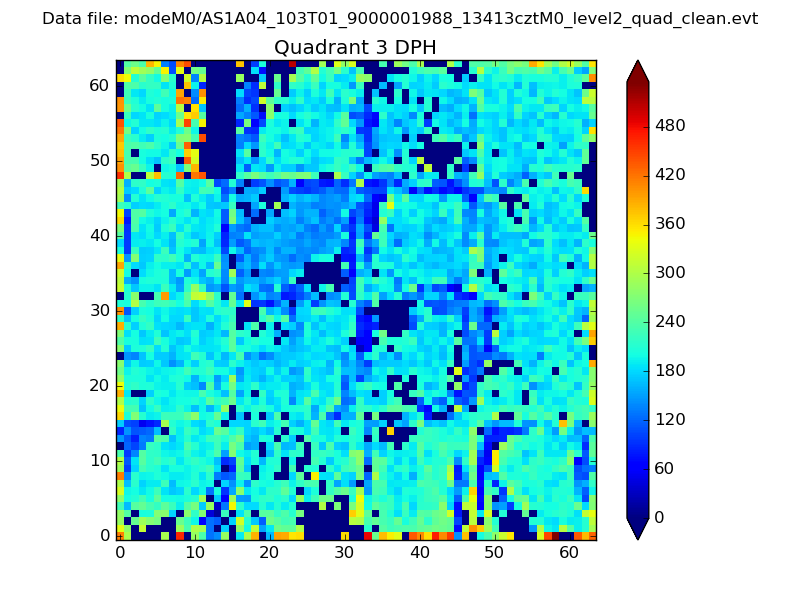 |
 |
Quadrant C |
| Plot type | Count rate plots | Images |
|---|---|---|
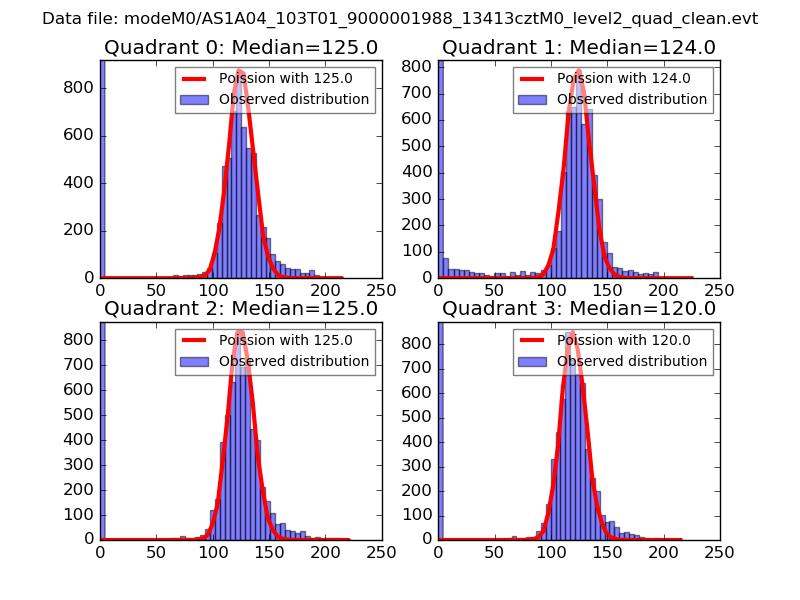
| Comparison with Poisson distribution Blue bars denote a histogram of data divided into 1 sec bins. Red curve is a Poisson curve with rate = median count rate of data. |
 |
 |
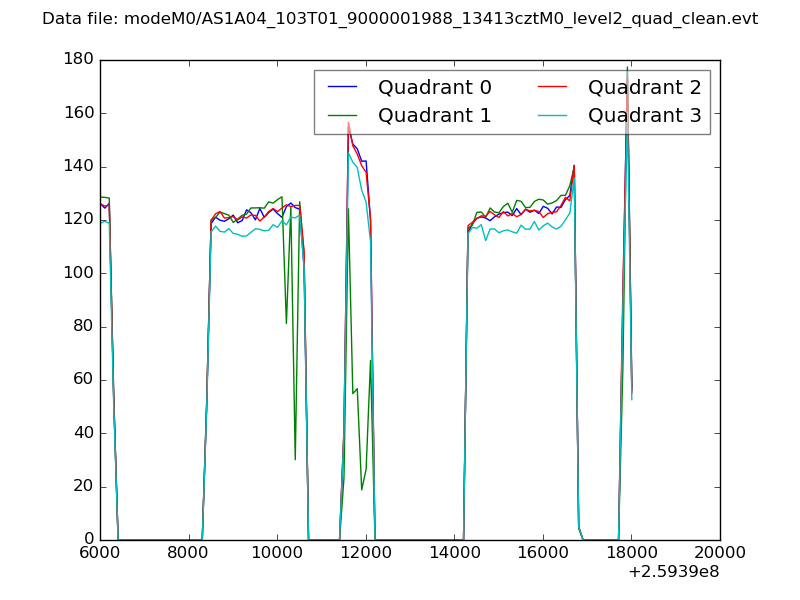
| Quadrant-wise count rates Data is divided into 100 sec bins |
 |
|
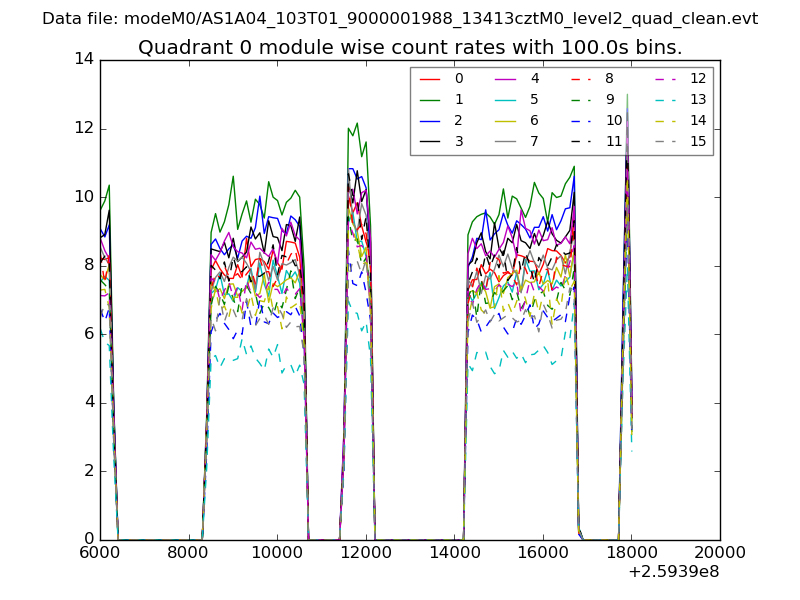
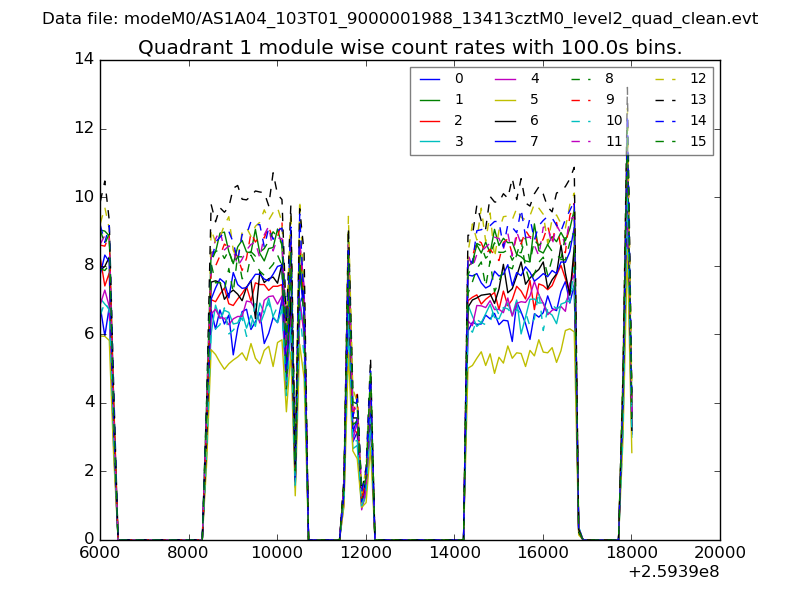
| Module-wise count rates for Quadrant A Data is divided into 100 sec bins |
 |
 |
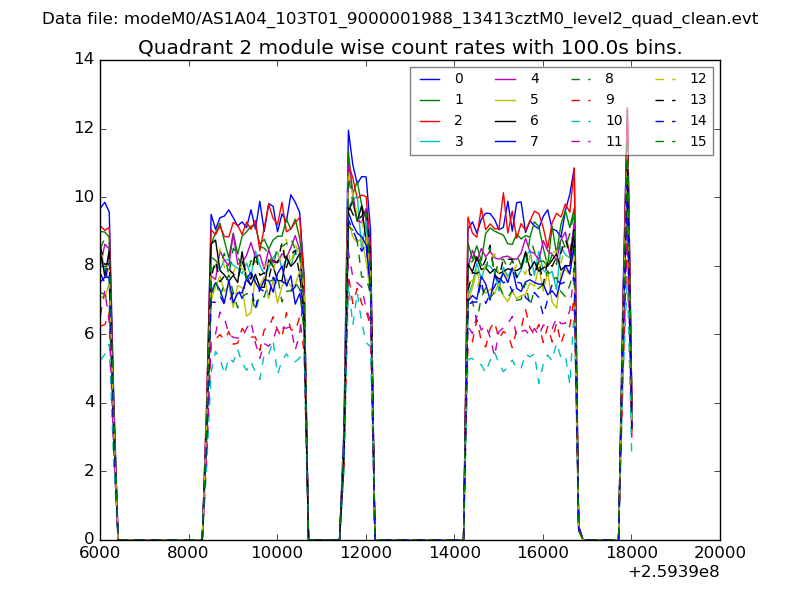
| Module-wise count rates for Quadrant B Data is divided into 100 sec bins |
 |
 |
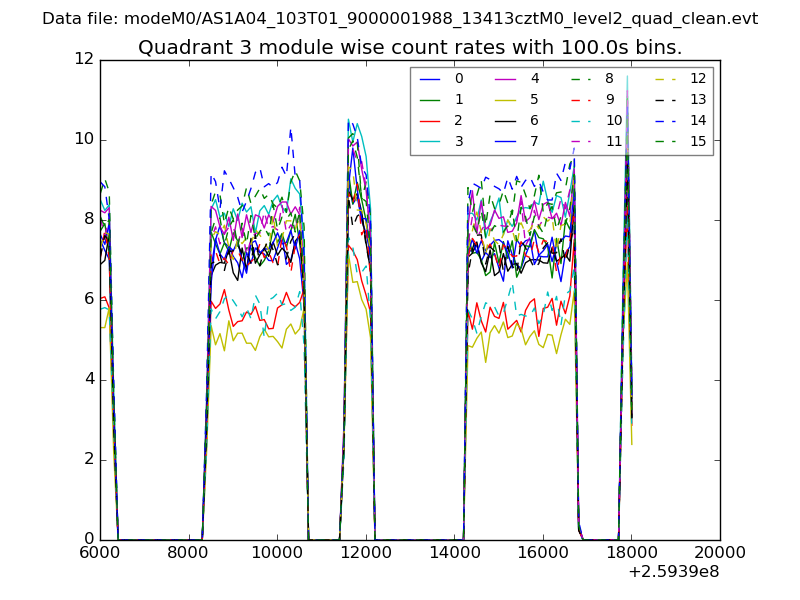
| Module-wise count rates for Quadrant C Data is divided into 100 sec bins |
 |
 |
| Module-wise count rates for Quadrant D Data is divided into 100 sec bins |
 |
 |
| Parameter | Plot |
|---|---|
| CZT HV Monitor | 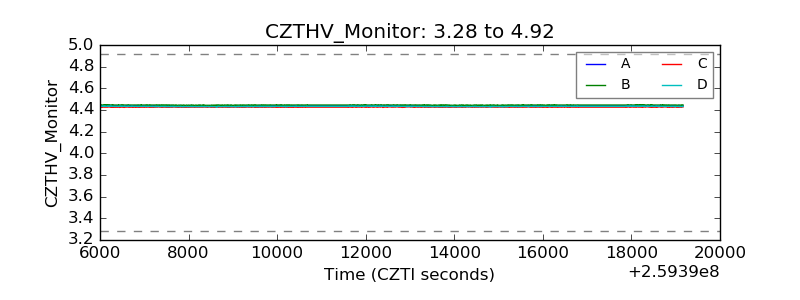 |
| D_VDD | 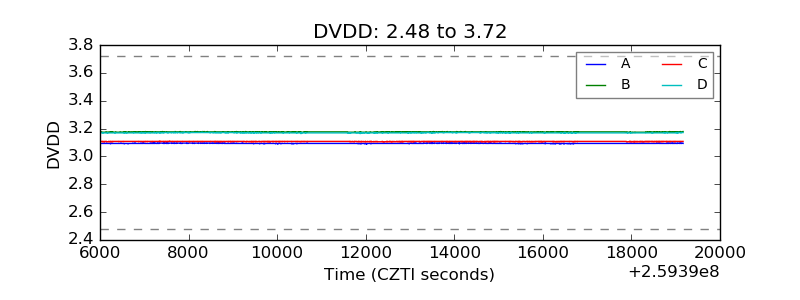 |
| Temperature 1 | 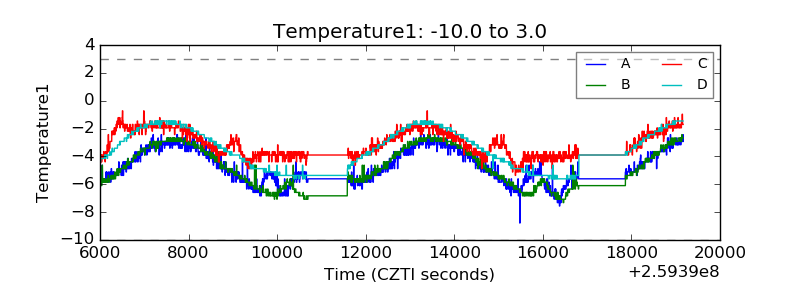 |
| Veto HV Monitor |  |
| Veto LLD | 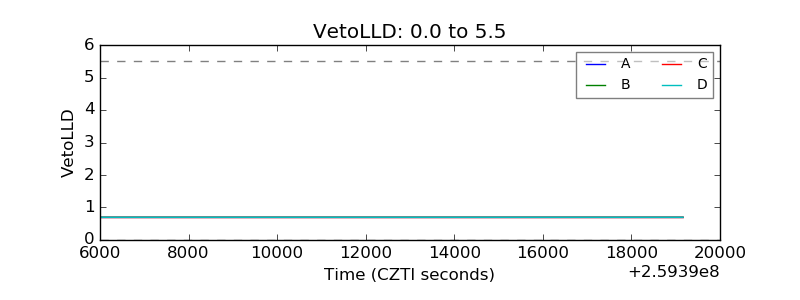 |
| Alpha Counter | 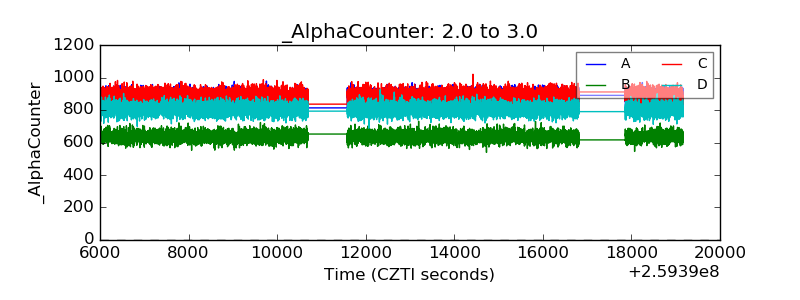 |
| _CPM_Rate | 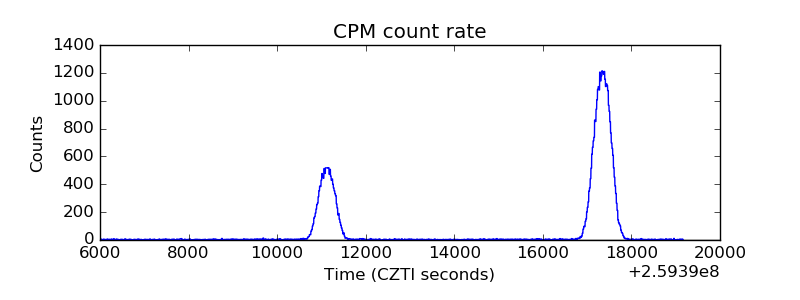 |
| CZT Counter | 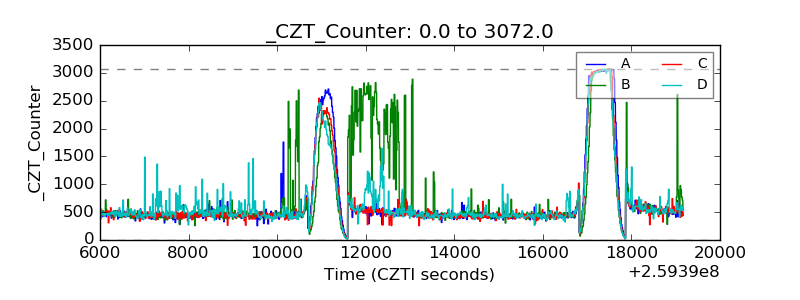 |
| +2.5 Volts monitor |  |
| +5 Volts monitor |  |
| _ROLL_ROT | 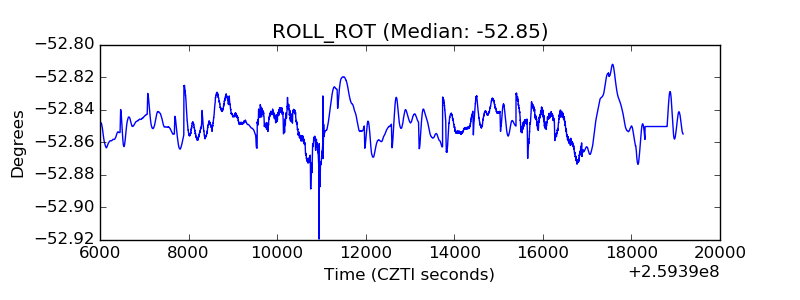 |
| _Roll_DEC | 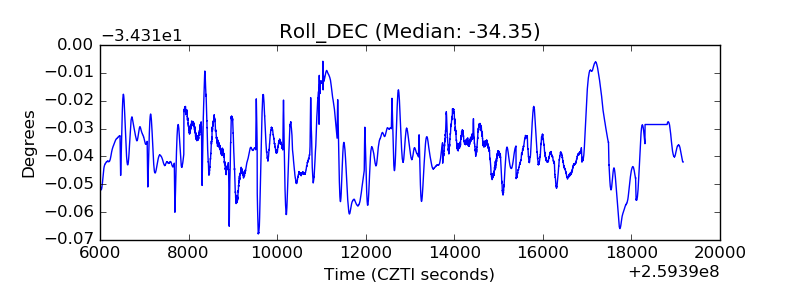 |
| _Roll_RA | 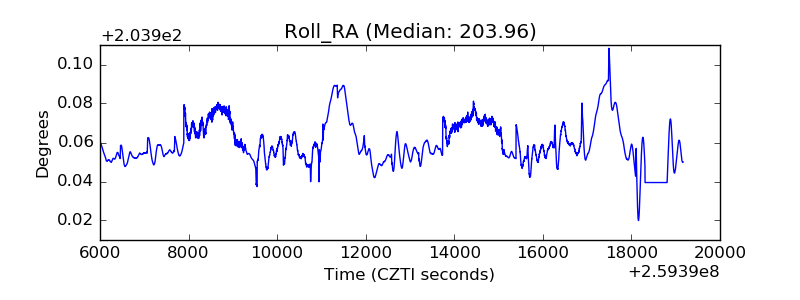 |
| Veto Counter | 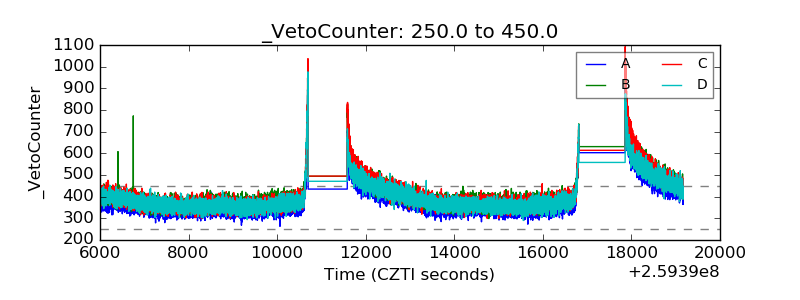 |