| Param | Original file | Final file |
|---|---|---|
| Filename | modeM0/AS1A04_103T01_9000001988_13415cztM0_level2.evt | modeM0/AS1A04_103T01_9000001988_13415cztM0_level2_quad_clean.evt |
| Size (bytes) | 486,587,520 | 65,557,440 |
| Size | 464.0 MB | 62.5 MB |
| Events in quadrant A | 3,257,879 | 389,704 |
| Events in quadrant B | 3,826,829 | 389,993 |
| Events in quadrant C | 3,257,903 | 390,379 |
| Events in quadrant D | 3,957,357 | 366,205 |
| Mode M0 | |||
|---|---|---|---|
| Quadrant | BADHDUFLAG | Total packets | Discarded packets |
| A | 0 | 13913 | 3 |
| B | 0 | 15527 | 2 |
| C | 0 | 13806 | 2 |
| D | 0 | 16008 | 2 |
| Mode SS | |||
|---|---|---|---|
| Quadrant | BADHDUFLAG | Total packets | Discarded packets |
| A | 0 | 130 | 0 |
| B | 0 | 130 | 0 |
| C | 0 | 130 | 0 |
| D | 0 | 130 | 0 |
| Mode M9 | |||
|---|---|---|---|
| Quadrant | BADHDUFLAG | Total packets | Discarded packets |
| A | 0 | 14 | 0 |
| B | 0 | 14 | 0 |
| C | 0 | 14 | 0 |
| D | 0 | 15 | 0 |
| Quadrant | Total seconds | Saturated seconds | Saturation percentage |
|---|---|---|---|
| A | 6429 | 76 | 1.182143% |
| B | 6429 | 240 | 3.733084% |
| C | 6429 | 52 | 0.808835% |
| D | 6429 | 156 | 2.426505% |
Noise dominated data is calculated using 1-second bins in cleaned event files. If a bin has >2000 counts, and if more than 50% of those come from <1% of pixels, then it is considered to be noise-dominated and hence unusable.
| Quadrant | # 1 sec bins | Bins with >0 counts | Bins with >2000 counts | High rate bins dominated by noise | Noise dominated (total time) | Noise dominated (detector-on time) | Marked lightcurve |
|---|---|---|---|---|---|---|---|
| A | 7595 | 6430 | 1 | 1 | 0.01% | 0.02% | 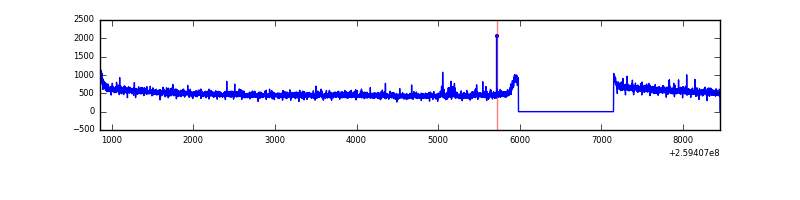 |
| B | 7595 | 6430 | 125 | 125 | 1.65% | 1.94% | 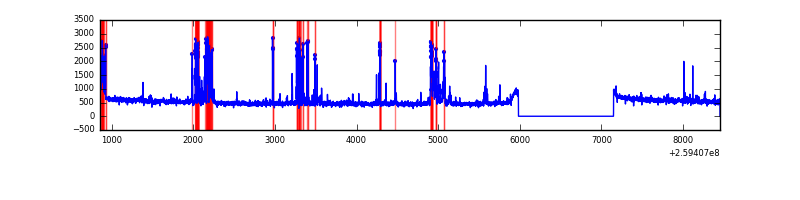 |
| C | 7595 | 6430 | 0 | 0 | 0.00% | 0.00% | 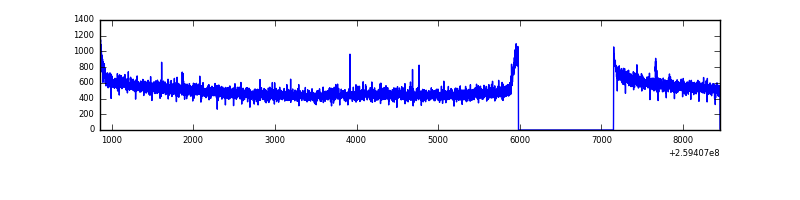 |
| D | 7595 | 6430 | 118 | 118 | 1.55% | 1.84% | 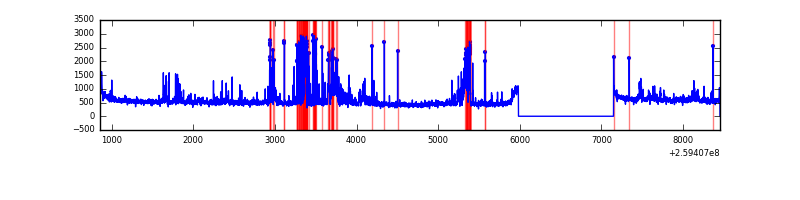 |
Top three noisy pixels from each quadrant. If the there are fewer than three noisy pixels in the level2.evt file, extra rows are filled as -1
| Pixel properties | Quadrant properties | ||||||
|---|---|---|---|---|---|---|---|
| Quadrant | DetID | PixID | Counts | Sigma | Mean | Median | Sigma |
| A | 8 | 15 | 42143 | 247.08 | 831 | 813 | 167.3 |
| A | 1 | 162 | 10204 | 56.14 | 831 | 813 | 167.3 |
| A | 0 | 226 | 7507 | 40.02 | 831 | 813 | 167.3 |
| B | 3 | 64 | 482703 | 3151.67 | 817 | 797 | 152.9 |
| B | 0 | 230 | 50423 | 324.55 | 817 | 797 | 152.9 |
| B | 15 | 201 | 34943 | 223.32 | 817 | 797 | 152.9 |
| C | 3 | 233 | 103188 | 554.73 | 806 | 811 | 184.6 |
| C | 14 | 220 | 10635 | 53.23 | 806 | 811 | 184.6 |
| C | 13 | 61 | 5763 | 26.83 | 806 | 811 | 184.6 |
| D | 1 | 52 | 508342 | 2702.2 | 796 | 774 | 187.8 |
| D | 8 | 195 | 214083 | 1135.62 | 796 | 774 | 187.8 |
| D | 2 | 14 | 88735 | 468.29 | 796 | 774 | 187.8 |
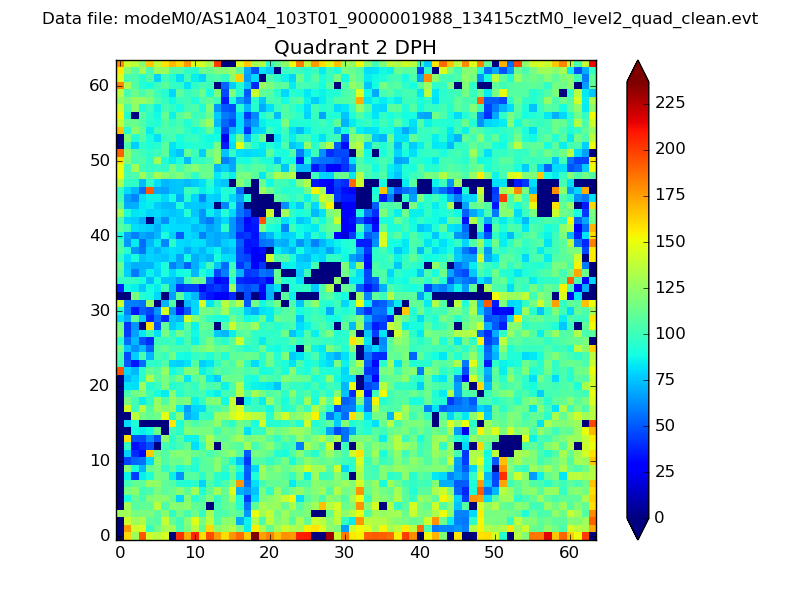
Histogram calculated using DETX and DETY for each event in the final _common_clean file
| Quadrant A | 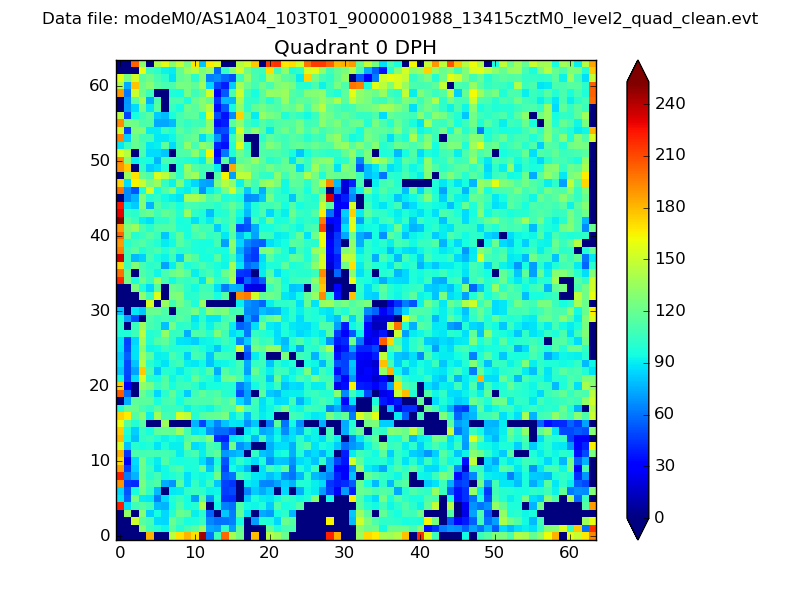 |
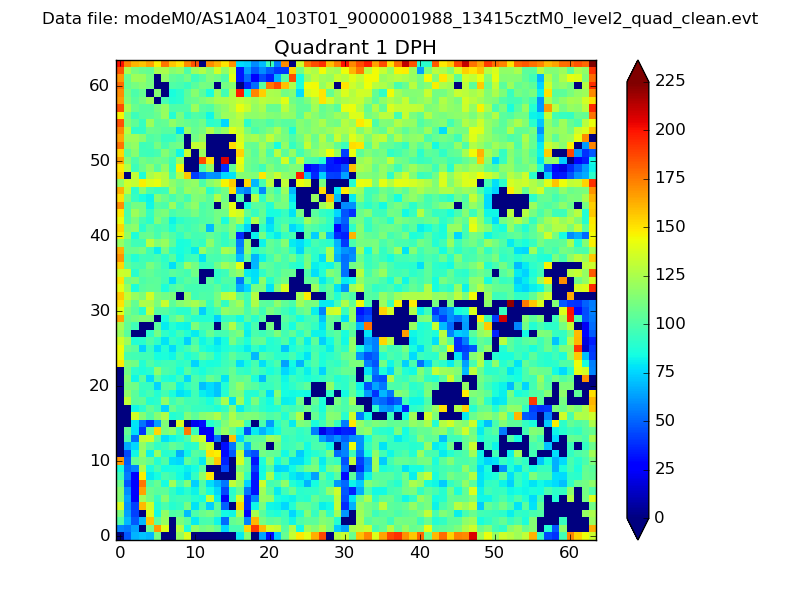 |
Quadrant B |
|---|---|---|---|
| Quadrant D | 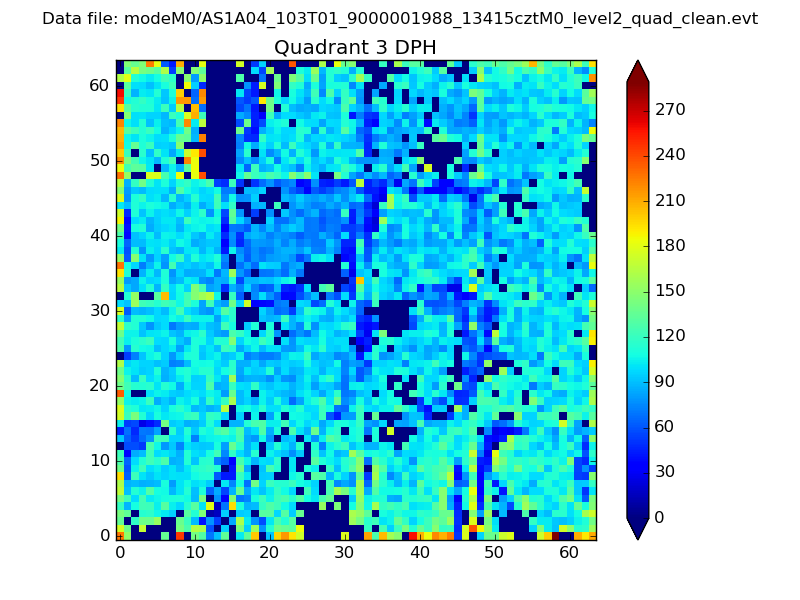 |
 |
Quadrant C |
| Plot type | Count rate plots | Images |
|---|---|---|
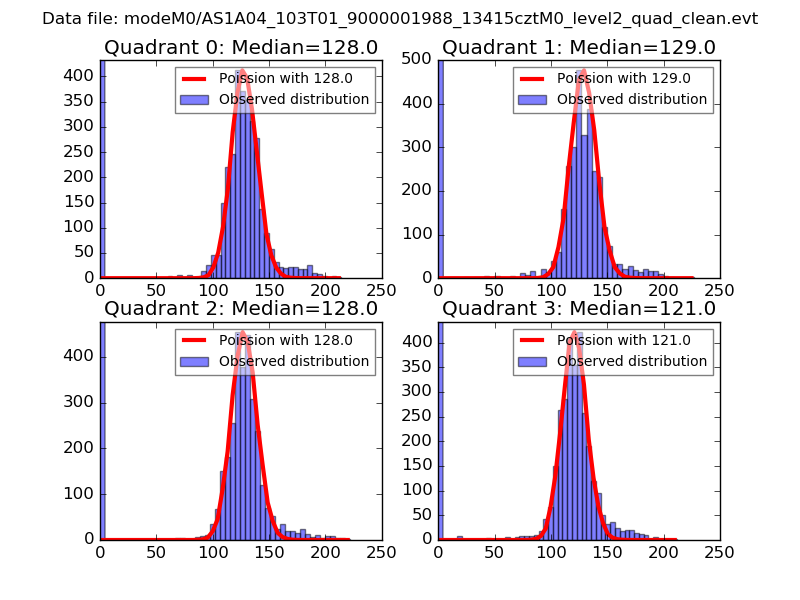
| Comparison with Poisson distribution Blue bars denote a histogram of data divided into 1 sec bins. Red curve is a Poisson curve with rate = median count rate of data. |
 |
 |
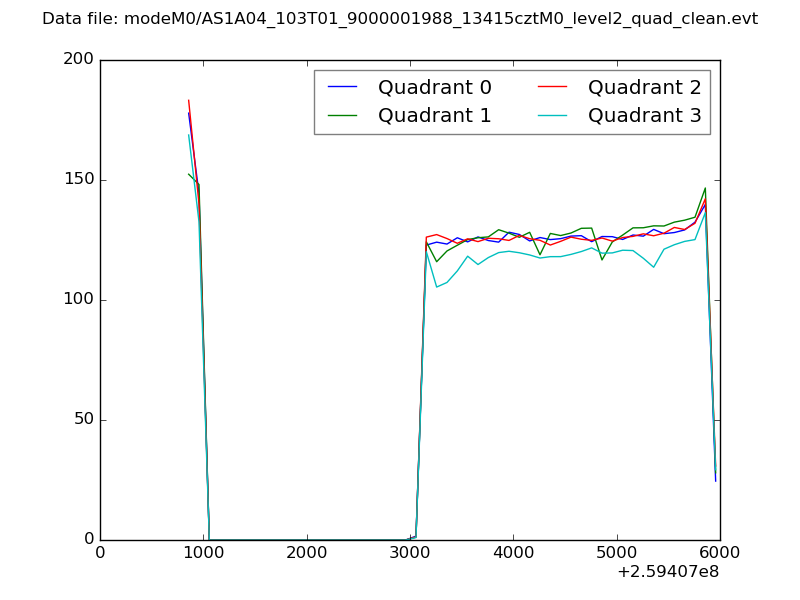
| Quadrant-wise count rates Data is divided into 100 sec bins |
 |
|
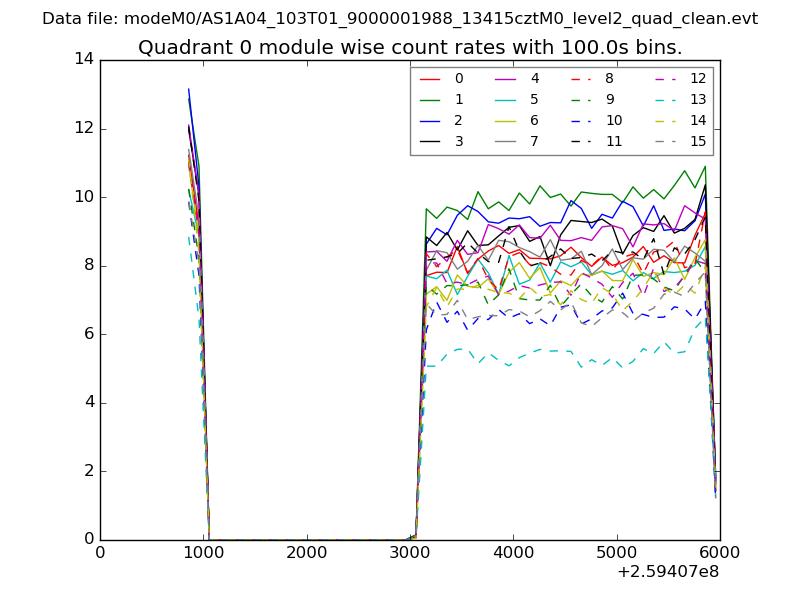
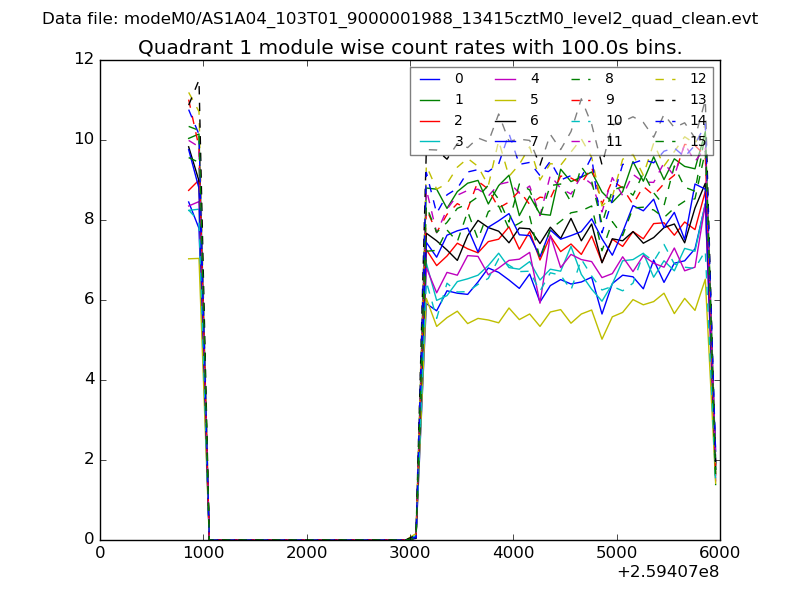
| Module-wise count rates for Quadrant A Data is divided into 100 sec bins |
 |
 |
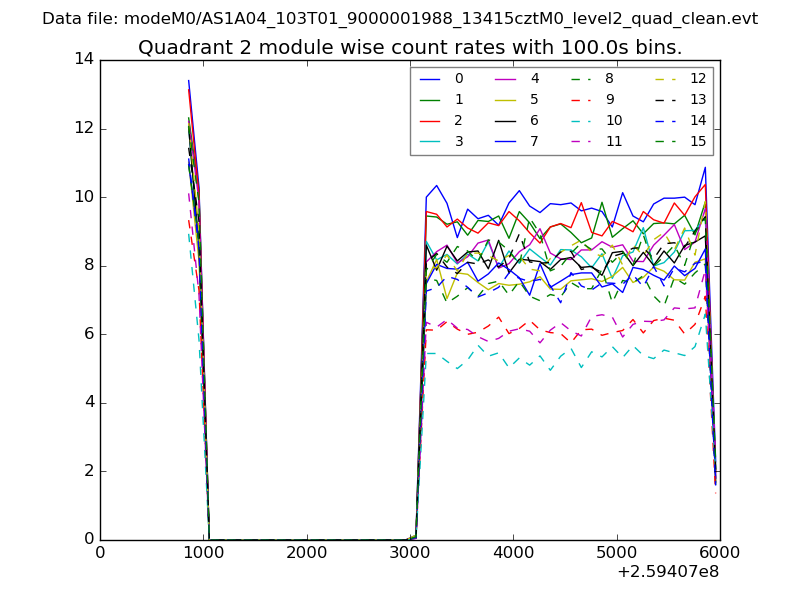
| Module-wise count rates for Quadrant B Data is divided into 100 sec bins |
 |
 |
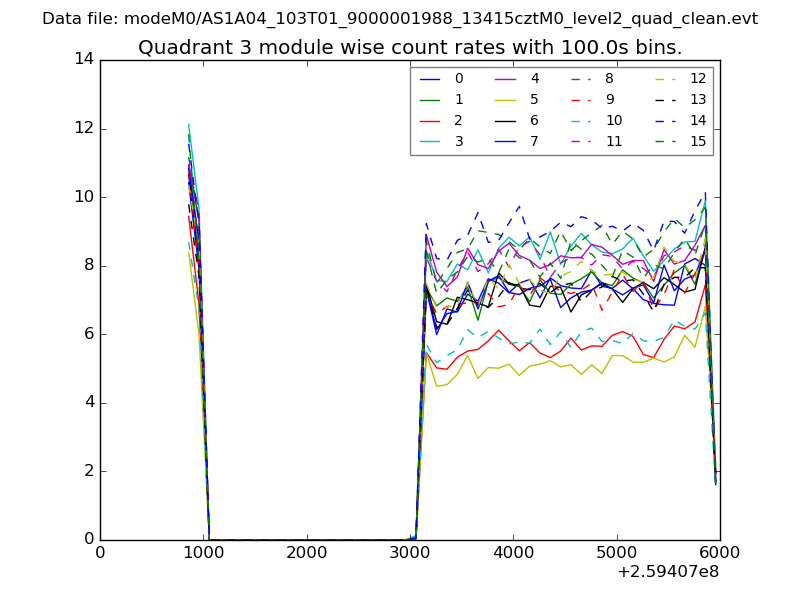
| Module-wise count rates for Quadrant C Data is divided into 100 sec bins |
 |
 |
| Module-wise count rates for Quadrant D Data is divided into 100 sec bins |
 |
 |
| Parameter | Plot |
|---|---|
| CZT HV Monitor | 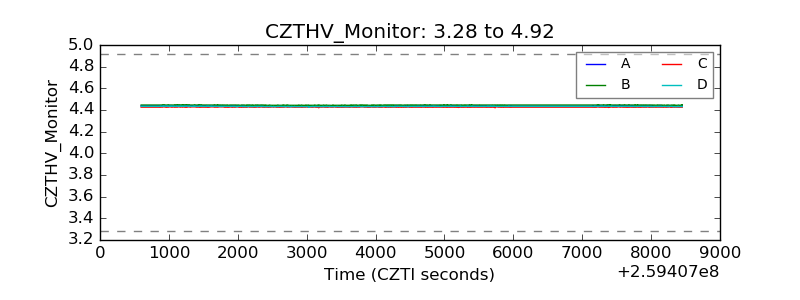 |
| D_VDD |  |
| Temperature 1 | 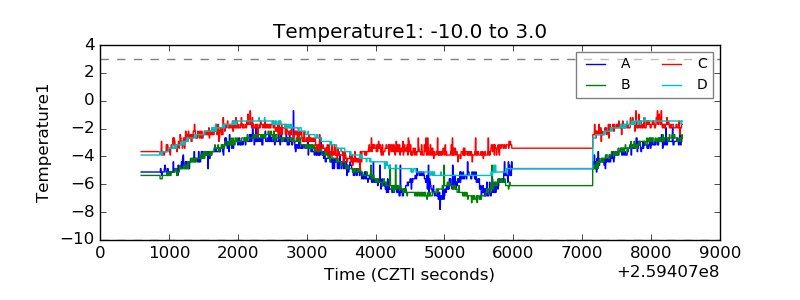 |
| Veto HV Monitor | 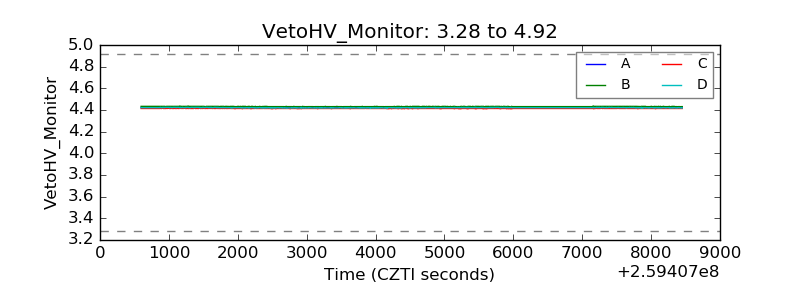 |
| Veto LLD | 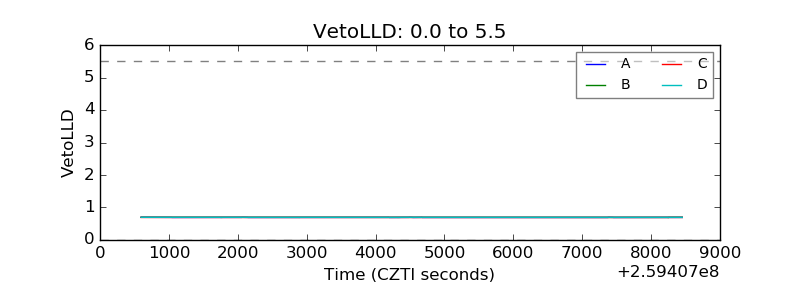 |
| Alpha Counter | 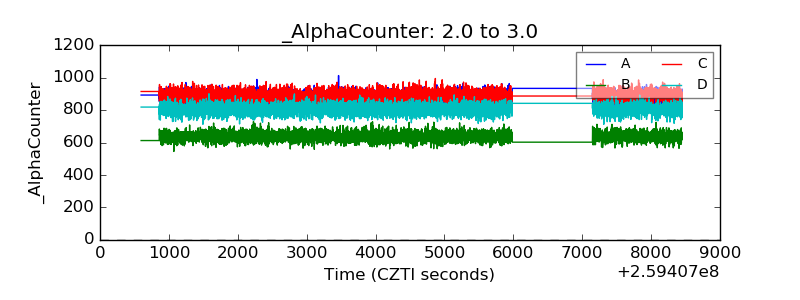 |
| _CPM_Rate | 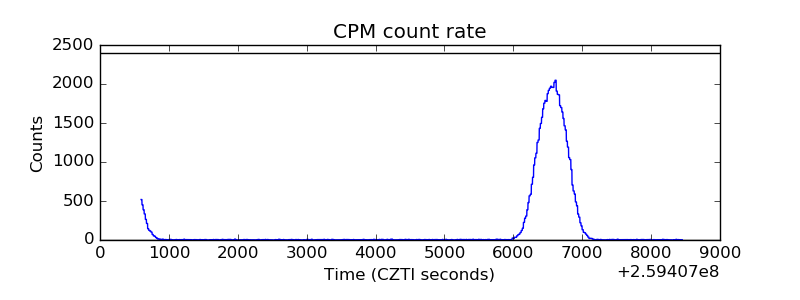 |
| CZT Counter | 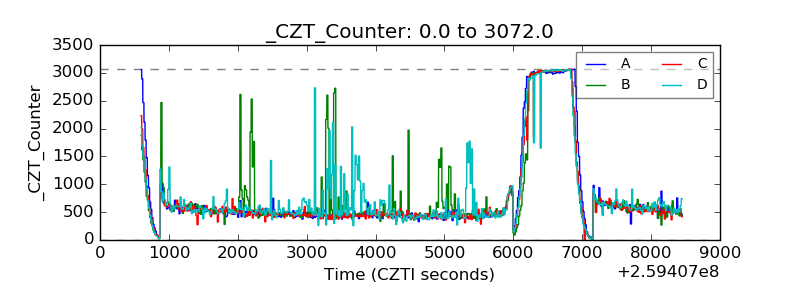 |
| +2.5 Volts monitor |  |
| +5 Volts monitor |  |
| _ROLL_ROT | 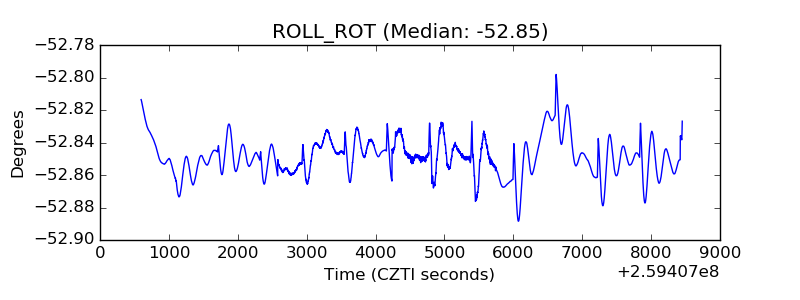 |
| _Roll_DEC | 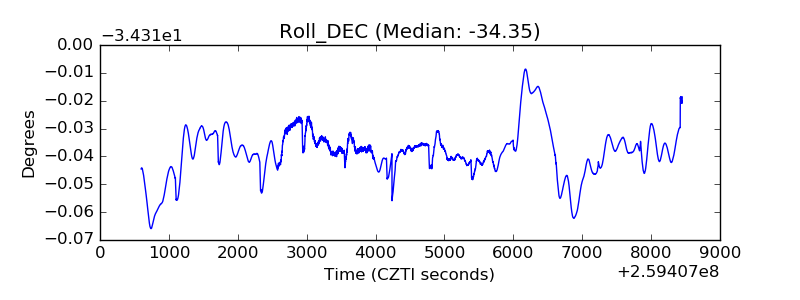 |
| _Roll_RA |  |
| Veto Counter | 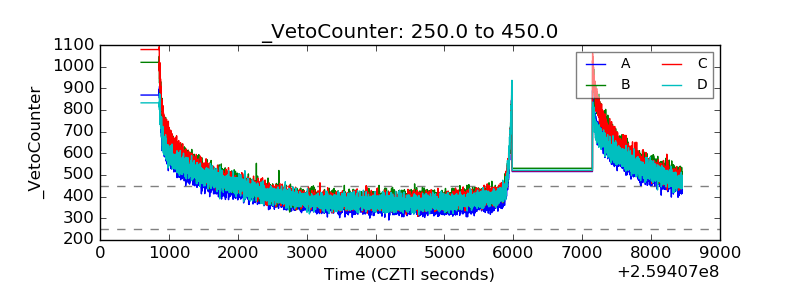 |