| Param | Original file | Final file |
|---|---|---|
| Filename | modeM0/AS1A04_103T01_9000001988_13416cztM0_level2.evt | modeM0/AS1A04_103T01_9000001988_13416cztM0_level2_quad_clean.evt |
| Size (bytes) | 490,723,200 | 70,767,360 |
| Size | 468.0 MB | 67.5 MB |
| Events in quadrant A | 3,415,158 | 431,712 |
| Events in quadrant B | 3,873,168 | 420,808 |
| Events in quadrant C | 3,373,507 | 427,649 |
| Events in quadrant D | 3,757,391 | 408,058 |
| Mode M0 | |||
|---|---|---|---|
| Quadrant | BADHDUFLAG | Total packets | Discarded packets |
| A | 0 | 14435 | 3 |
| B | 0 | 15721 | 2 |
| C | 0 | 14211 | 2 |
| D | 0 | 15592 | 2 |
| Mode SS | |||
|---|---|---|---|
| Quadrant | BADHDUFLAG | Total packets | Discarded packets |
| A | 0 | 132 | 0 |
| B | 0 | 132 | 0 |
| C | 0 | 132 | 0 |
| D | 0 | 132 | 0 |
| Mode M9 | |||
|---|---|---|---|
| Quadrant | BADHDUFLAG | Total packets | Discarded packets |
| A | 0 | 20 | 0 |
| B | 0 | 20 | 0 |
| C | 0 | 20 | 0 |
| D | 0 | 21 | 0 |
| Quadrant | Total seconds | Saturated seconds | Saturation percentage |
|---|---|---|---|
| A | 6516 | 93 | 1.427256% |
| B | 6516 | 300 | 4.604052% |
| C | 6516 | 69 | 1.058932% |
| D | 6516 | 91 | 1.396562% |
Noise dominated data is calculated using 1-second bins in cleaned event files. If a bin has >2000 counts, and if more than 50% of those come from <1% of pixels, then it is considered to be noise-dominated and hence unusable.
| Quadrant | # 1 sec bins | Bins with >0 counts | Bins with >2000 counts | High rate bins dominated by noise | Noise dominated (total time) | Noise dominated (detector-on time) | Marked lightcurve |
|---|---|---|---|---|---|---|---|
| A | 7767 | 6517 | 0 | 0 | 0.00% | 0.00% |  |
| B | 7767 | 6517 | 143 | 143 | 1.84% | 2.19% |  |
| C | 7767 | 6517 | 0 | 0 | 0.00% | 0.00% | 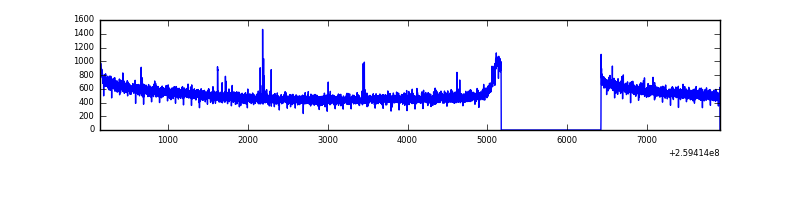 |
| D | 7767 | 6517 | 9 | 9 | 0.12% | 0.14% | 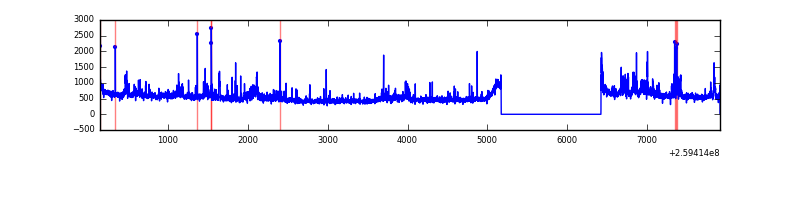 |
Top three noisy pixels from each quadrant. If the there are fewer than three noisy pixels in the level2.evt file, extra rows are filled as -1
| Pixel properties | Quadrant properties | ||||||
|---|---|---|---|---|---|---|---|
| Quadrant | DetID | PixID | Counts | Sigma | Mean | Median | Sigma |
| A | 8 | 15 | 43481 | 243.36 | 873 | 856 | 175.2 |
| A | 0 | 226 | 7865 | 40.02 | 873 | 856 | 175.2 |
| A | 1 | 162 | 7479 | 37.81 | 873 | 856 | 175.2 |
| B | 3 | 64 | 464963 | 2923.25 | 852 | 834 | 158.8 |
| B | 0 | 230 | 30318 | 185.7 | 852 | 834 | 158.8 |
| B | 4 | 142 | 27786 | 169.75 | 852 | 834 | 158.8 |
| C | 3 | 233 | 85551 | 444.72 | 839 | 844 | 190.5 |
| C | 14 | 220 | 16739 | 83.45 | 839 | 844 | 190.5 |
| C | 13 | 61 | 5961 | 26.86 | 839 | 844 | 190.5 |
| D | 8 | 195 | 349224 | 1771.18 | 833 | 811 | 196.7 |
| D | 1 | 52 | 99025 | 499.28 | 833 | 811 | 196.7 |
| D | 5 | 222 | 59428 | 297.98 | 833 | 811 | 196.7 |
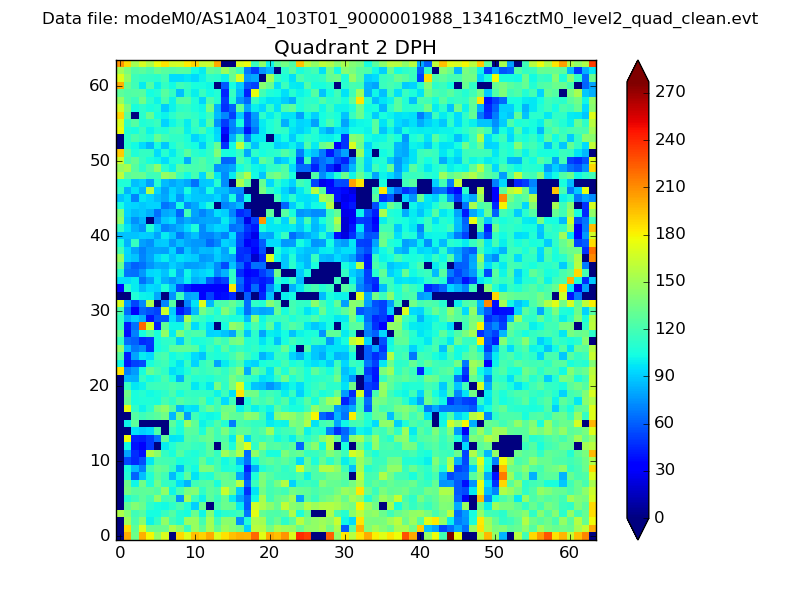
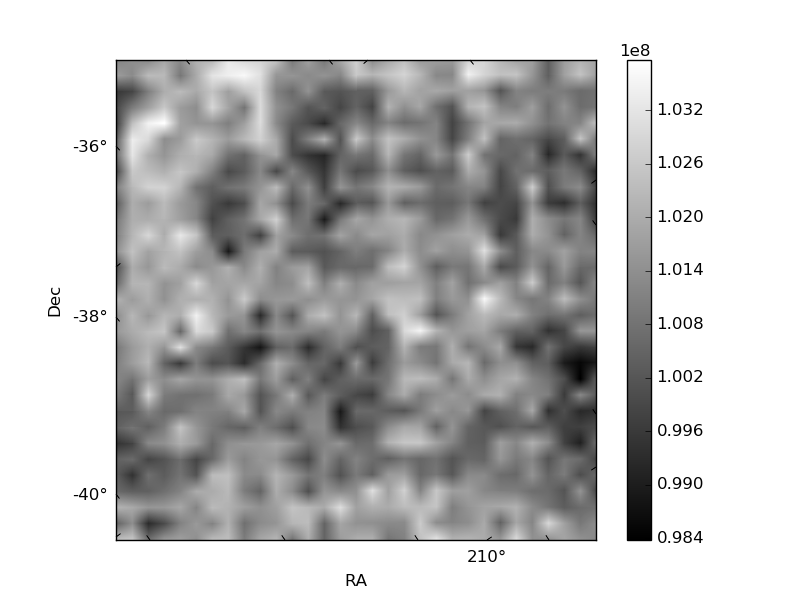
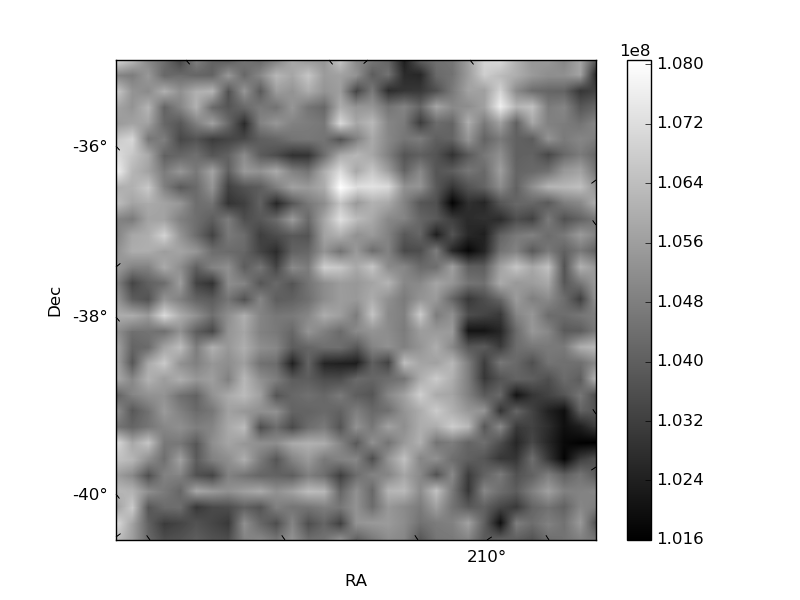
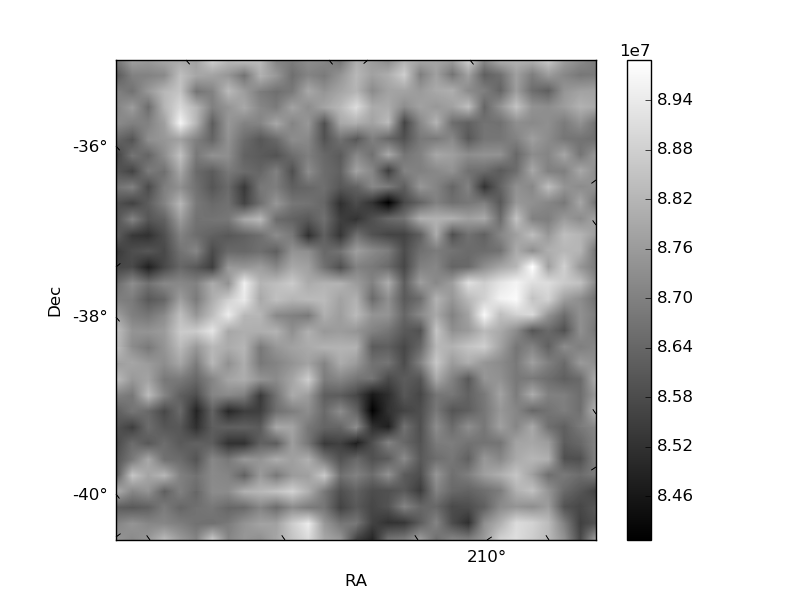
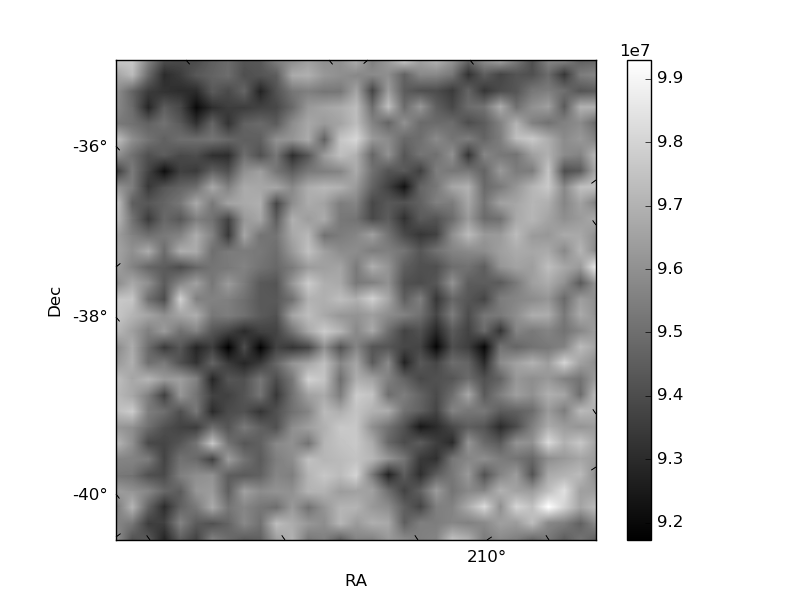
Histogram calculated using DETX and DETY for each event in the final _common_clean file
| Quadrant A | 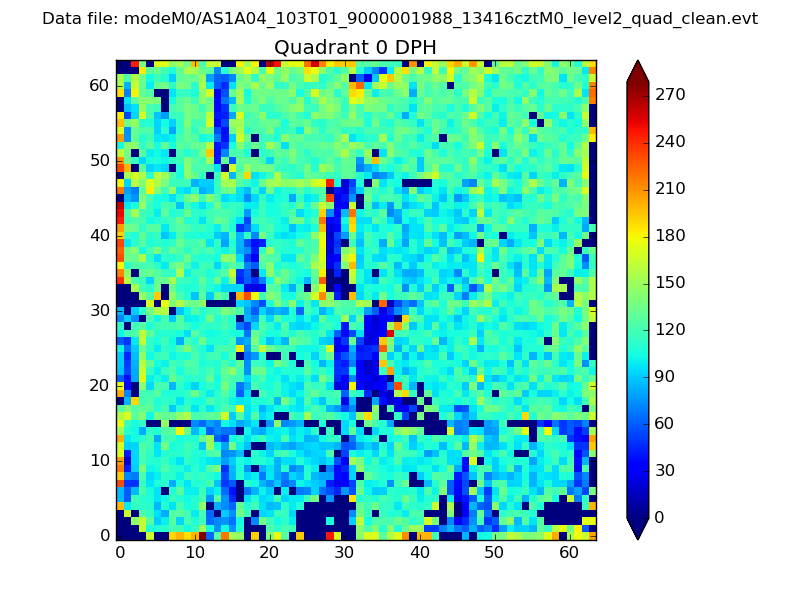 |
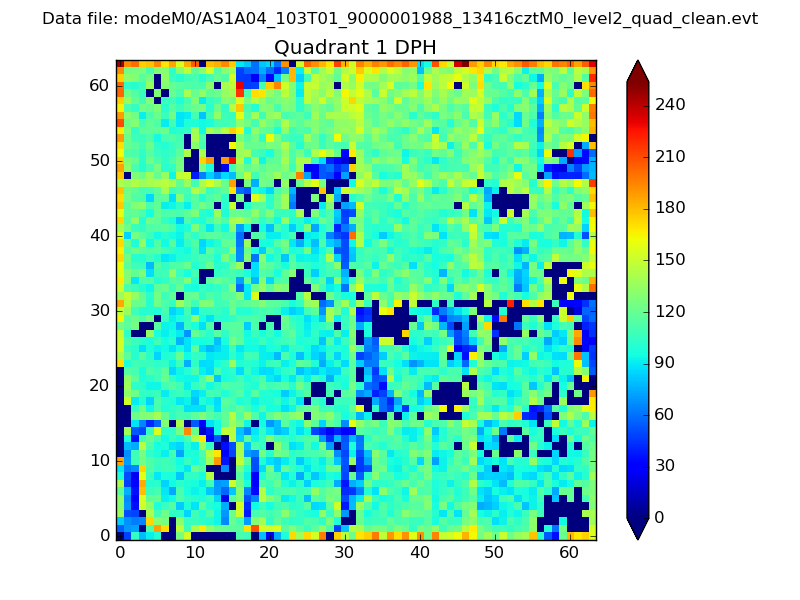 |
Quadrant B |
|---|---|---|---|
| Quadrant D | 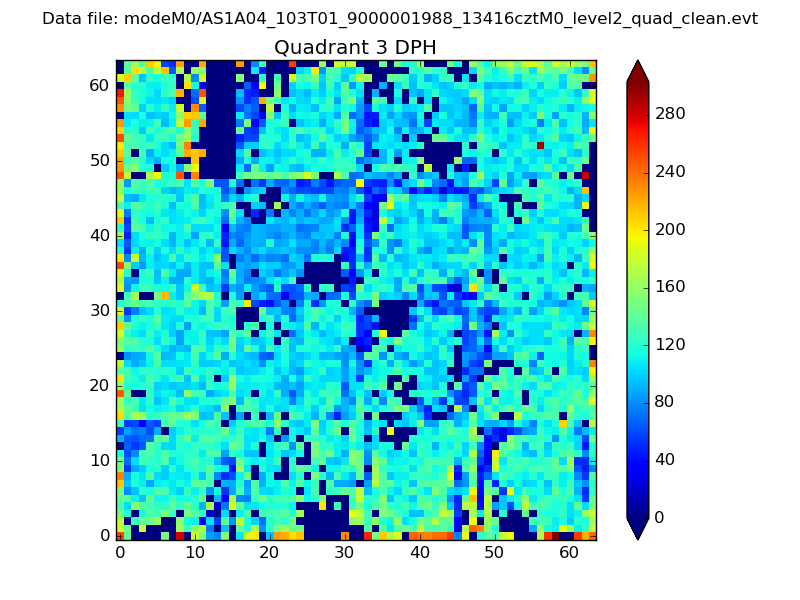 |
 |
Quadrant C |
| Plot type | Count rate plots | Images |
|---|---|---|
| Comparison with Poisson distribution Blue bars denote a histogram of data divided into 1 sec bins. Red curve is a Poisson curve with rate = median count rate of data. |
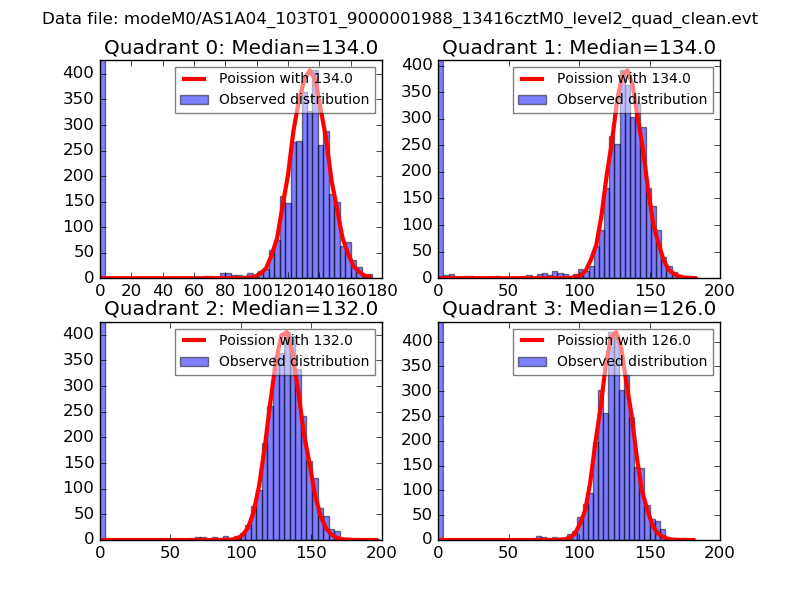 |
 |
| Quadrant-wise count rates Data is divided into 100 sec bins |
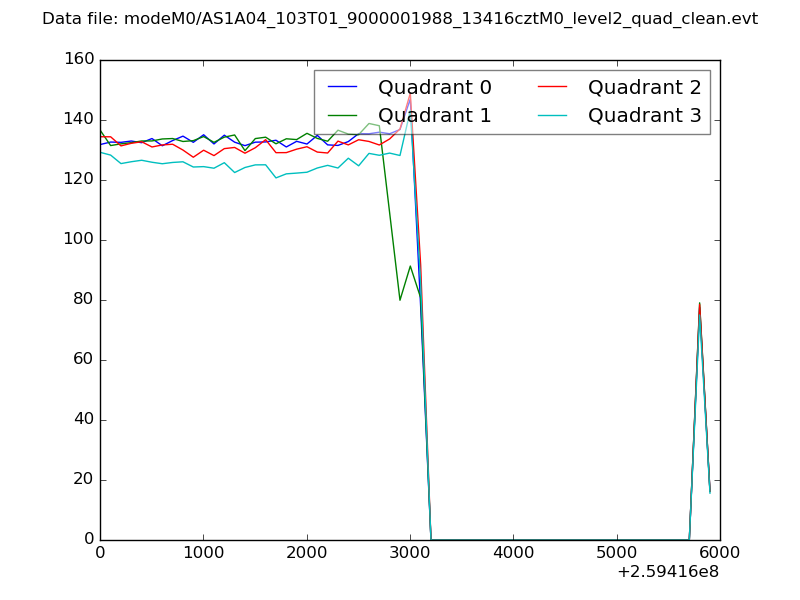 |
|
| Module-wise count rates for Quadrant A Data is divided into 100 sec bins |
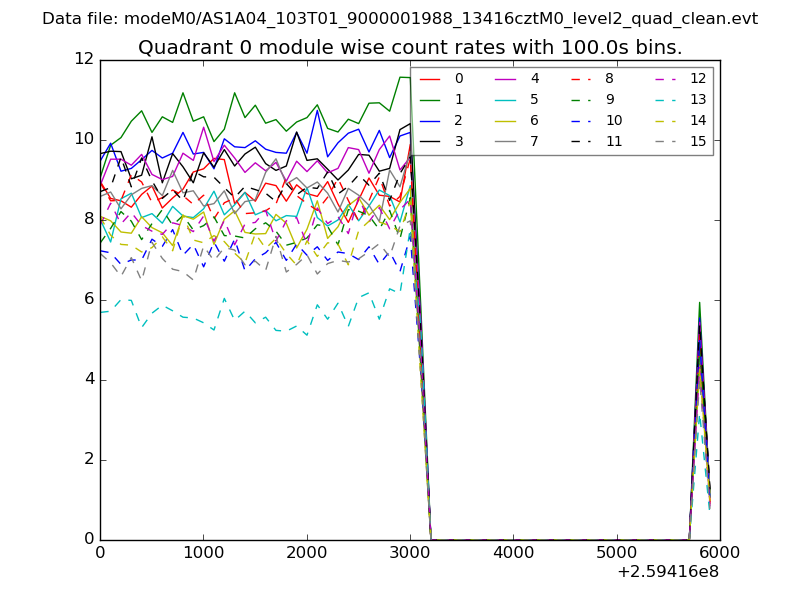 |
 |
| Module-wise count rates for Quadrant B Data is divided into 100 sec bins |
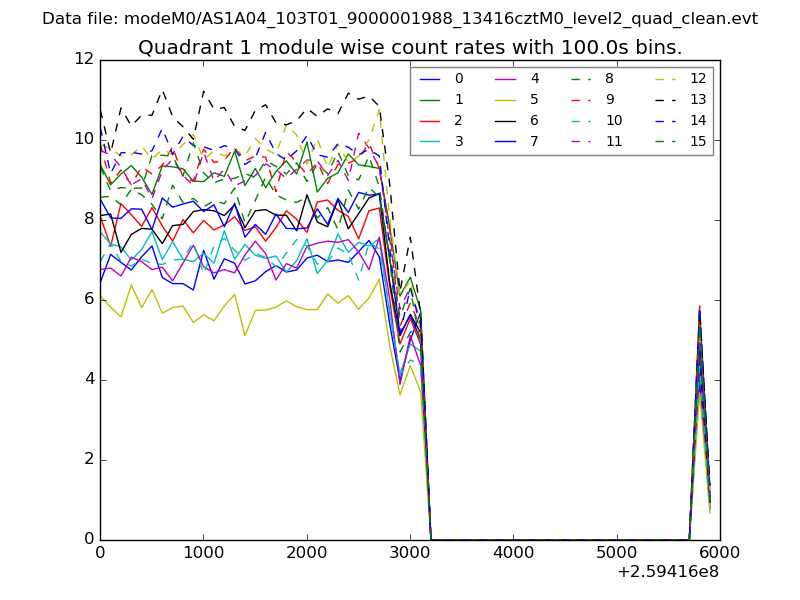 |
 |
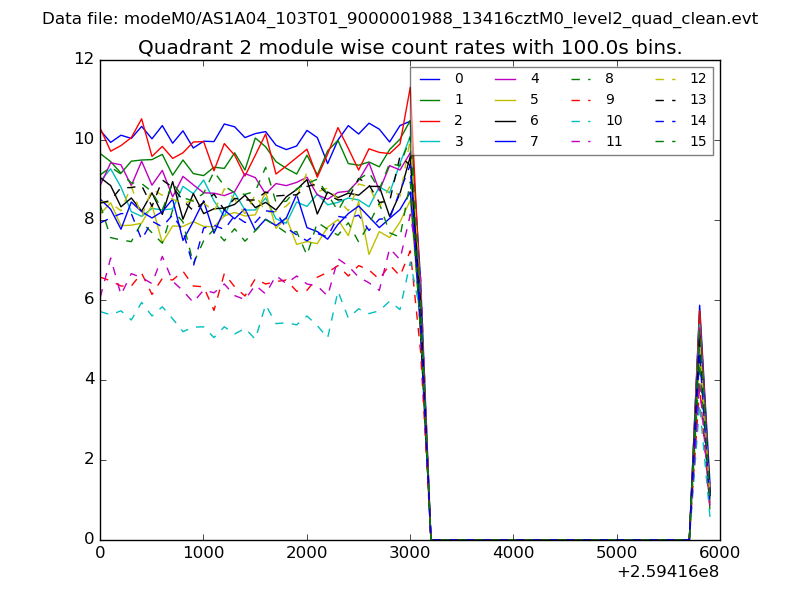
| Module-wise count rates for Quadrant C Data is divided into 100 sec bins |
 |
 |
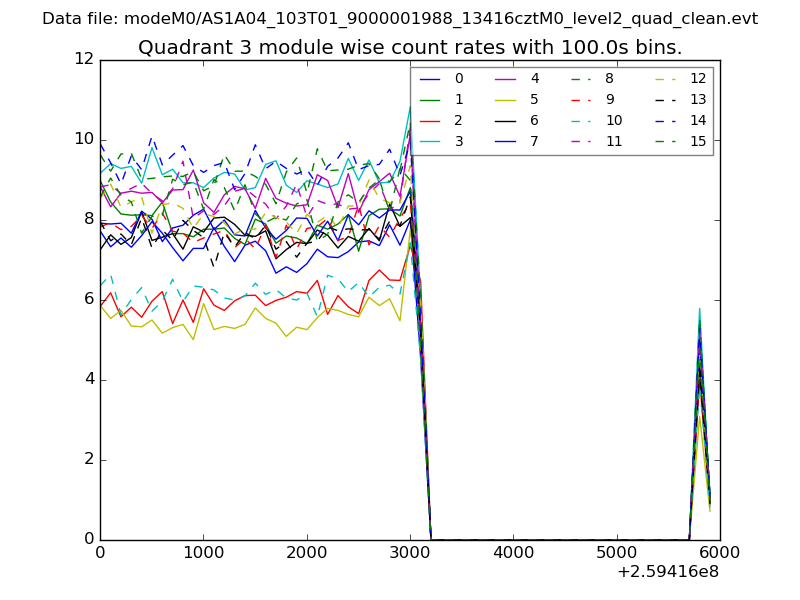
| Module-wise count rates for Quadrant D Data is divided into 100 sec bins |
 |
 |
| Parameter | Plot |
|---|---|
| CZT HV Monitor | 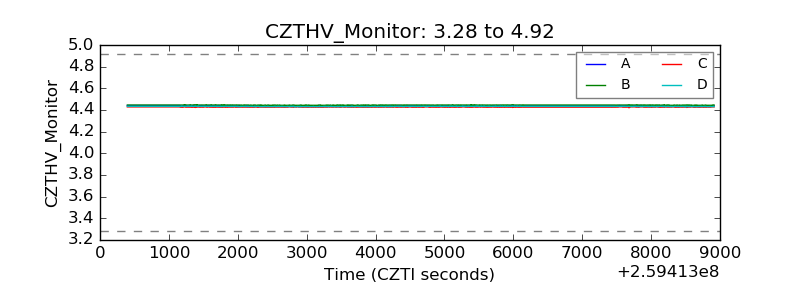 |
| D_VDD | 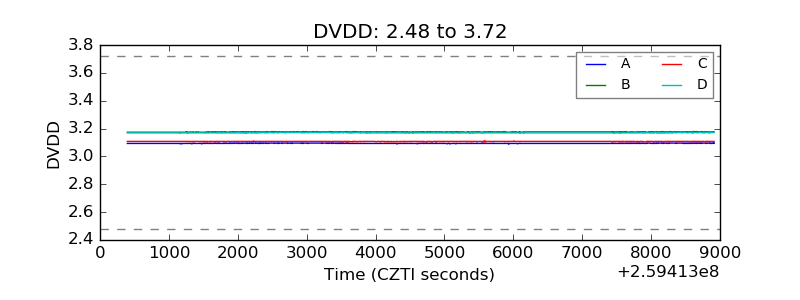 |
| Temperature 1 | 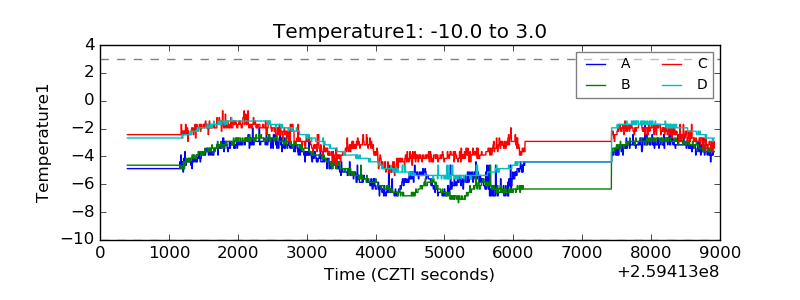 |
| Veto HV Monitor | 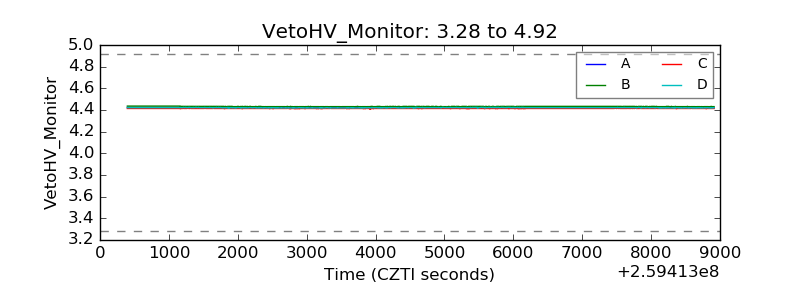 |
| Veto LLD | 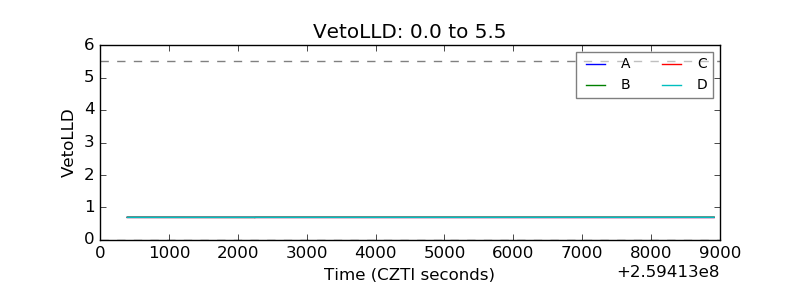 |
| Alpha Counter | 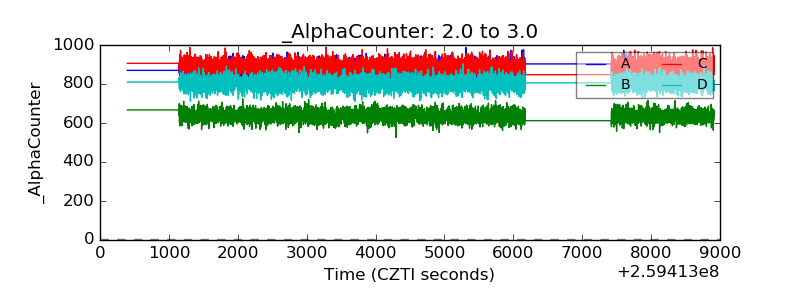 |
| _CPM_Rate | 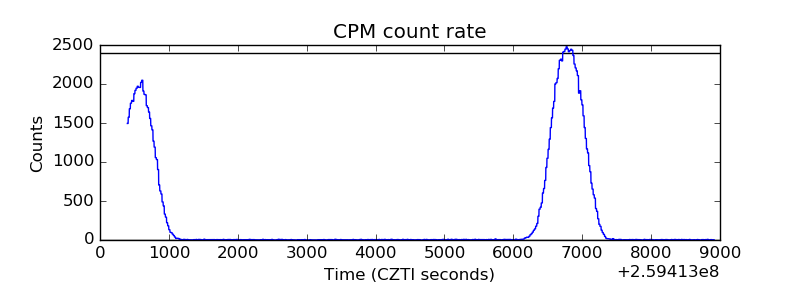 |
| CZT Counter | 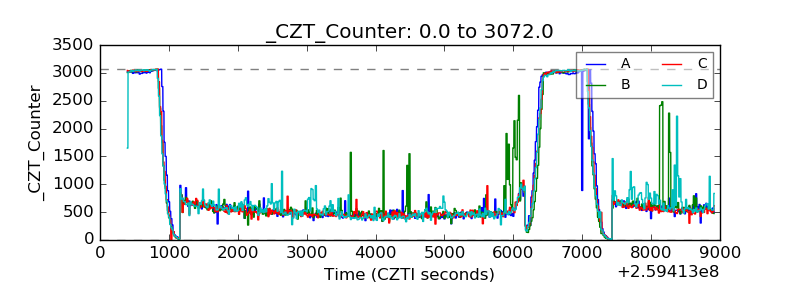 |
| +2.5 Volts monitor |  |
| +5 Volts monitor |  |
| _ROLL_ROT | 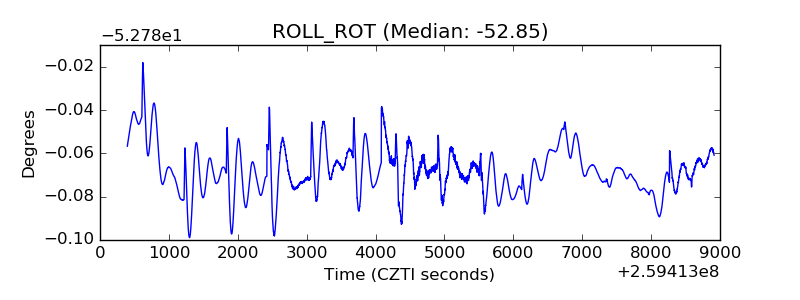 |
| _Roll_DEC | 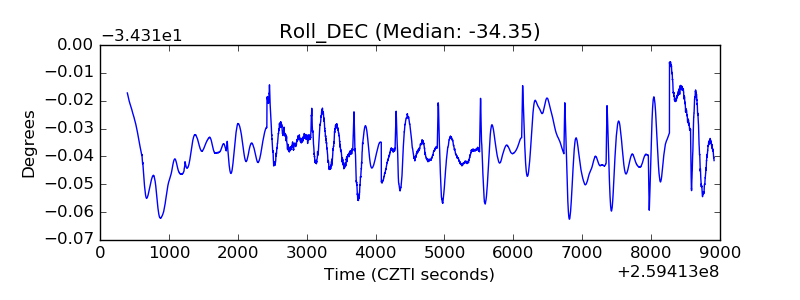 |
| _Roll_RA | 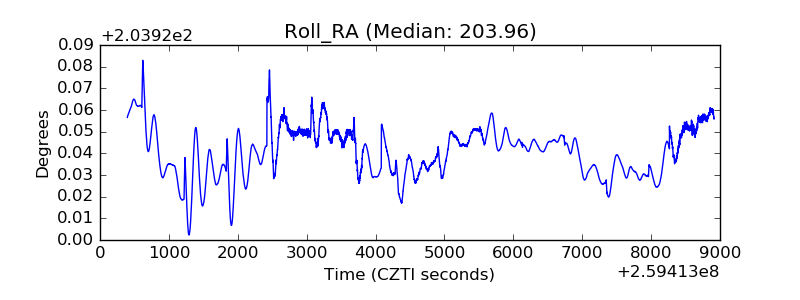 |
| Veto Counter | 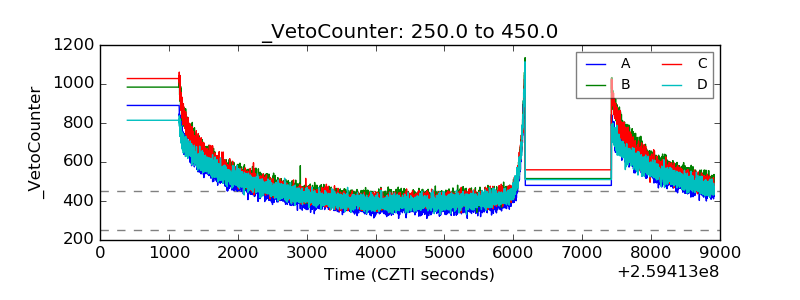 |