| Param | Original file | Final file |
|---|---|---|
| Filename | modeM0/AS1A04_103T01_9000001988_13417cztM0_level2.evt | modeM0/AS1A04_103T01_9000001988_13417cztM0_level2_quad_clean.evt |
| Size (bytes) | 505,097,280 | 86,716,800 |
| Size | 481.7 MB | 82.7 MB |
| Events in quadrant A | 3,453,462 | 554,380 |
| Events in quadrant B | 3,602,421 | 563,177 |
| Events in quadrant C | 3,312,079 | 545,252 |
| Events in quadrant D | 4,492,765 | 514,348 |
| Mode M0 | |||
|---|---|---|---|
| Quadrant | BADHDUFLAG | Total packets | Discarded packets |
| A | 0 | 14379 | 3 |
| B | 0 | 14807 | 2 |
| C | 0 | 13877 | 2 |
| D | 0 | 17698 | 2 |
| Mode SS | |||
|---|---|---|---|
| Quadrant | BADHDUFLAG | Total packets | Discarded packets |
| A | 0 | 130 | 0 |
| B | 0 | 130 | 0 |
| C | 0 | 130 | 0 |
| D | 0 | 130 | 0 |
| Mode M9 | |||
|---|---|---|---|
| Quadrant | BADHDUFLAG | Total packets | Discarded packets |
| A | 0 | 24 | 0 |
| B | 0 | 24 | 0 |
| C | 0 | 24 | 0 |
| D | 0 | 25 | 0 |
| Quadrant | Total seconds | Saturated seconds | Saturation percentage |
|---|---|---|---|
| A | 6436 | 104 | 1.615911% |
| B | 6436 | 156 | 2.423866% |
| C | 6436 | 59 | 0.916718% |
| D | 6436 | 94 | 1.460534% |
Noise dominated data is calculated using 1-second bins in cleaned event files. If a bin has >2000 counts, and if more than 50% of those come from <1% of pixels, then it is considered to be noise-dominated and hence unusable.
| Quadrant | # 1 sec bins | Bins with >0 counts | Bins with >2000 counts | High rate bins dominated by noise | Noise dominated (total time) | Noise dominated (detector-on time) | Marked lightcurve |
|---|---|---|---|---|---|---|---|
| A | 7737 | 6437 | 4 | 4 | 0.05% | 0.06% | 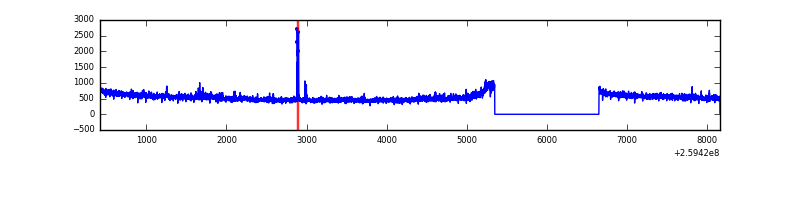 |
| B | 7737 | 6437 | 52 | 52 | 0.67% | 0.81% | 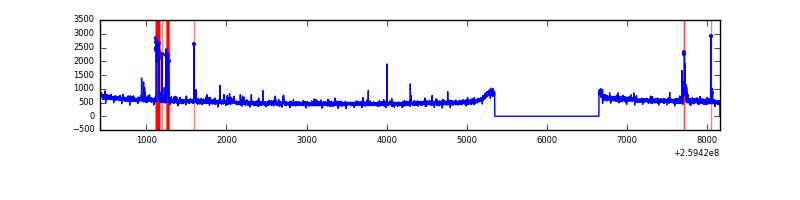 |
| C | 7737 | 6437 | 0 | 0 | 0.00% | 0.00% | 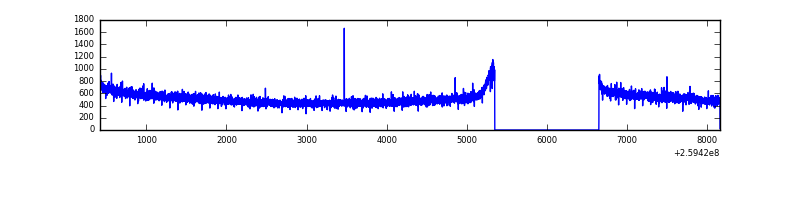 |
| D | 7737 | 6437 | 16 | 16 | 0.21% | 0.25% | 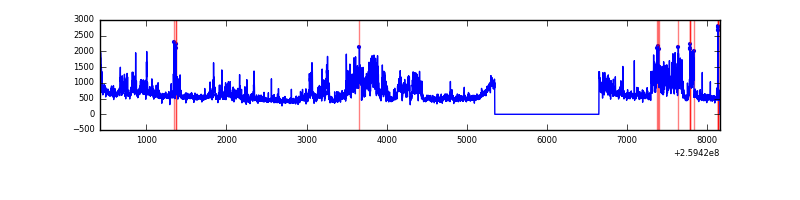 |
Top three noisy pixels from each quadrant. If the there are fewer than three noisy pixels in the level2.evt file, extra rows are filled as -1
| Pixel properties | Quadrant properties | ||||||
|---|---|---|---|---|---|---|---|
| Quadrant | DetID | PixID | Counts | Sigma | Mean | Median | Sigma |
| A | 8 | 15 | 73907 | 421.24 | 870 | 854 | 173.4 |
| A | 15 | 69 | 28356 | 158.58 | 870 | 854 | 173.4 |
| A | 0 | 226 | 7933 | 40.82 | 870 | 854 | 173.4 |
| B | 3 | 64 | 139082 | 861.04 | 865 | 847 | 160.5 |
| B | 4 | 142 | 49209 | 301.24 | 865 | 847 | 160.5 |
| B | 0 | 230 | 30590 | 185.26 | 865 | 847 | 160.5 |
| C | 3 | 233 | 67600 | 354.45 | 831 | 838 | 188.4 |
| C | 13 | 61 | 5974 | 27.27 | 831 | 838 | 188.4 |
| C | 14 | 220 | 3210 | 12.59 | 831 | 838 | 188.4 |
| D | 8 | 195 | 1061519 | 5404.34 | 823 | 800 | 196.3 |
| D | 1 | 52 | 144081 | 730.01 | 823 | 800 | 196.3 |
| D | 5 | 222 | 76508 | 385.73 | 823 | 800 | 196.3 |
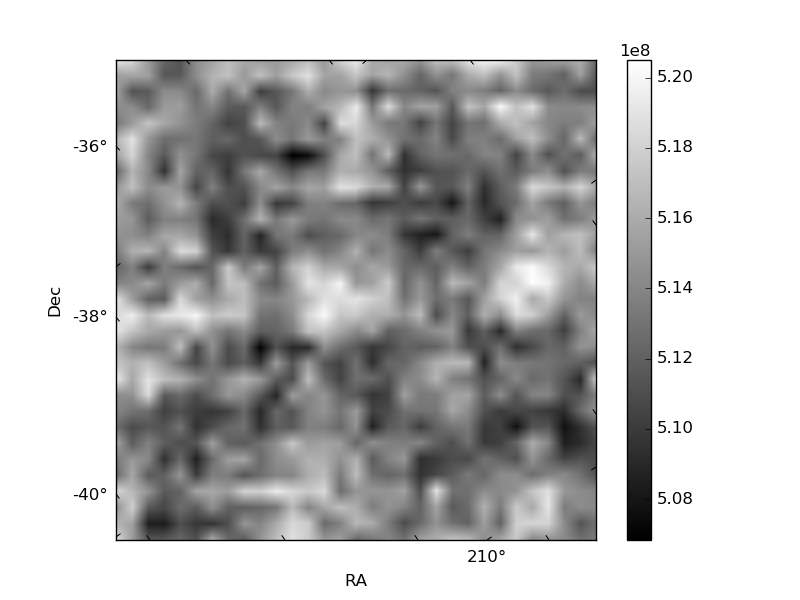
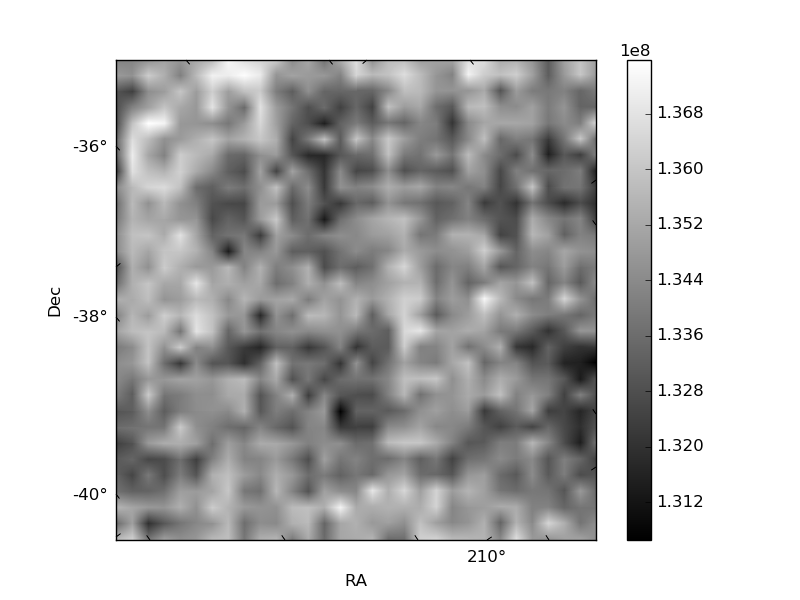
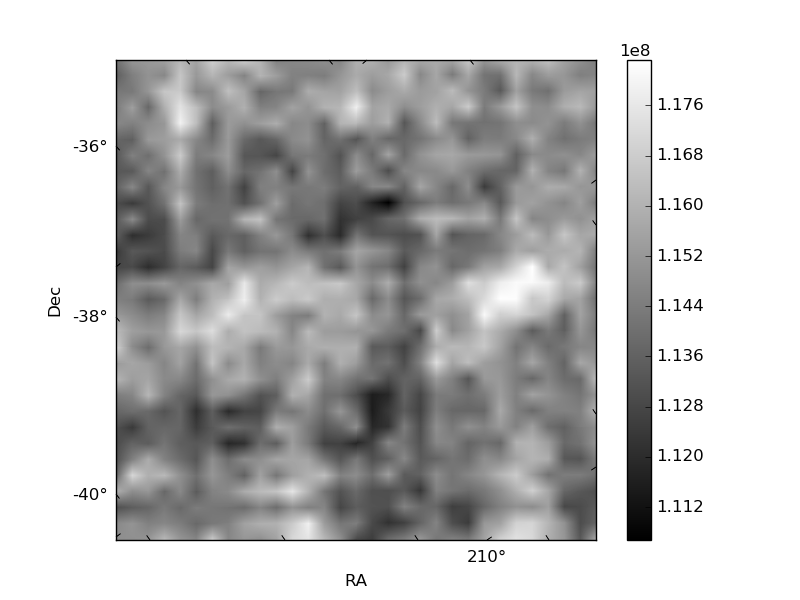
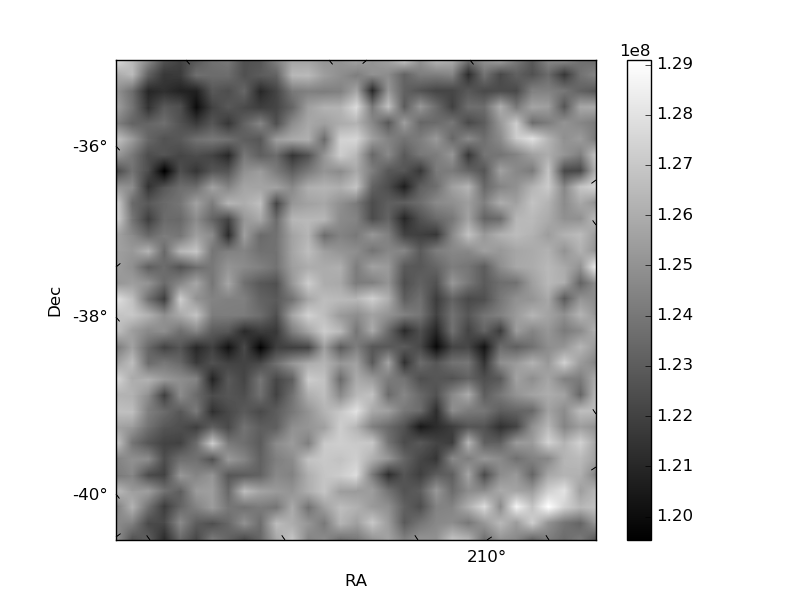
Histogram calculated using DETX and DETY for each event in the final _common_clean file
| Quadrant A | 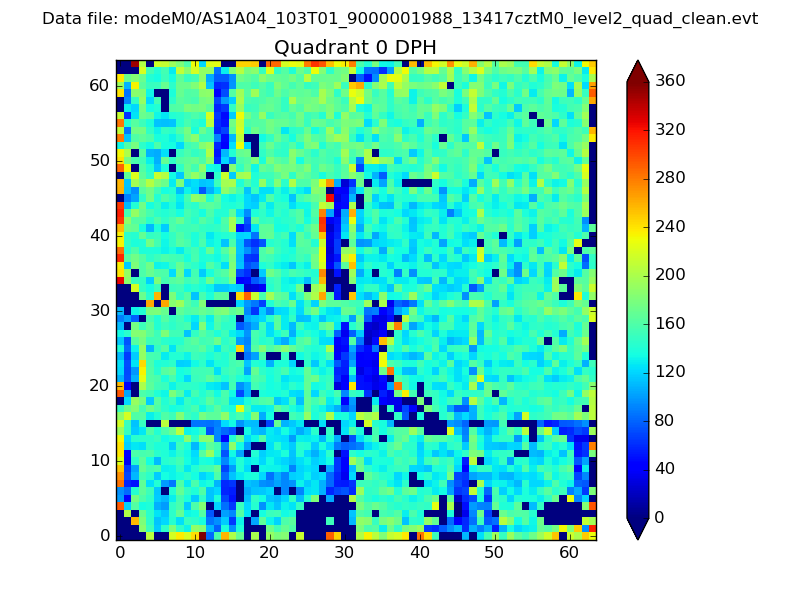 |
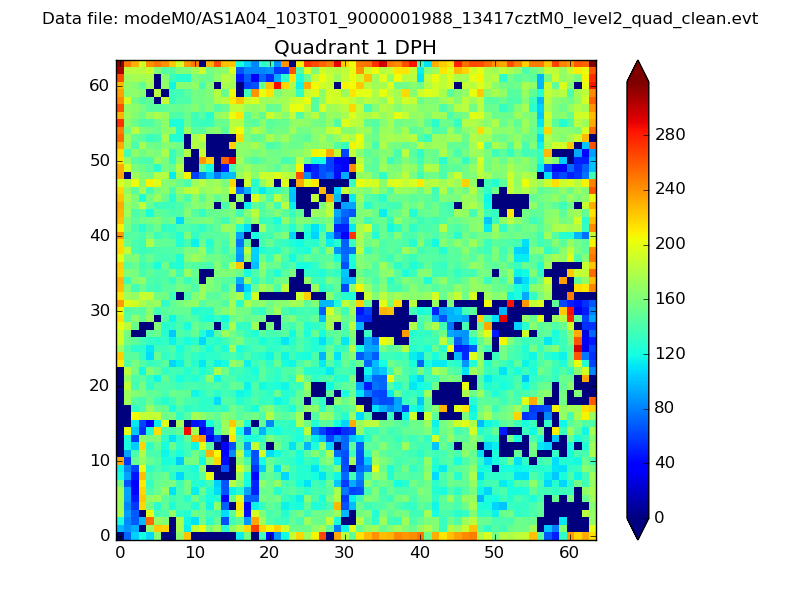 |
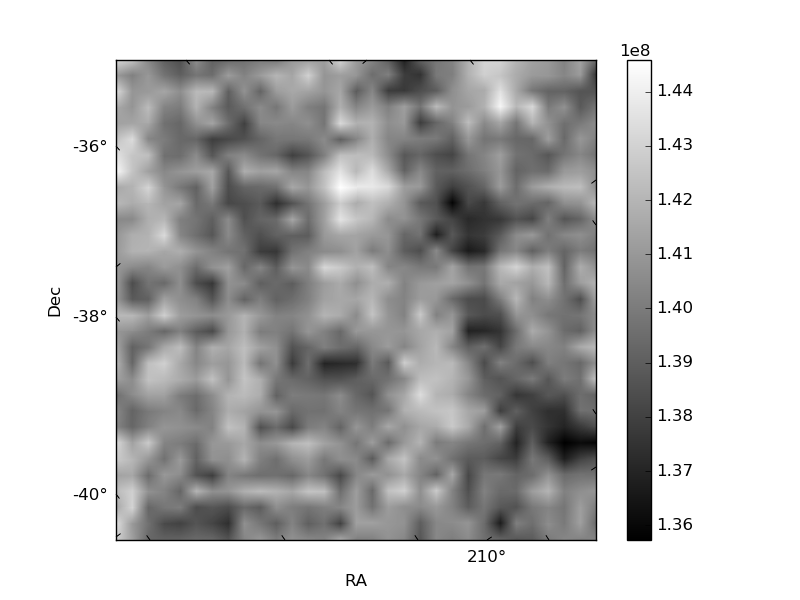
Quadrant B |
|---|---|---|---|
| Quadrant D | 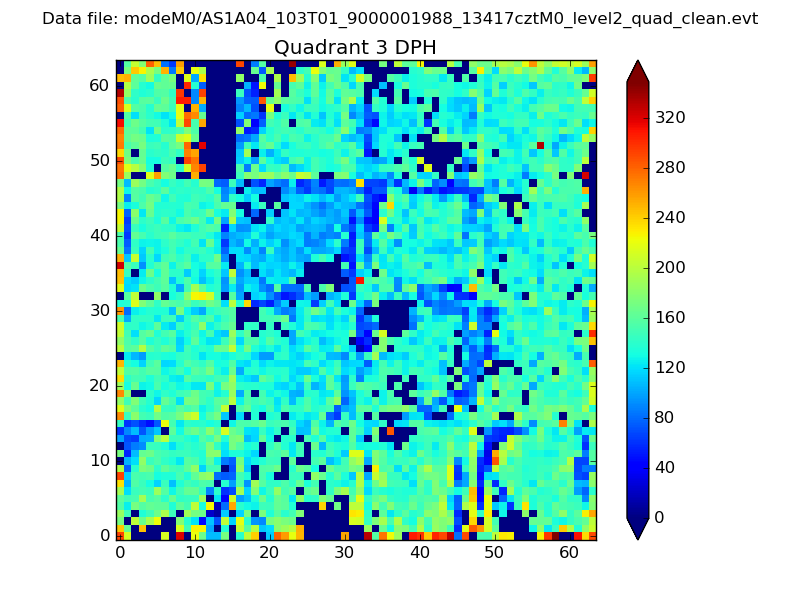 |
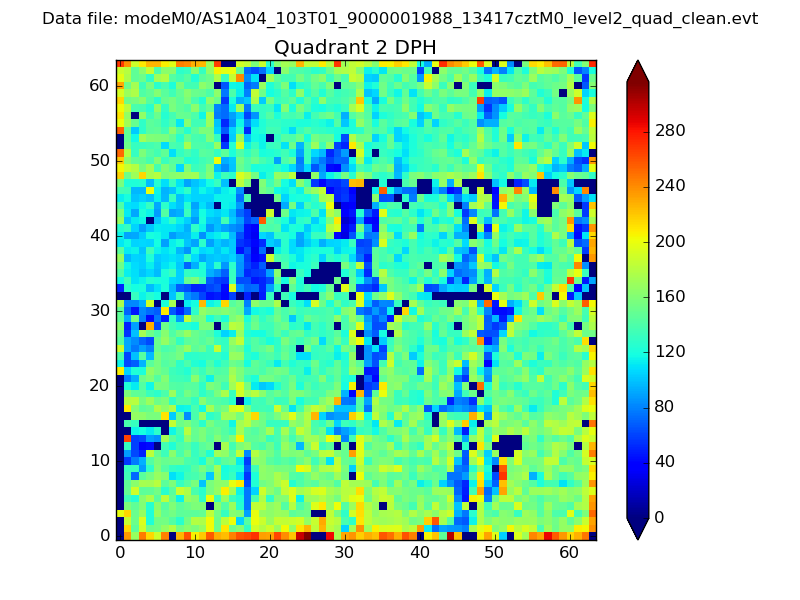 |
Quadrant C |
| Plot type | Count rate plots | Images |
|---|---|---|
| Comparison with Poisson distribution Blue bars denote a histogram of data divided into 1 sec bins. Red curve is a Poisson curve with rate = median count rate of data. |
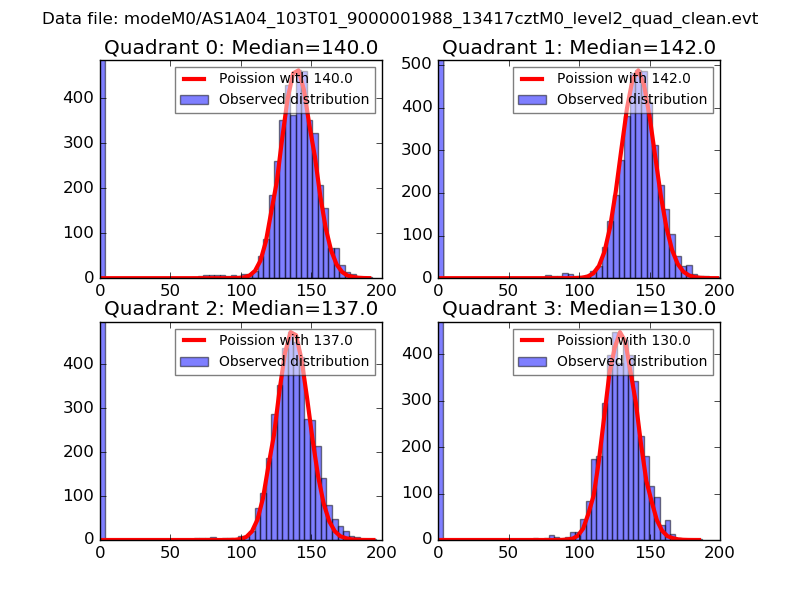 |
 |
| Quadrant-wise count rates Data is divided into 100 sec bins |
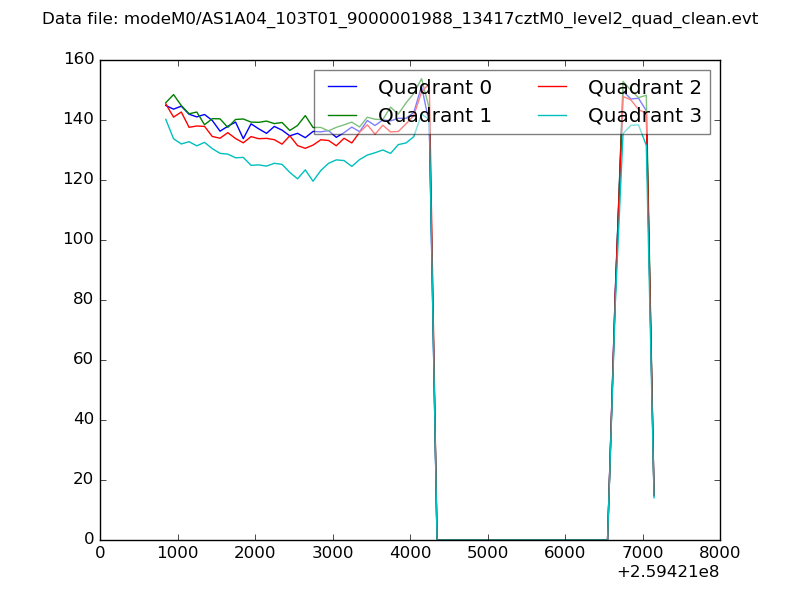 |
|
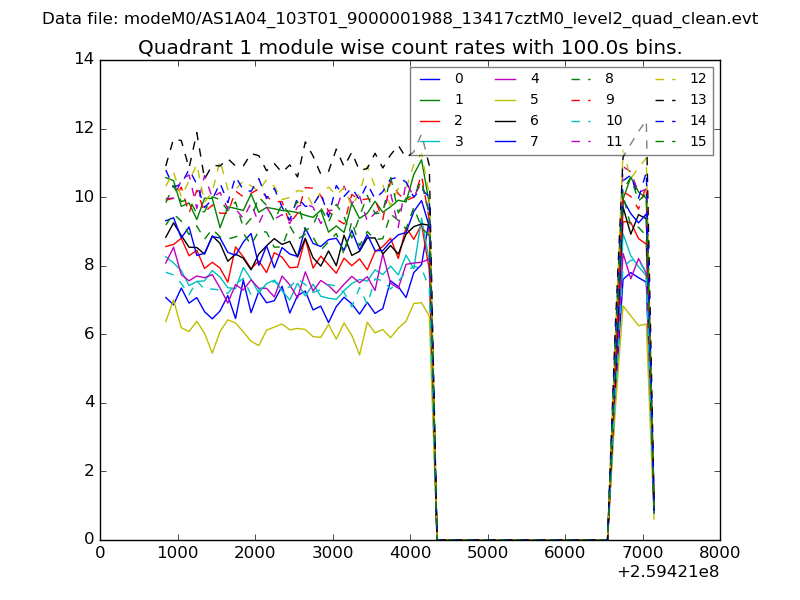
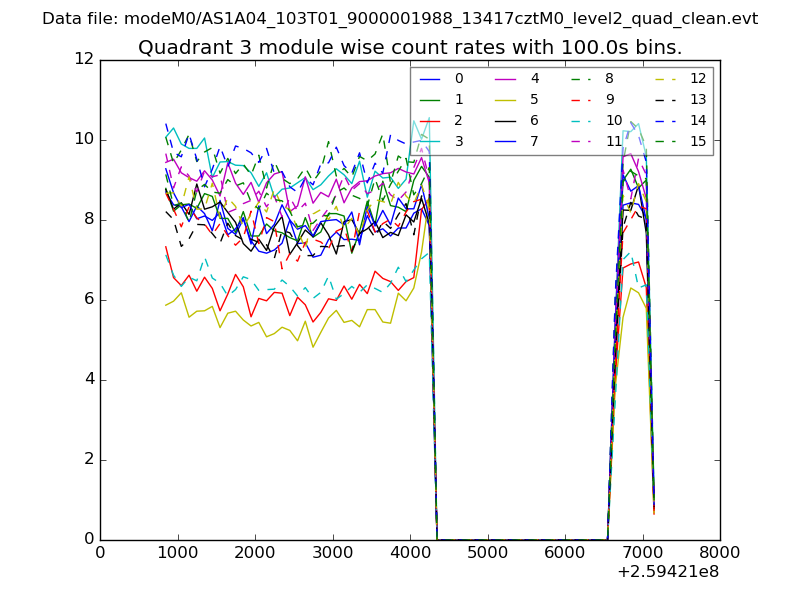
| Module-wise count rates for Quadrant A Data is divided into 100 sec bins |
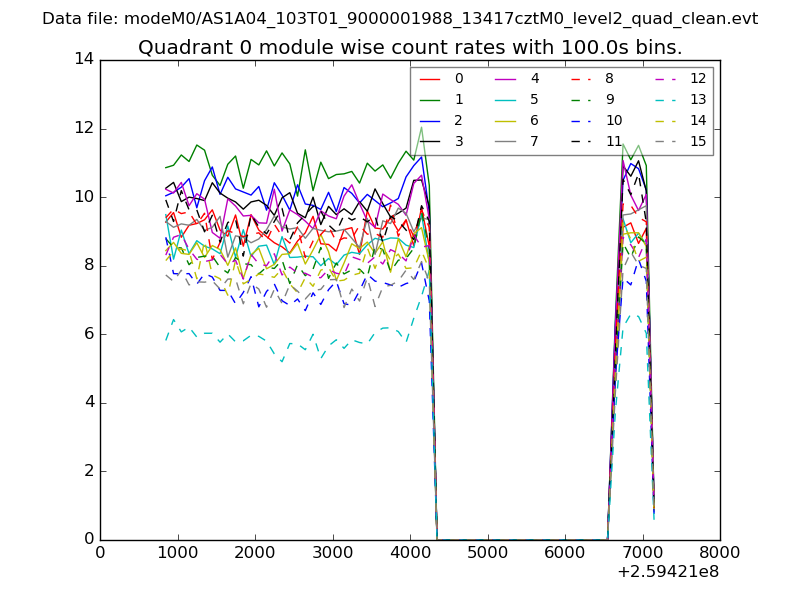 |
 |
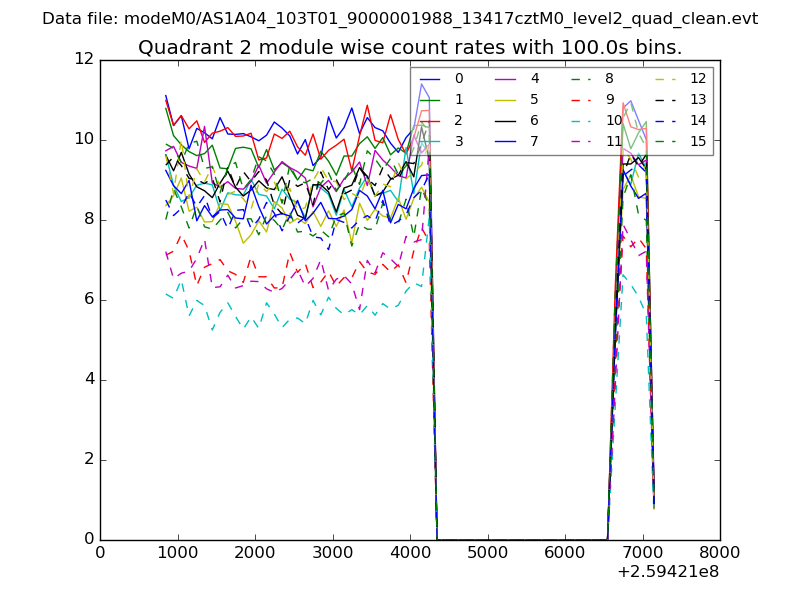
| Module-wise count rates for Quadrant B Data is divided into 100 sec bins |
 |
 |
| Module-wise count rates for Quadrant C Data is divided into 100 sec bins |
 |
 |
| Module-wise count rates for Quadrant D Data is divided into 100 sec bins |
 |
 |
| Parameter | Plot |
|---|---|
| CZT HV Monitor | 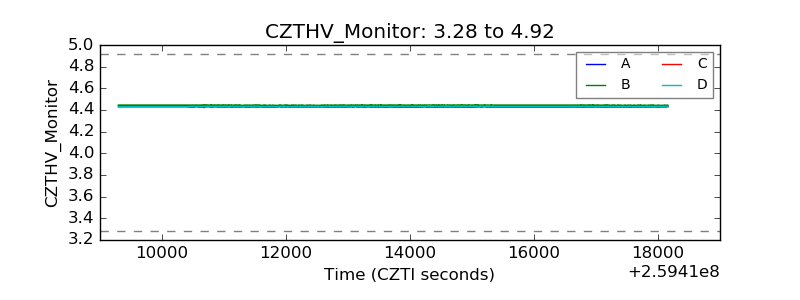 |
| D_VDD | 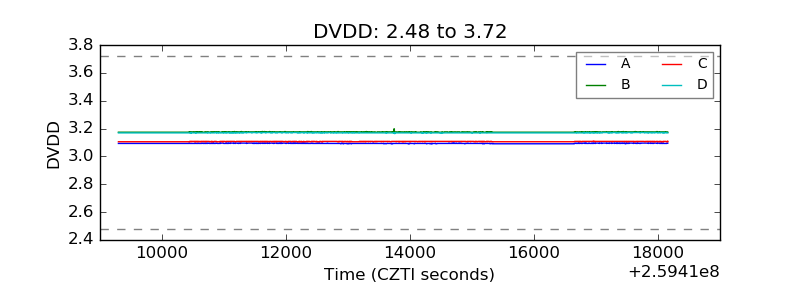 |
| Temperature 1 | 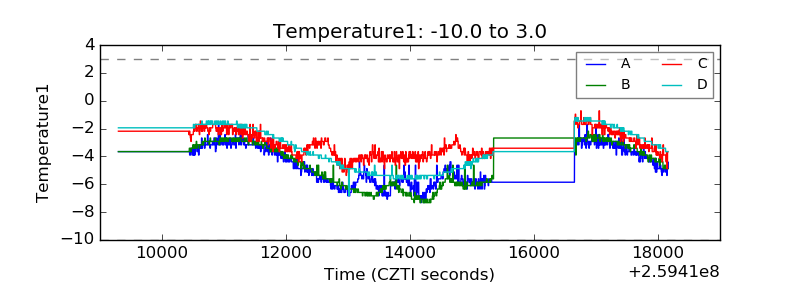 |
| Veto HV Monitor | 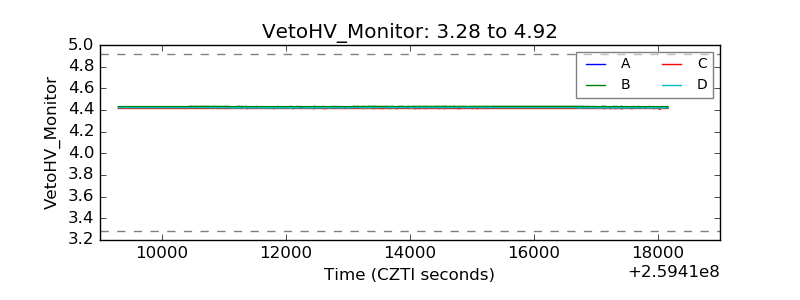 |
| Veto LLD | 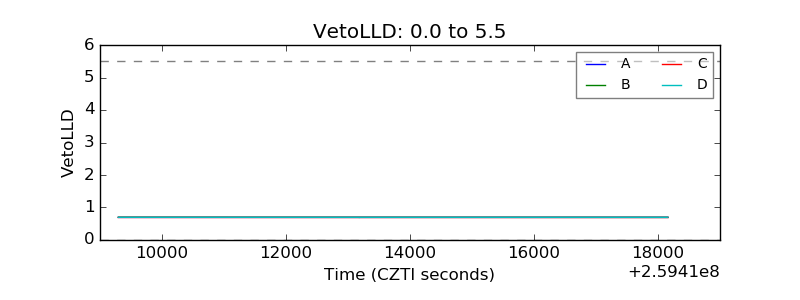 |
| Alpha Counter | 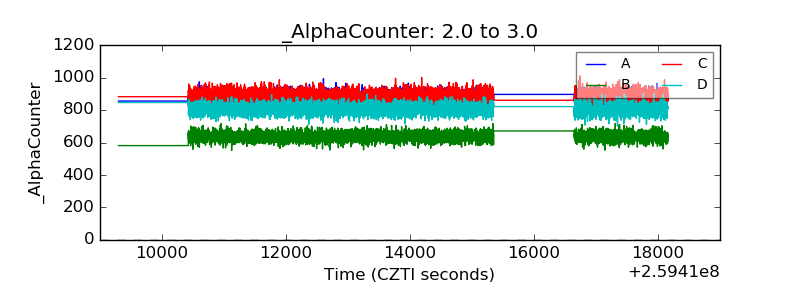 |
| _CPM_Rate | 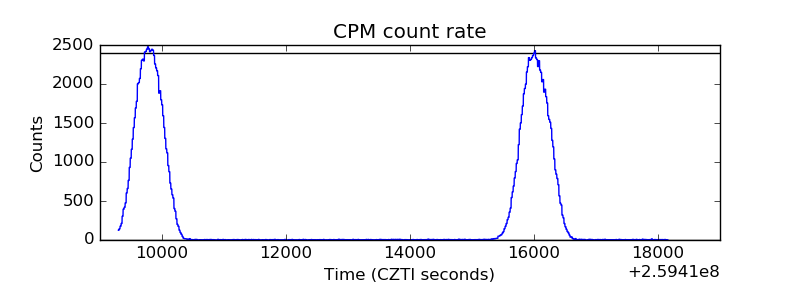 |
| CZT Counter | 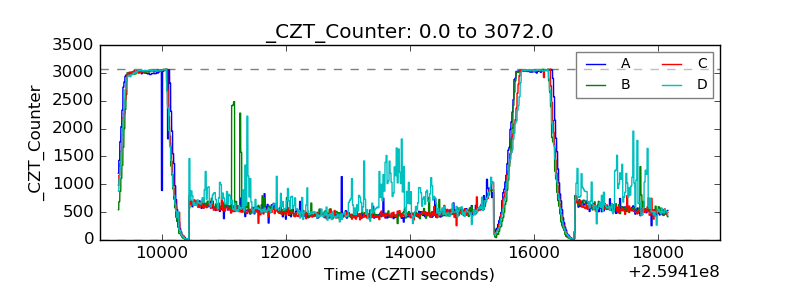 |
| +2.5 Volts monitor |  |
| +5 Volts monitor |  |
| _ROLL_ROT | 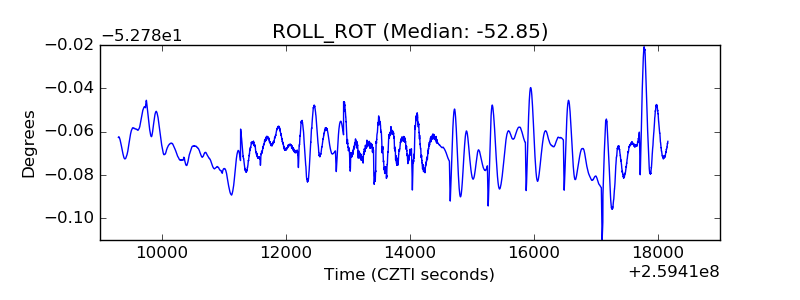 |
| _Roll_DEC | 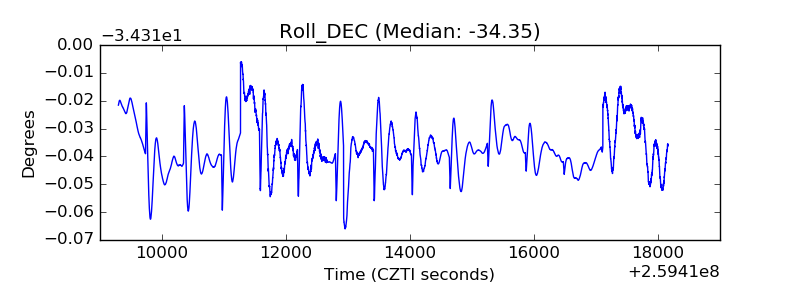 |
| _Roll_RA | 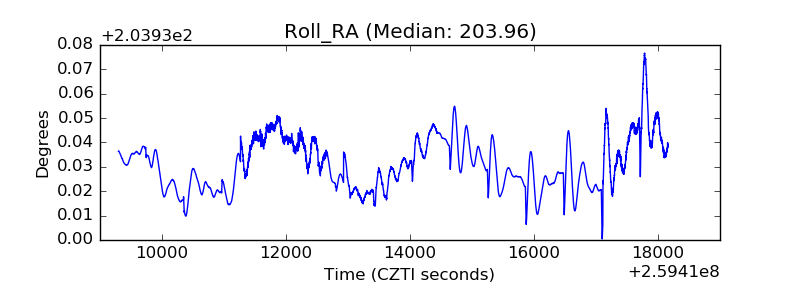 |
| Veto Counter | 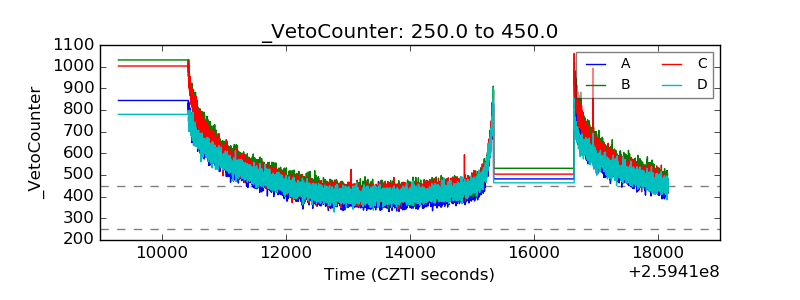 |