| Param | Original file | Final file |
|---|---|---|
| Filename | modeM0/AS1A04_103T01_9000001988_13418cztM0_level2.evt | modeM0/AS1A04_103T01_9000001988_13418cztM0_level2_quad_clean.evt |
| Size (bytes) | 510,485,760 | 99,152,640 |
| Size | 486.8 MB | 94.6 MB |
| Events in quadrant A | 3,414,583 | 647,456 |
| Events in quadrant B | 3,509,948 | 664,300 |
| Events in quadrant C | 3,372,613 | 636,497 |
| Events in quadrant D | 4,721,933 | 601,327 |
| Mode M0 | |||
|---|---|---|---|
| Quadrant | BADHDUFLAG | Total packets | Discarded packets |
| A | 0 | 14236 | 3 |
| B | 0 | 14516 | 2 |
| C | 0 | 14149 | 2 |
| D | 0 | 18408 | 2 |
| Mode SS | |||
|---|---|---|---|
| Quadrant | BADHDUFLAG | Total packets | Discarded packets |
| A | 0 | 132 | 0 |
| B | 0 | 132 | 0 |
| C | 0 | 132 | 0 |
| D | 0 | 132 | 0 |
| Mode M9 | |||
|---|---|---|---|
| Quadrant | BADHDUFLAG | Total packets | Discarded packets |
| A | 0 | 27 | 0 |
| B | 0 | 27 | 0 |
| C | 0 | 27 | 0 |
| D | 0 | 27 | 0 |
| Quadrant | Total seconds | Saturated seconds | Saturation percentage |
|---|---|---|---|
| A | 6505 | 167 | 2.567256% |
| B | 6505 | 184 | 2.828593% |
| C | 6505 | 105 | 1.614143% |
| D | 6505 | 312 | 4.796311% |
Noise dominated data is calculated using 1-second bins in cleaned event files. If a bin has >2000 counts, and if more than 50% of those come from <1% of pixels, then it is considered to be noise-dominated and hence unusable.
| Quadrant | # 1 sec bins | Bins with >0 counts | Bins with >2000 counts | High rate bins dominated by noise | Noise dominated (total time) | Noise dominated (detector-on time) | Marked lightcurve |
|---|---|---|---|---|---|---|---|
| A | 9116 | 6506 | 3 | 3 | 0.03% | 0.05% | 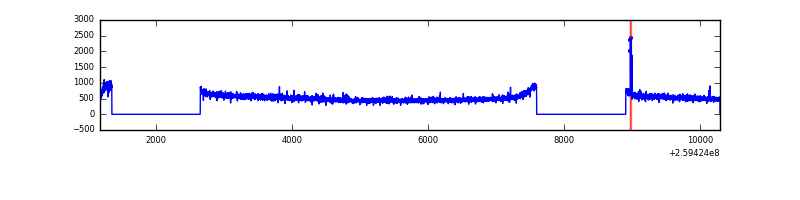 |
| B | 9116 | 6506 | 6 | 6 | 0.07% | 0.09% | 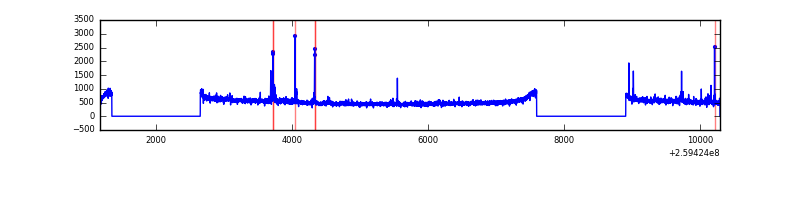 |
| C | 9116 | 6506 | 1 | 1 | 0.01% | 0.02% | 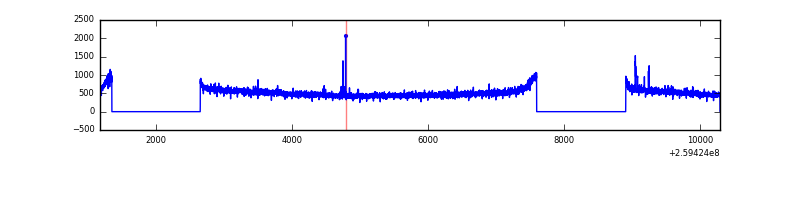 |
| D | 9116 | 6506 | 147 | 147 | 1.61% | 2.26% | 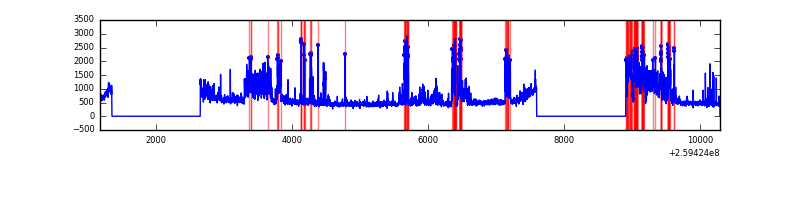 |
Top three noisy pixels from each quadrant. If the there are fewer than three noisy pixels in the level2.evt file, extra rows are filled as -1
| Pixel properties | Quadrant properties | ||||||
|---|---|---|---|---|---|---|---|
| Quadrant | DetID | PixID | Counts | Sigma | Mean | Median | Sigma |
| A | 8 | 15 | 52227 | 292.81 | 869 | 853 | 175.5 |
| A | 15 | 69 | 14851 | 79.78 | 869 | 853 | 175.5 |
| A | 1 | 162 | 7880 | 40.05 | 869 | 853 | 175.5 |
| B | 4 | 142 | 54337 | 328.88 | 870 | 849 | 162.6 |
| B | 0 | 230 | 37836 | 227.42 | 870 | 849 | 162.6 |
| B | 12 | 111 | 18592 | 109.1 | 870 | 849 | 162.6 |
| C | 3 | 233 | 81527 | 422.45 | 835 | 840 | 191.0 |
| C | 14 | 220 | 36741 | 187.96 | 835 | 840 | 191.0 |
| C | 13 | 61 | 6003 | 27.03 | 835 | 840 | 191.0 |
| D | 8 | 195 | 611703 | 3126.2 | 821 | 799 | 195.4 |
| D | 13 | 249 | 578513 | 2956.35 | 821 | 799 | 195.4 |
| D | 1 | 52 | 401664 | 2051.36 | 821 | 799 | 195.4 |
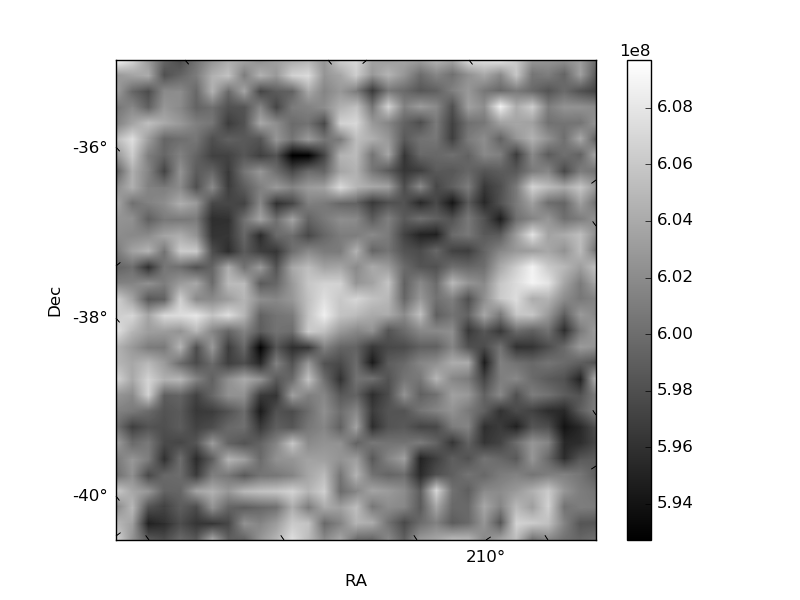
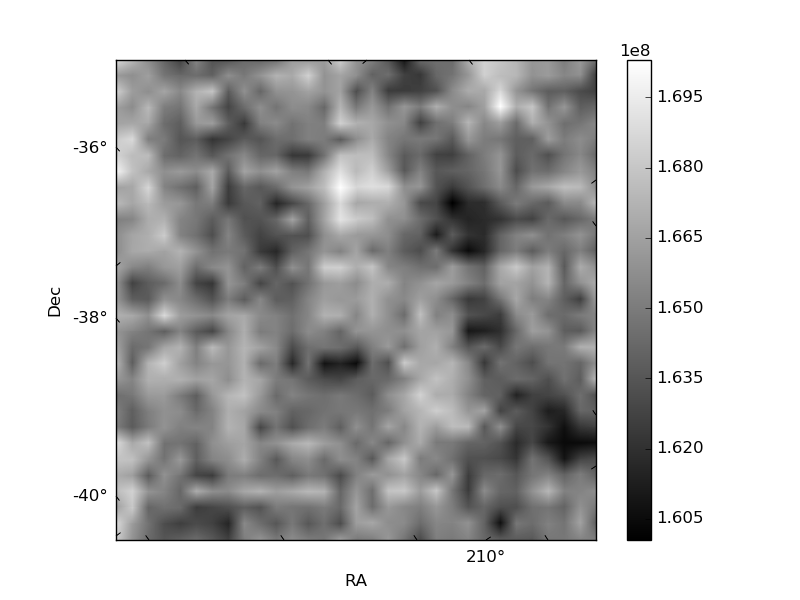
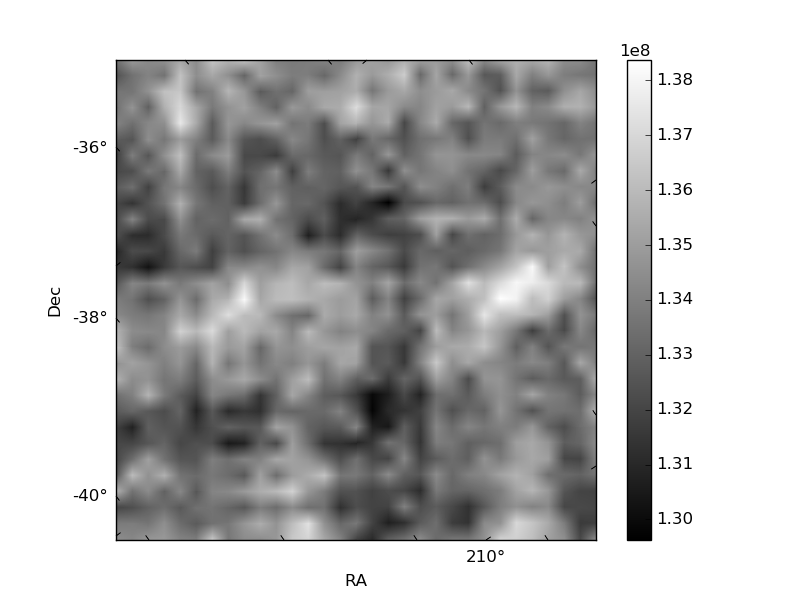
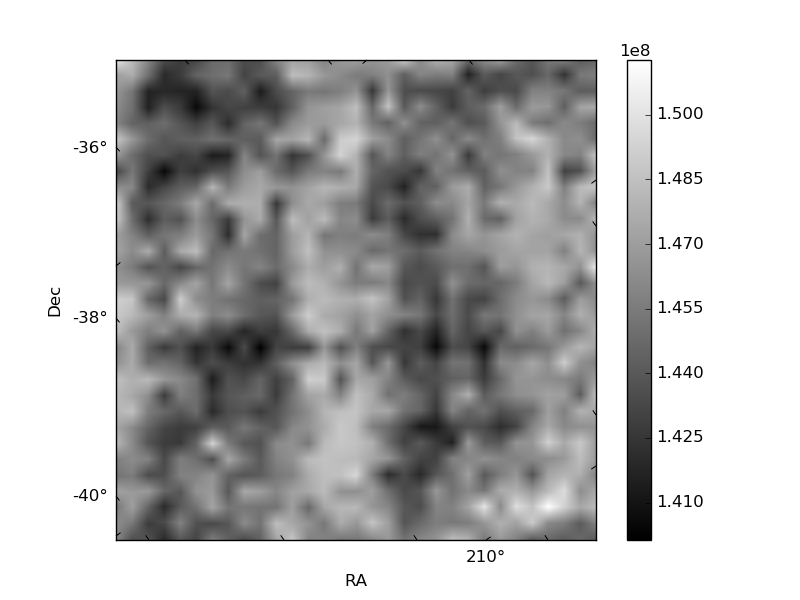
Histogram calculated using DETX and DETY for each event in the final _common_clean file
| Quadrant A | 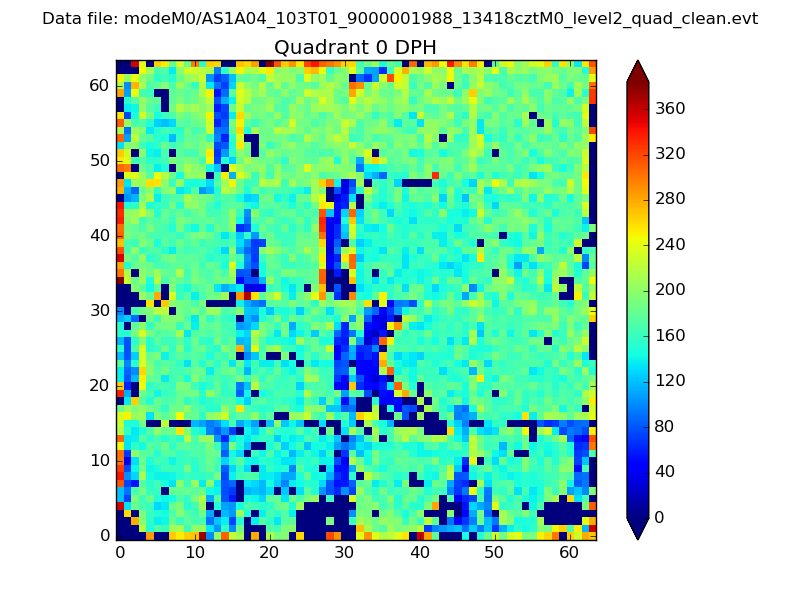 |
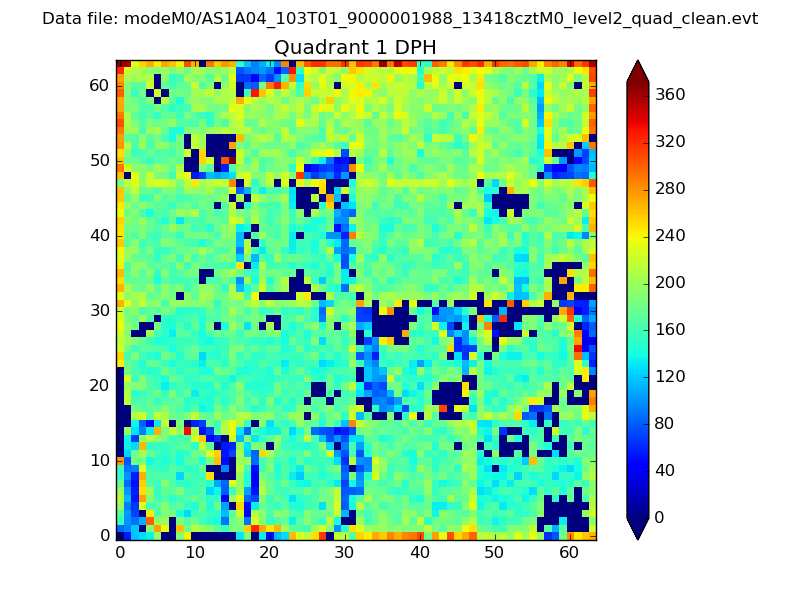 |
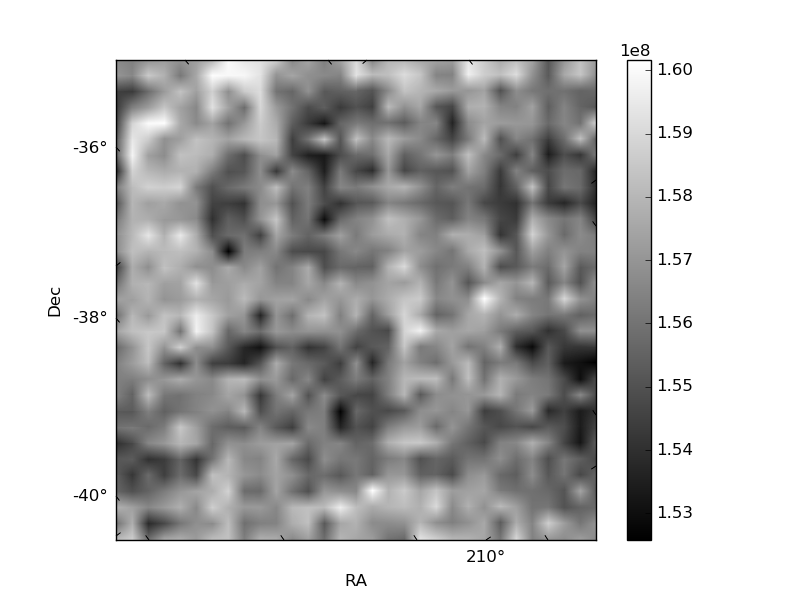
Quadrant B |
|---|---|---|---|
| Quadrant D | 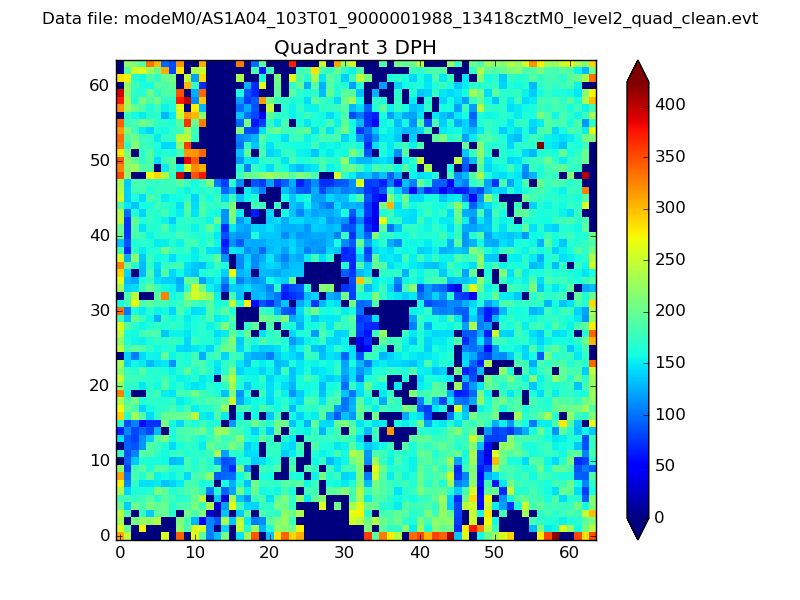 |
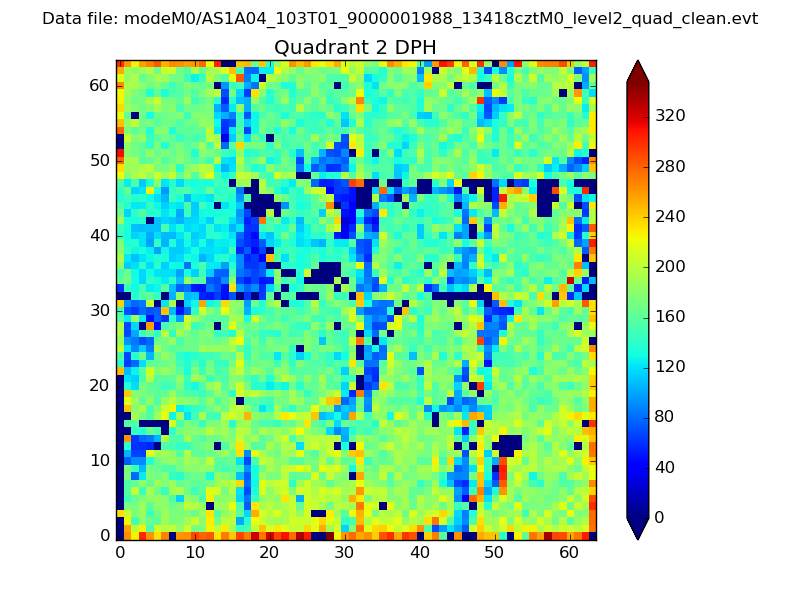 |
Quadrant C |
| Plot type | Count rate plots | Images |
|---|---|---|
| Comparison with Poisson distribution Blue bars denote a histogram of data divided into 1 sec bins. Red curve is a Poisson curve with rate = median count rate of data. |
 |
 |
| Quadrant-wise count rates Data is divided into 100 sec bins |
 |
|
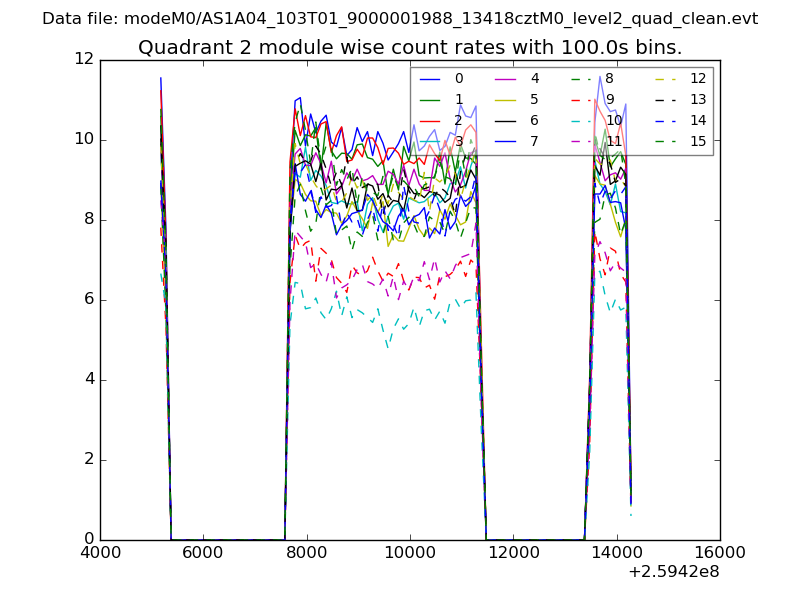
| Module-wise count rates for Quadrant A Data is divided into 100 sec bins |
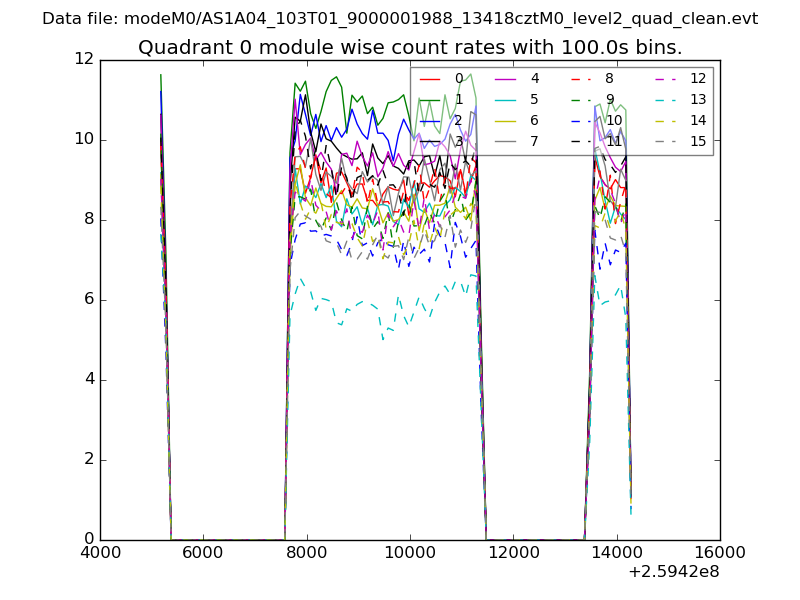 |
 |
| Module-wise count rates for Quadrant B Data is divided into 100 sec bins |
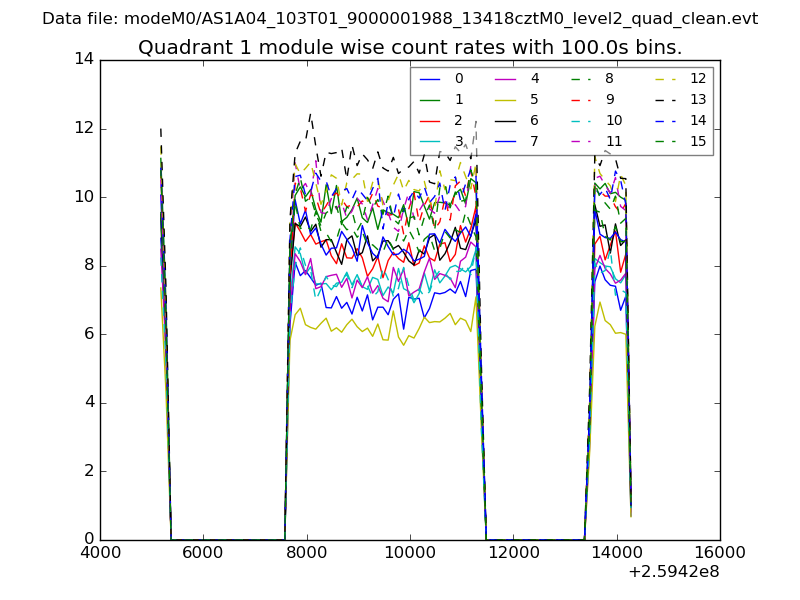 |
 |
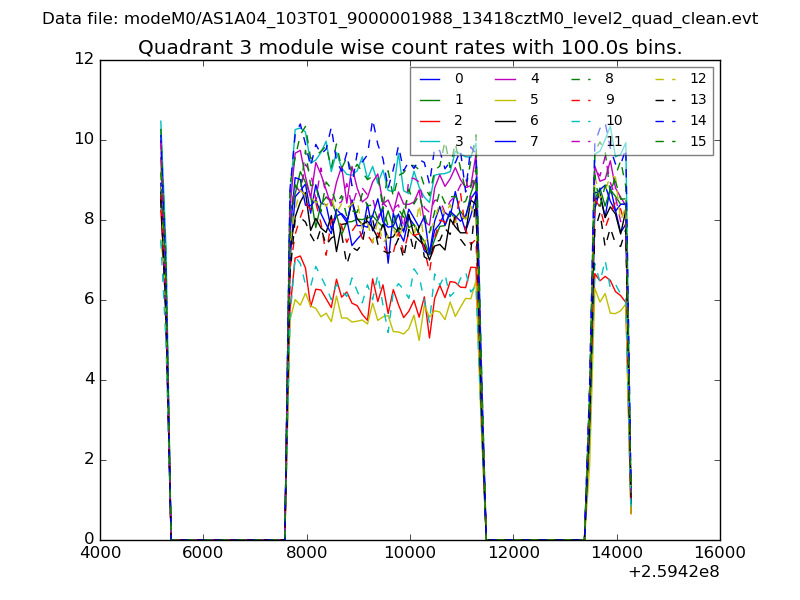
| Module-wise count rates for Quadrant C Data is divided into 100 sec bins |
 |
 |
| Module-wise count rates for Quadrant D Data is divided into 100 sec bins |
 |
 |
| Parameter | Plot |
|---|---|
| CZT HV Monitor | 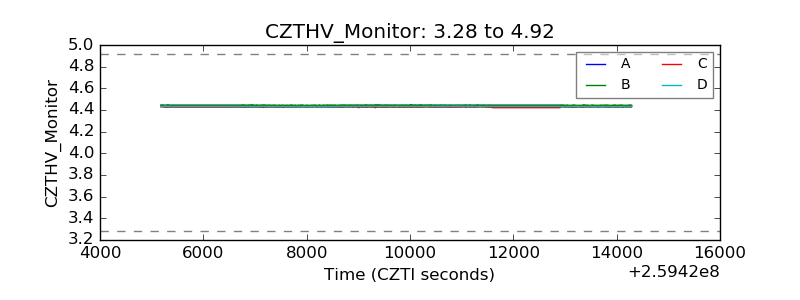 |
| D_VDD | 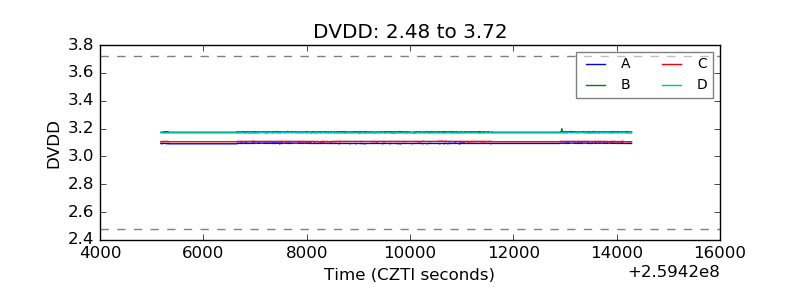 |
| Temperature 1 | 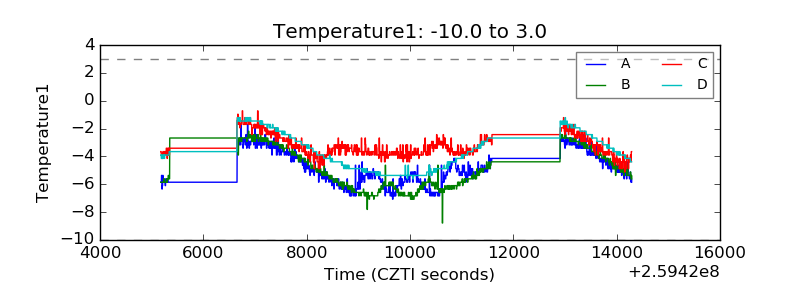 |
| Veto HV Monitor | 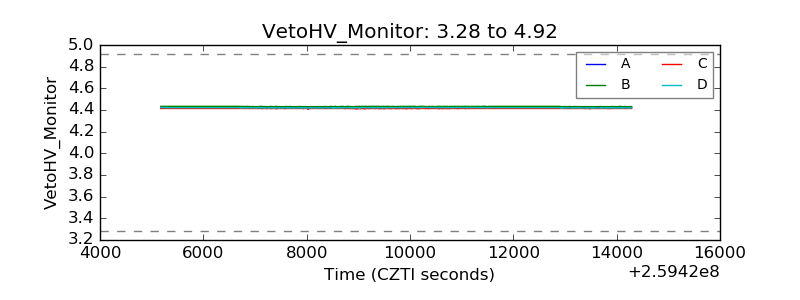 |
| Veto LLD | 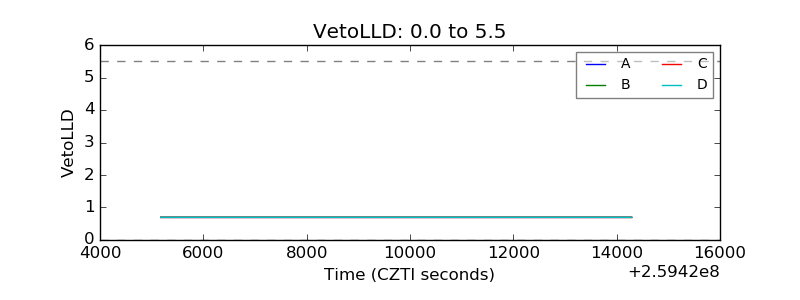 |
| Alpha Counter | 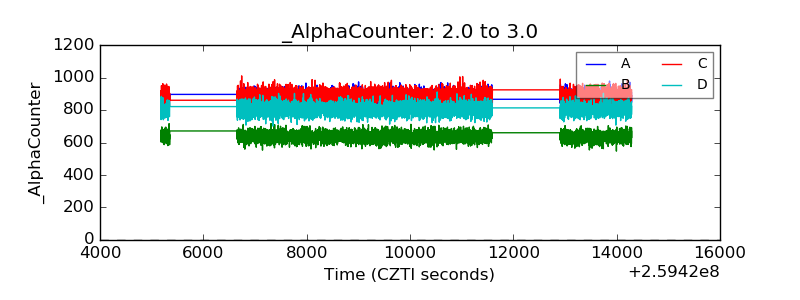 |
| _CPM_Rate | 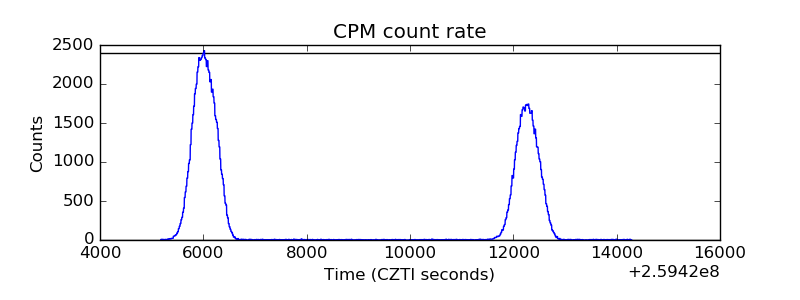 |
| CZT Counter | 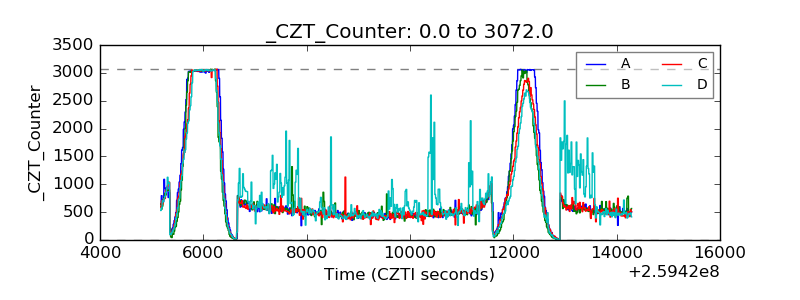 |
| +2.5 Volts monitor |  |
| +5 Volts monitor |  |
| _ROLL_ROT | 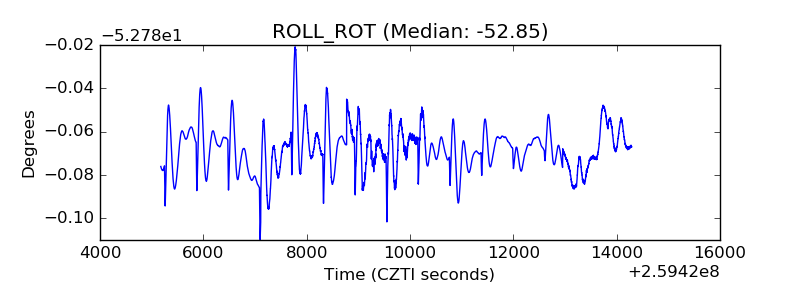 |
| _Roll_DEC | 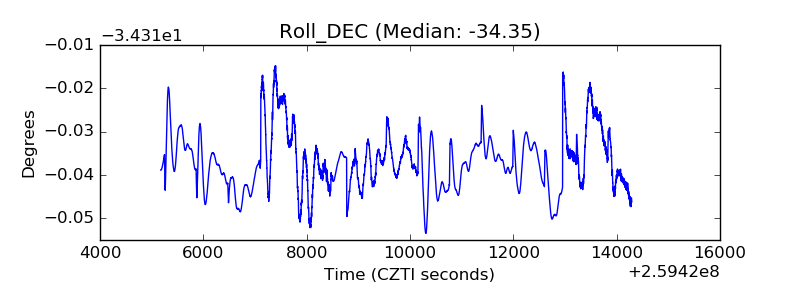 |
| _Roll_RA | 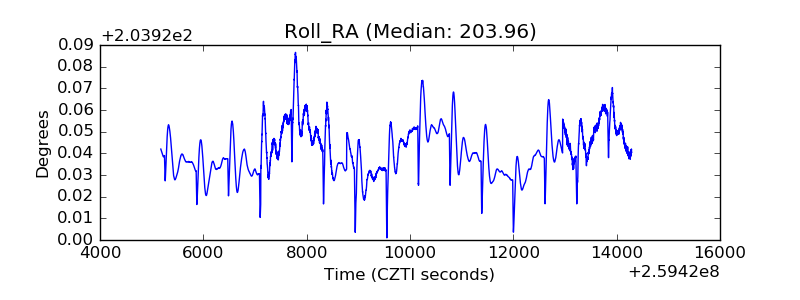 |
| Veto Counter | 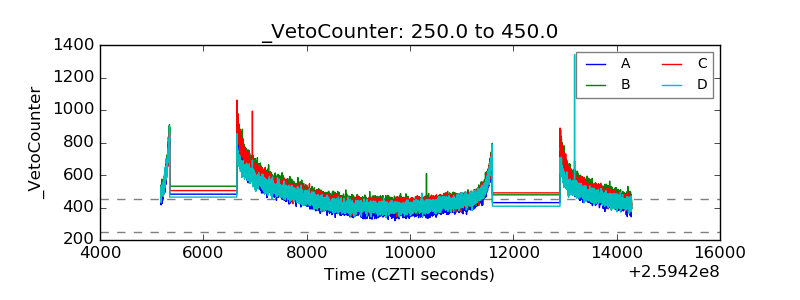 |