| Param | Original file | Final file |
|---|---|---|
| Filename | modeM0/AS1A04_103T01_9000001988_13420cztM0_level2.evt | modeM0/AS1A04_103T01_9000001988_13420cztM0_level2_quad_clean.evt |
| Size (bytes) | 469,615,680 | 99,659,520 |
| Size | 447.9 MB | 95.0 MB |
| Events in quadrant A | 3,227,046 | 647,465 |
| Events in quadrant B | 3,386,892 | 662,928 |
| Events in quadrant C | 3,133,655 | 638,921 |
| Events in quadrant D | 4,019,472 | 601,819 |
| Mode M0 | |||
|---|---|---|---|
| Quadrant | BADHDUFLAG | Total packets | Discarded packets |
| A | 0 | 14088 | 3 |
| B | 0 | 14472 | 2 |
| C | 0 | 13799 | 2 |
| D | 0 | 16420 | 2 |
| Mode SS | |||
|---|---|---|---|
| Quadrant | BADHDUFLAG | Total packets | Discarded packets |
| A | 0 | 136 | 0 |
| B | 0 | 136 | 0 |
| C | 0 | 136 | 0 |
| D | 0 | 136 | 0 |
| Mode M9 | |||
|---|---|---|---|
| Quadrant | BADHDUFLAG | Total packets | Discarded packets |
| A | 0 | 9 | 0 |
| B | 0 | 9 | 0 |
| C | 0 | 9 | 0 |
| D | 0 | 10 | 0 |
| Quadrant | Total seconds | Saturated seconds | Saturation percentage |
|---|---|---|---|
| A | 6701 | 36 | 0.537233% |
| B | 6701 | 79 | 1.178929% |
| C | 6701 | 12 | 0.179078% |
| D | 6701 | 126 | 1.880316% |
Noise dominated data is calculated using 1-second bins in cleaned event files. If a bin has >2000 counts, and if more than 50% of those come from <1% of pixels, then it is considered to be noise-dominated and hence unusable.
| Quadrant | # 1 sec bins | Bins with >0 counts | Bins with >2000 counts | High rate bins dominated by noise | Noise dominated (total time) | Noise dominated (detector-on time) | Marked lightcurve |
|---|---|---|---|---|---|---|---|
| A | 7612 | 6703 | 8 | 8 | 0.11% | 0.12% | 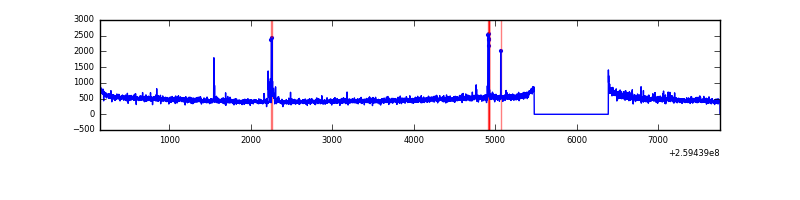 |
| B | 7612 | 6702 | 18 | 18 | 0.24% | 0.27% | 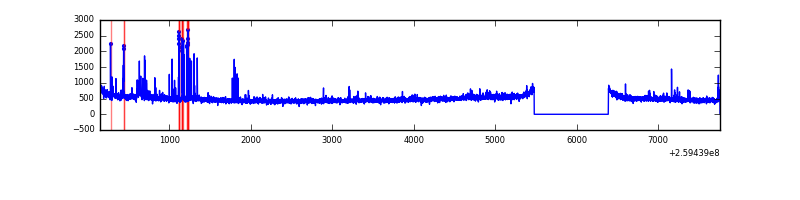 |
| C | 7612 | 6703 | 3 | 3 | 0.04% | 0.04% | 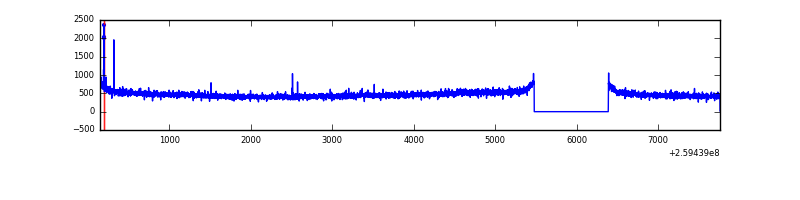 |
| D | 7612 | 6703 | 109 | 109 | 1.43% | 1.63% | 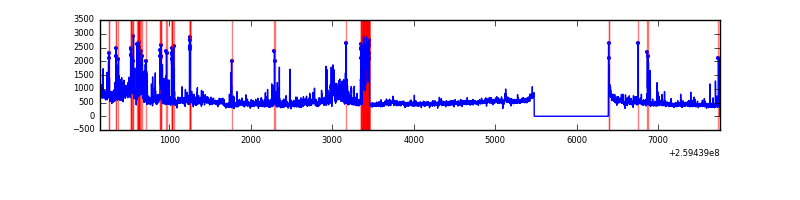 |
Top three noisy pixels from each quadrant. If the there are fewer than three noisy pixels in the level2.evt file, extra rows are filled as -1
| Pixel properties | Quadrant properties | ||||||
|---|---|---|---|---|---|---|---|
| Quadrant | DetID | PixID | Counts | Sigma | Mean | Median | Sigma |
| A | 15 | 69 | 61673 | 370.5 | 805 | 787 | 164.3 |
| A | 8 | 15 | 53822 | 322.72 | 805 | 787 | 164.3 |
| A | 1 | 162 | 10721 | 60.45 | 805 | 787 | 164.3 |
| B | 3 | 64 | 99245 | 633.85 | 813 | 793 | 155.3 |
| B | 0 | 230 | 37910 | 238.96 | 813 | 793 | 155.3 |
| B | 0 | 214 | 29481 | 184.7 | 813 | 793 | 155.3 |
| C | 3 | 233 | 67145 | 368.95 | 781 | 786 | 179.9 |
| C | 14 | 220 | 21853 | 117.13 | 781 | 786 | 179.9 |
| C | 13 | 61 | 5798 | 27.87 | 781 | 786 | 179.9 |
| D | 1 | 52 | 508230 | 2760.15 | 765 | 744 | 183.9 |
| D | 13 | 249 | 373243 | 2025.98 | 765 | 744 | 183.9 |
| D | 8 | 195 | 242526 | 1315.02 | 765 | 744 | 183.9 |
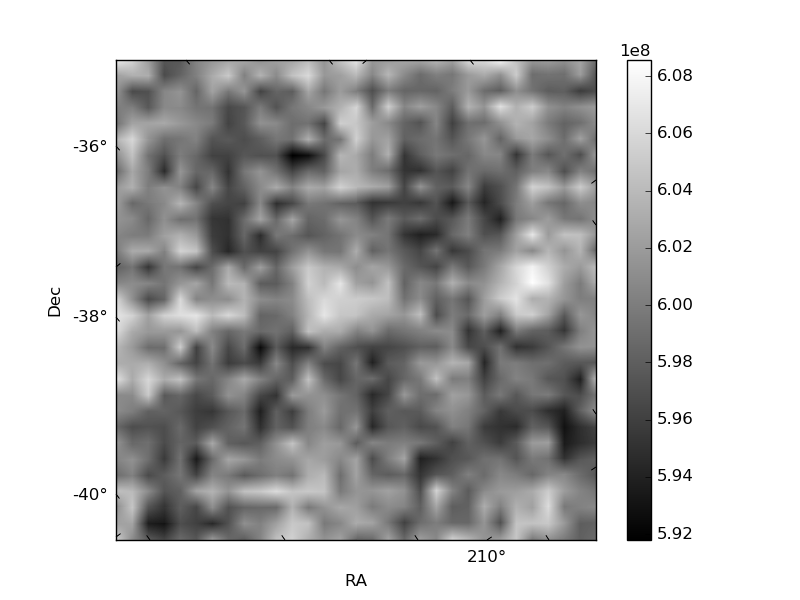
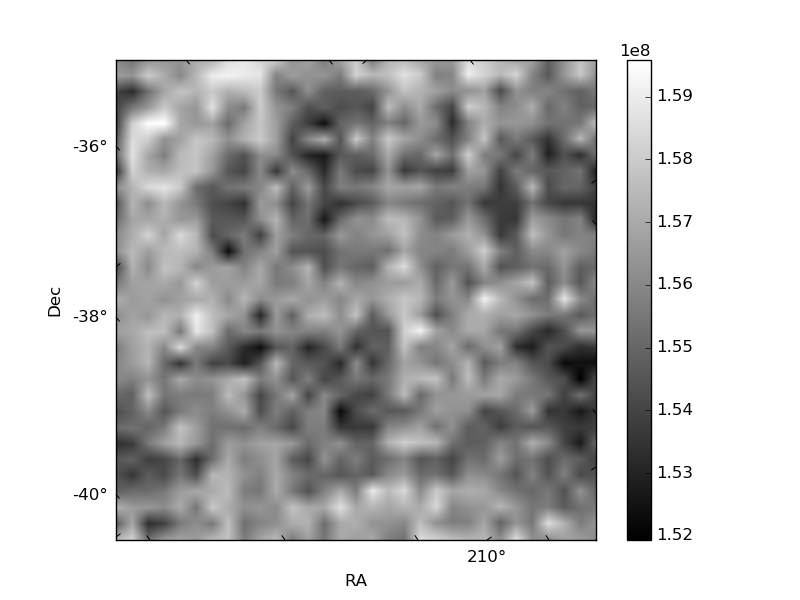
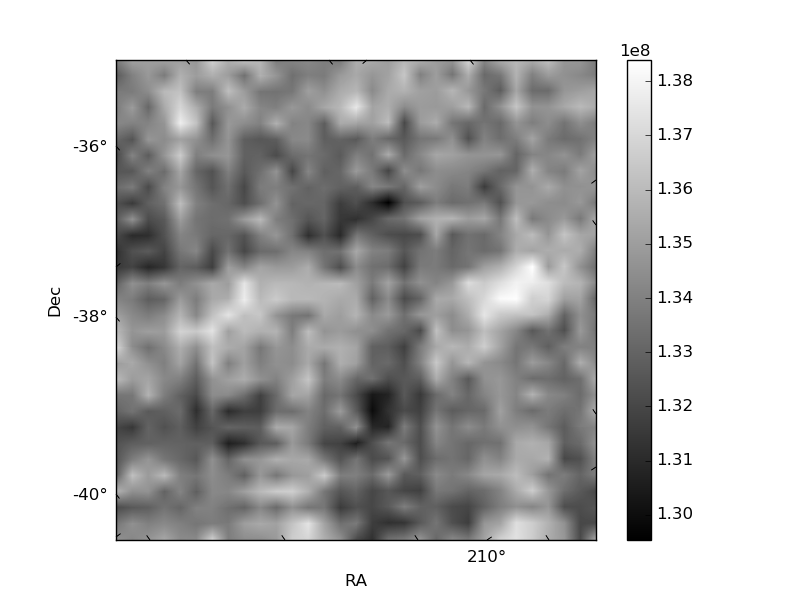
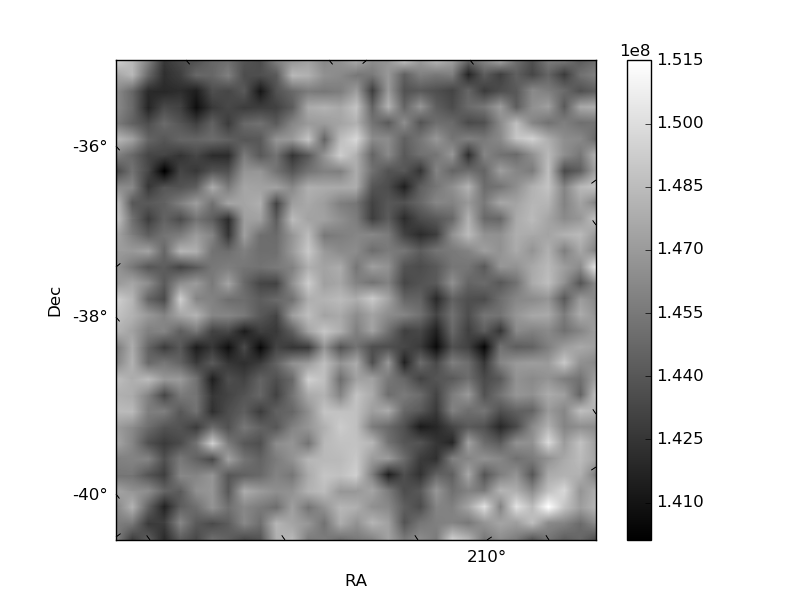
Histogram calculated using DETX and DETY for each event in the final _common_clean file
| Quadrant A | 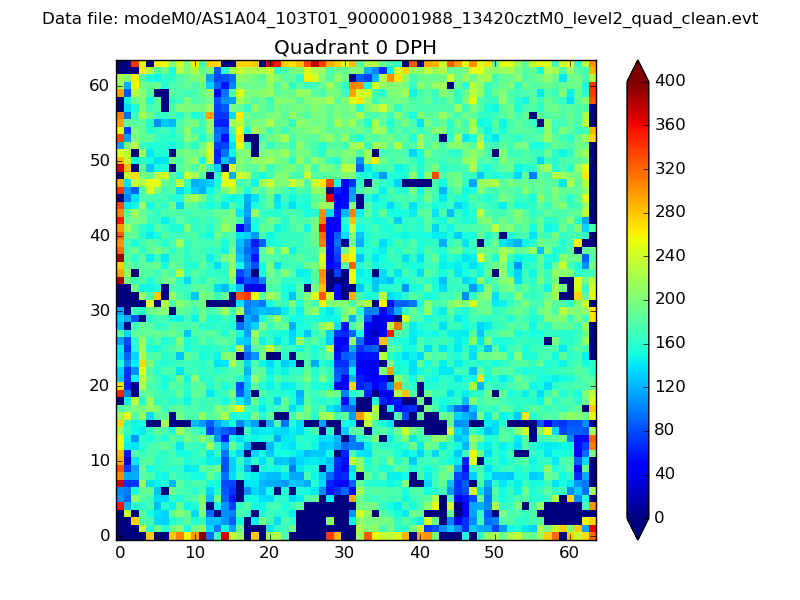 |
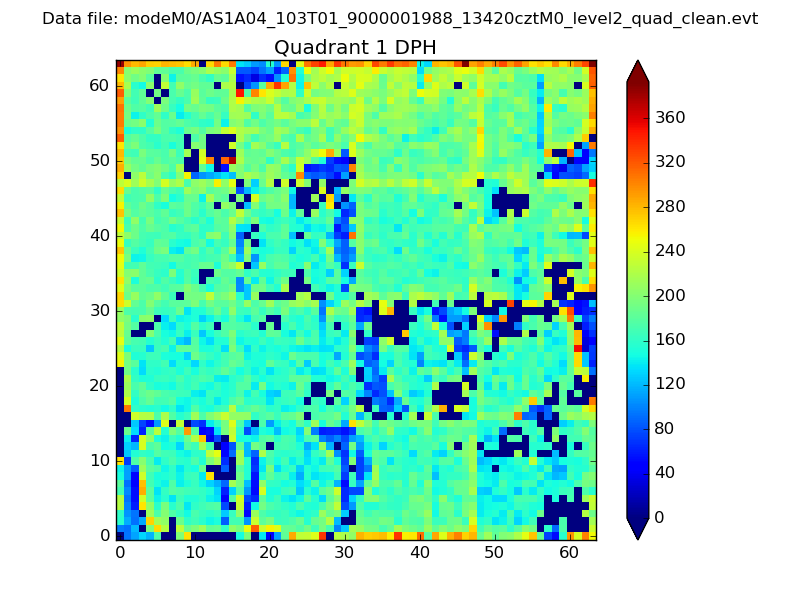 |
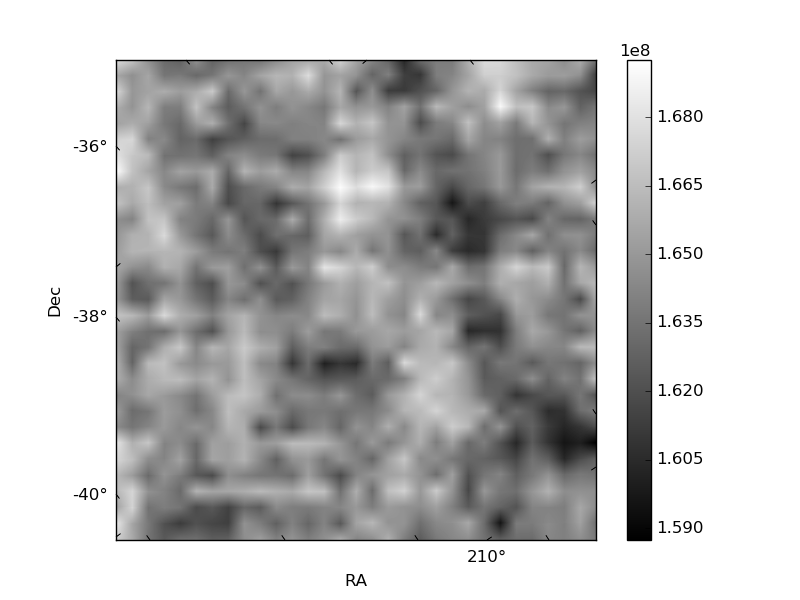
Quadrant B |
|---|---|---|---|
| Quadrant D | 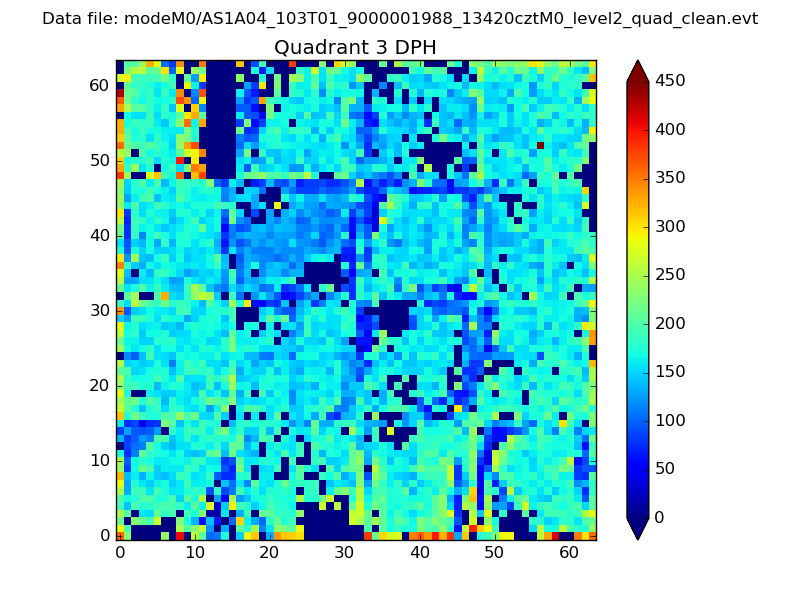 |
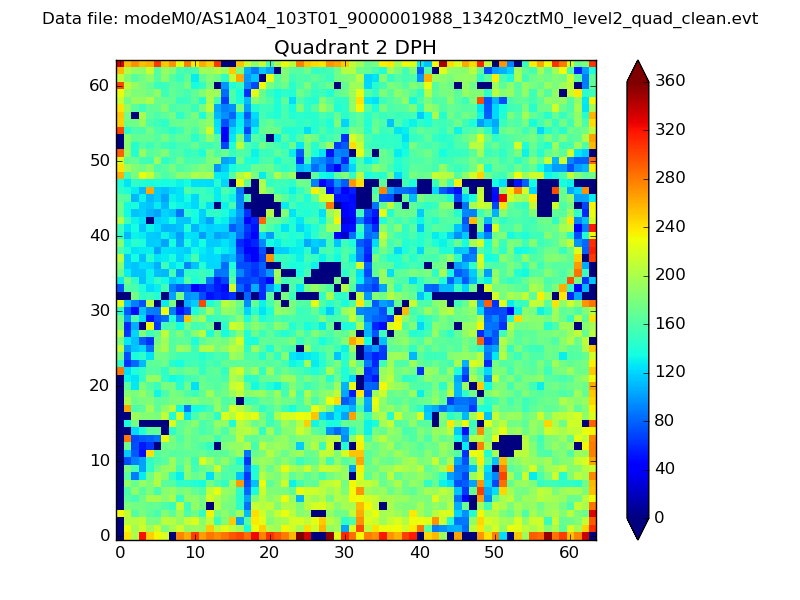 |
Quadrant C |
| Plot type | Count rate plots | Images |
|---|---|---|
| Comparison with Poisson distribution Blue bars denote a histogram of data divided into 1 sec bins. Red curve is a Poisson curve with rate = median count rate of data. |
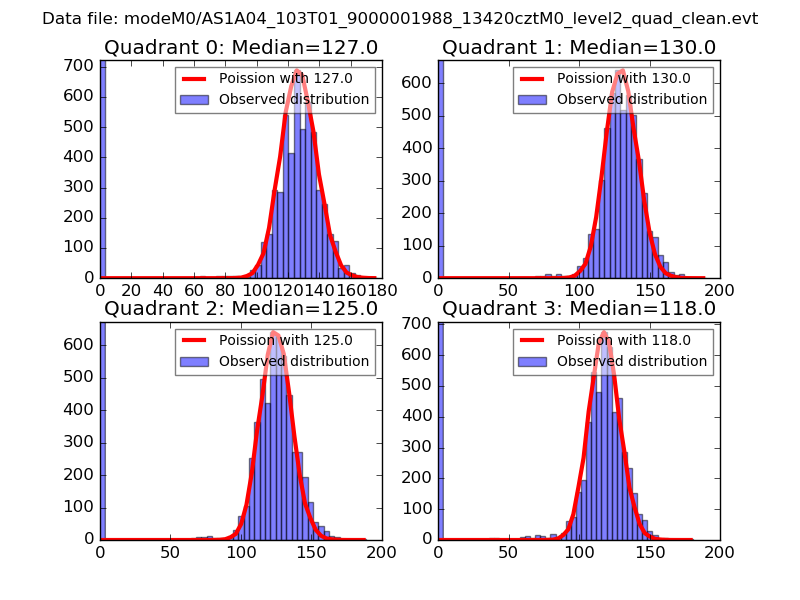 |
 |
| Quadrant-wise count rates Data is divided into 100 sec bins |
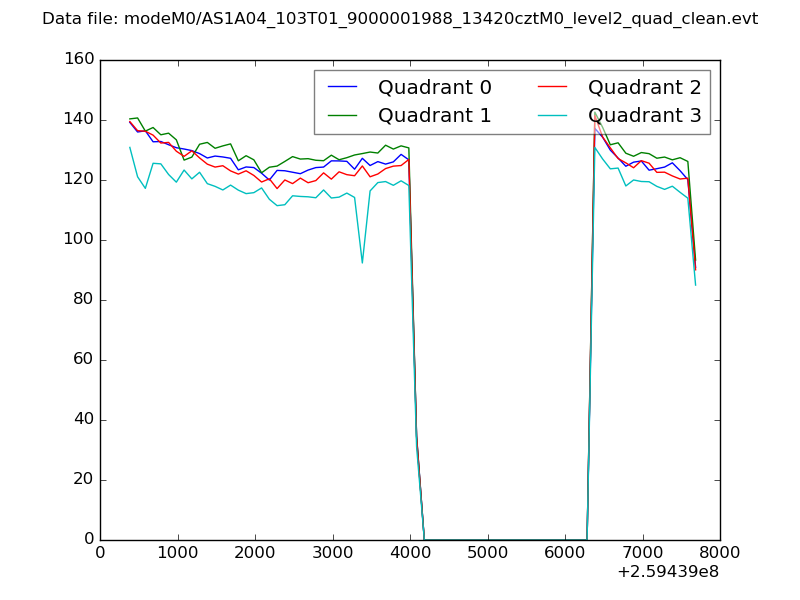 |
|
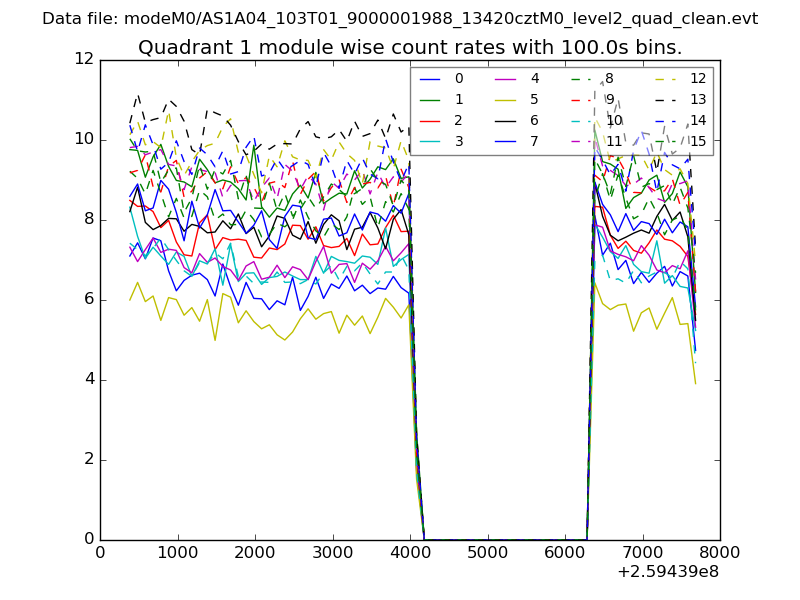
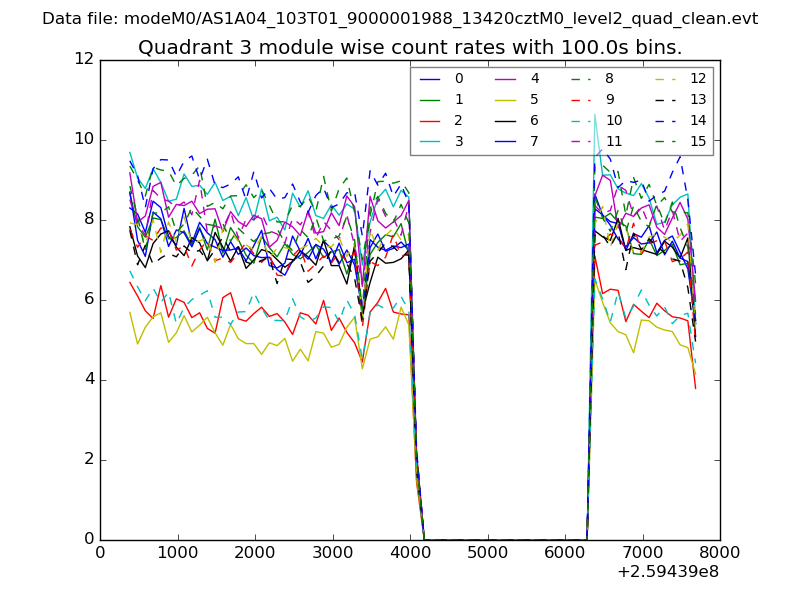
| Module-wise count rates for Quadrant A Data is divided into 100 sec bins |
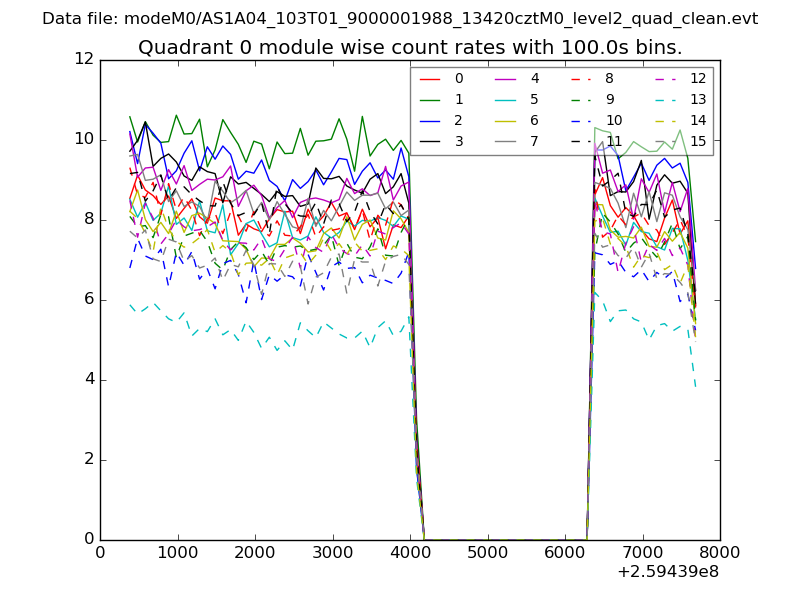 |
 |
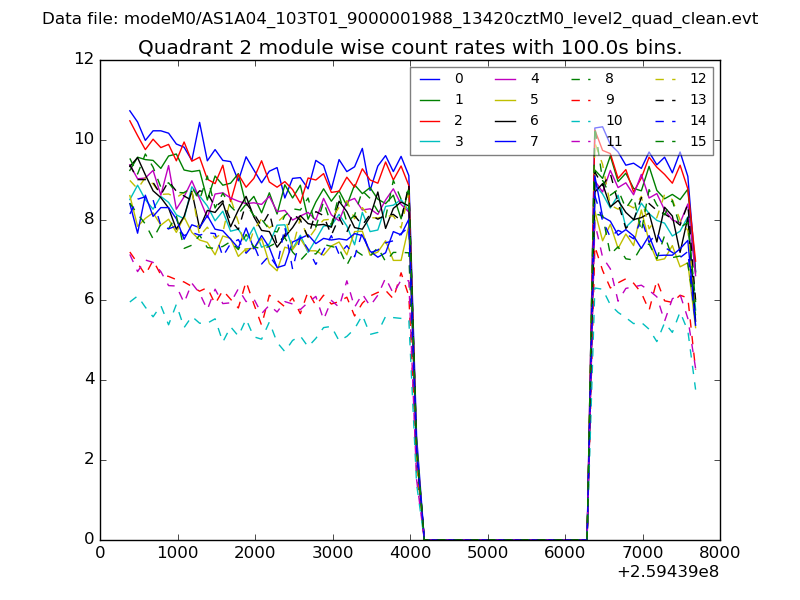
| Module-wise count rates for Quadrant B Data is divided into 100 sec bins |
 |
 |
| Module-wise count rates for Quadrant C Data is divided into 100 sec bins |
 |
 |
| Module-wise count rates for Quadrant D Data is divided into 100 sec bins |
 |
 |
| Parameter | Plot |
|---|---|
| CZT HV Monitor | 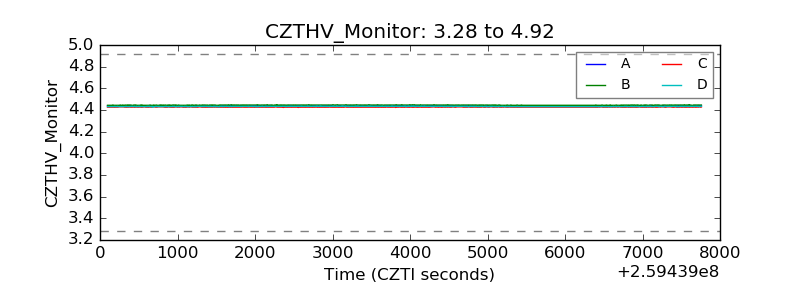 |
| D_VDD | 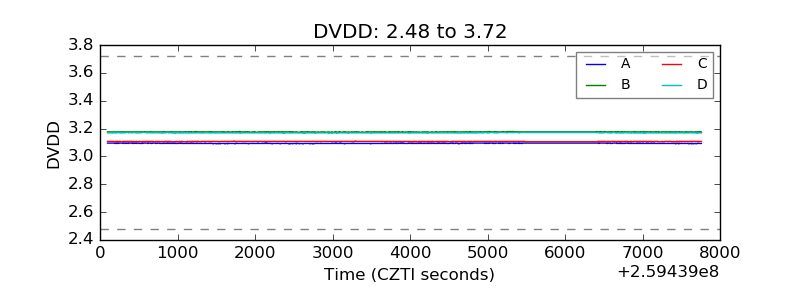 |
| Temperature 1 | 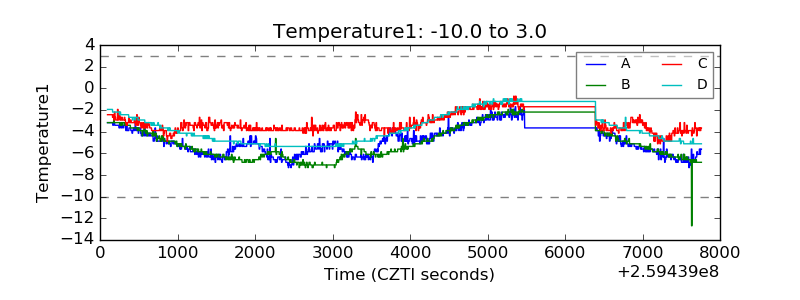 |
| Veto HV Monitor | 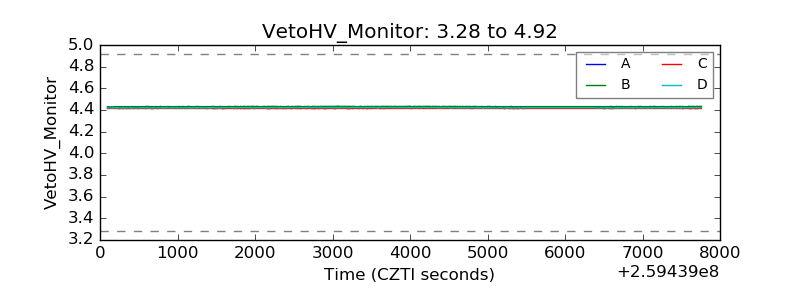 |
| Veto LLD | 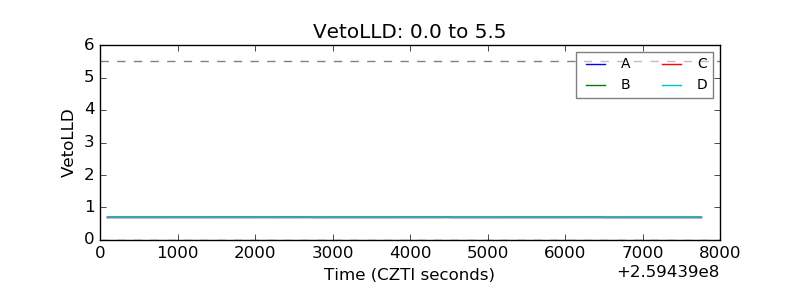 |
| Alpha Counter | 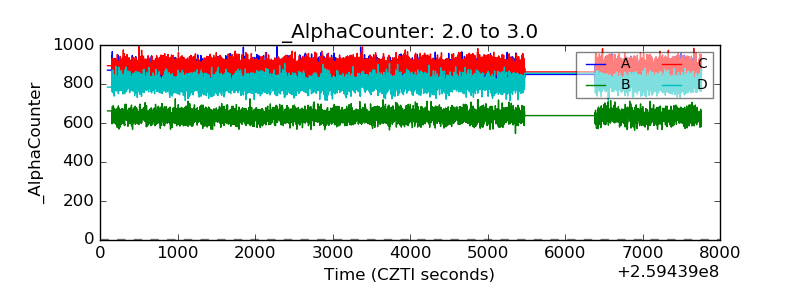 |
| _CPM_Rate | 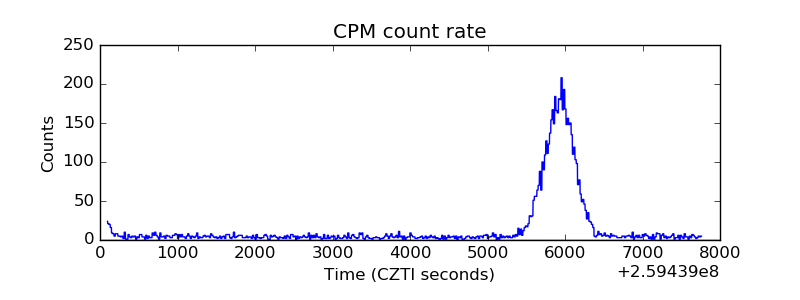 |
| CZT Counter | 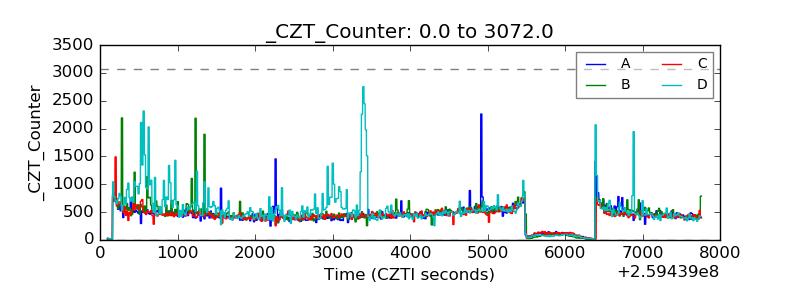 |
| +2.5 Volts monitor |  |
| +5 Volts monitor |  |
| _ROLL_ROT | 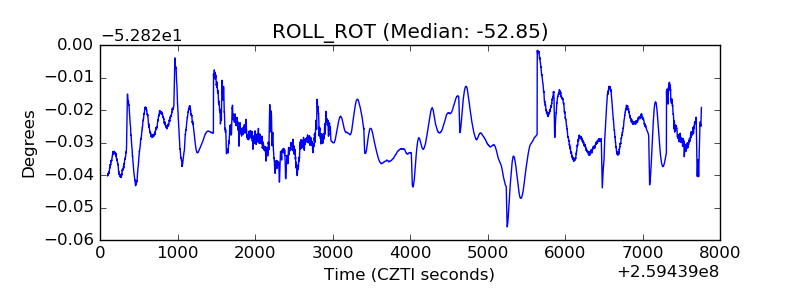 |
| _Roll_DEC | 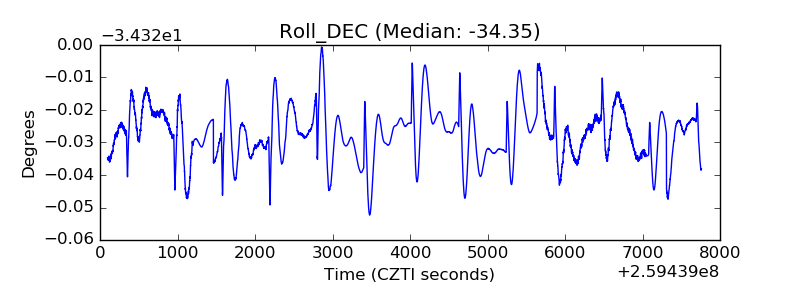 |
| _Roll_RA | 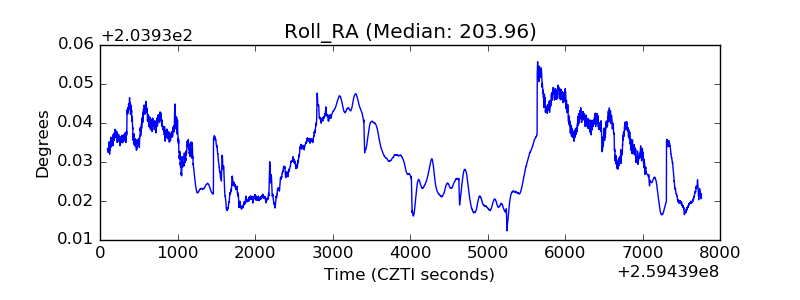 |
| Veto Counter | 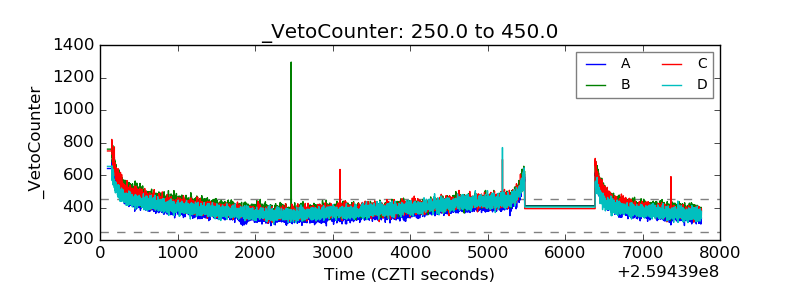 |