| Param | Original file | Final file |
|---|---|---|
| Filename | modeM0/AS1A04_103T01_9000001988_13422cztM0_level2.evt | modeM0/AS1A04_103T01_9000001988_13422cztM0_level2_quad_clean.evt |
| Size (bytes) | 708,716,160 | 104,656,320 |
| Size | 675.9 MB | 99.8 MB |
| Events in quadrant A | 3,684,172 | 670,390 |
| Events in quadrant B | 3,882,592 | 686,159 |
| Events in quadrant C | 3,637,981 | 668,710 |
| Events in quadrant D | 9,722,390 | 593,173 |
| Mode M0 | |||
|---|---|---|---|
| Quadrant | BADHDUFLAG | Total packets | Discarded packets |
| A | 0 | 16398 | 4 |
| B | 0 | 16868 | 3 |
| C | 0 | 16277 | 3 |
| D | 0 | 34289 | 3 |
| Mode SS | |||
|---|---|---|---|
| Quadrant | BADHDUFLAG | Total packets | Discarded packets |
| A | 0 | 164 | 0 |
| B | 0 | 164 | 0 |
| C | 0 | 164 | 0 |
| D | 0 | 164 | 0 |
| Mode M9 | |||
|---|---|---|---|
| Quadrant | BADHDUFLAG | Total packets | Discarded packets |
| A | 0 | 7 | 0 |
| B | 0 | 7 | 0 |
| C | 0 | 7 | 0 |
| D | 0 | 7 | 0 |
| Quadrant | Total seconds | Saturated seconds | Saturation percentage |
|---|---|---|---|
| A | 7915 | 37 | 0.467467% |
| B | 7915 | 141 | 1.781428% |
| C | 7915 | 25 | 0.315856% |
| D | 7915 | 1902 | 24.030322% |
Noise dominated data is calculated using 1-second bins in cleaned event files. If a bin has >2000 counts, and if more than 50% of those come from <1% of pixels, then it is considered to be noise-dominated and hence unusable.
| Quadrant | # 1 sec bins | Bins with >0 counts | Bins with >2000 counts | High rate bins dominated by noise | Noise dominated (total time) | Noise dominated (detector-on time) | Marked lightcurve |
|---|---|---|---|---|---|---|---|
| A | 8706 | 7916 | 2 | 2 | 0.02% | 0.03% | 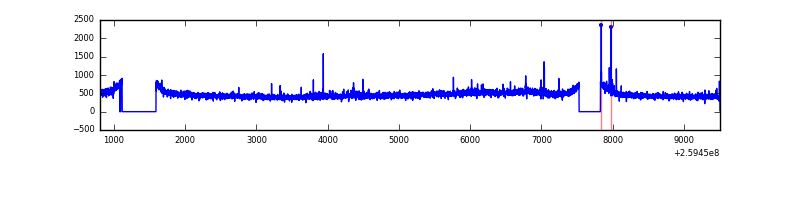 |
| B | 8706 | 7918 | 28 | 28 | 0.32% | 0.35% | 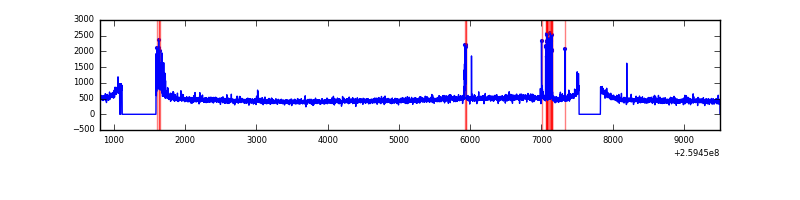 |
| C | 8706 | 7918 | 1 | 1 | 0.01% | 0.01% | 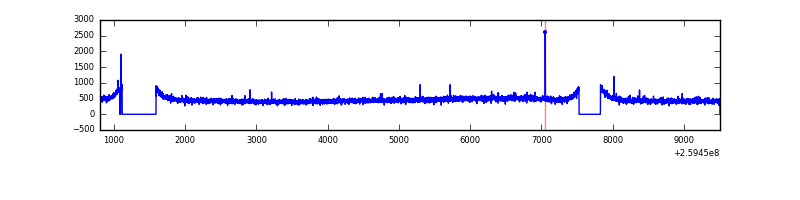 |
| D | 8706 | 7919 | 1879 | 1879 | 21.58% | 23.73% | 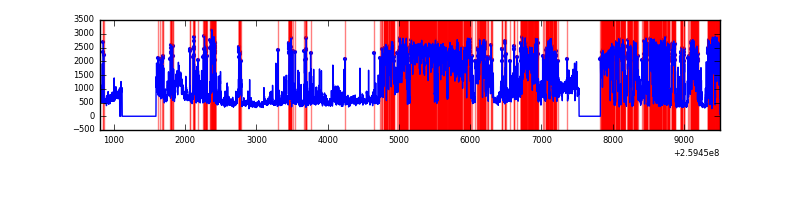 |
Top three noisy pixels from each quadrant. If the there are fewer than three noisy pixels in the level2.evt file, extra rows are filled as -1
| Pixel properties | Quadrant properties | ||||||
|---|---|---|---|---|---|---|---|
| Quadrant | DetID | PixID | Counts | Sigma | Mean | Median | Sigma |
| A | 1 | 162 | 27143 | 136.21 | 941 | 920 | 192.5 |
| A | 15 | 69 | 14964 | 72.95 | 941 | 920 | 192.5 |
| A | 8 | 15 | 12048 | 57.8 | 941 | 920 | 192.5 |
| B | 4 | 142 | 149079 | 815.21 | 944 | 918 | 181.7 |
| B | 3 | 64 | 31155 | 166.37 | 944 | 918 | 181.7 |
| B | 12 | 111 | 21668 | 114.17 | 944 | 918 | 181.7 |
| C | 3 | 233 | 40233 | 183.1 | 918 | 922 | 214.7 |
| C | 14 | 220 | 9337 | 39.2 | 918 | 922 | 214.7 |
| C | 13 | 61 | 6447 | 25.73 | 918 | 922 | 214.7 |
| D | 1 | 52 | 3828739 | 19179.86 | 833 | 811 | 199.6 |
| D | 13 | 249 | 2388814 | 11965.11 | 833 | 811 | 199.6 |
| D | 2 | 136 | 191435 | 955.12 | 833 | 811 | 199.6 |
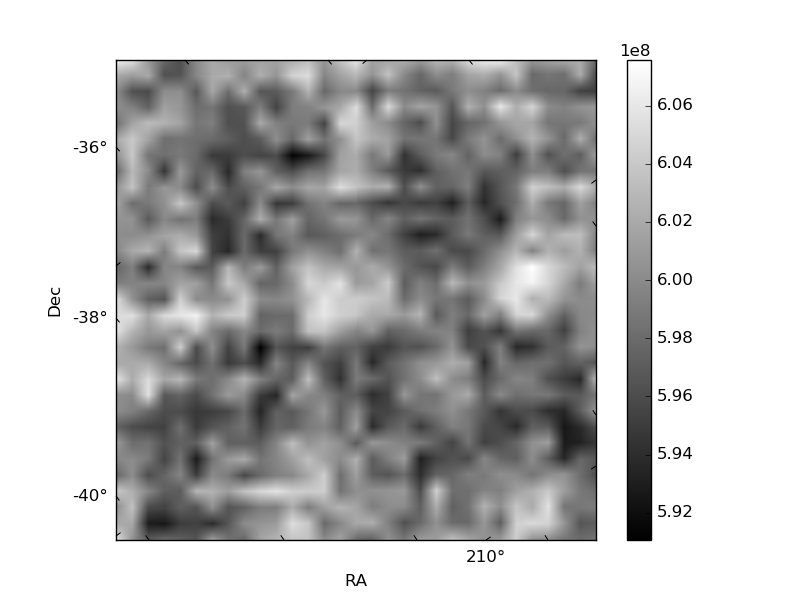
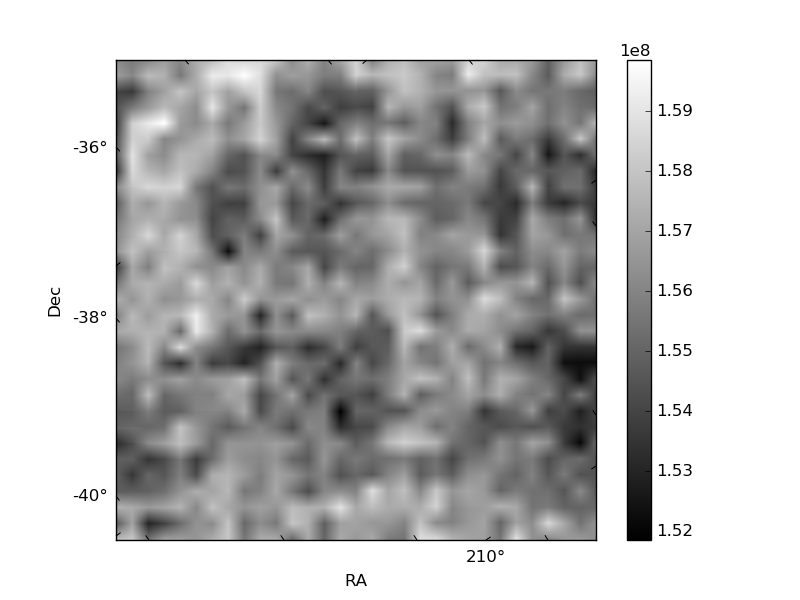
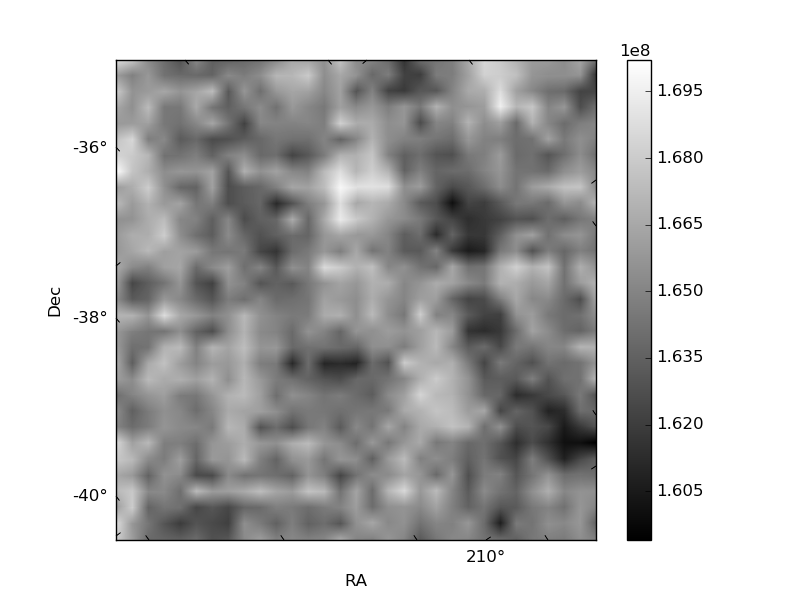
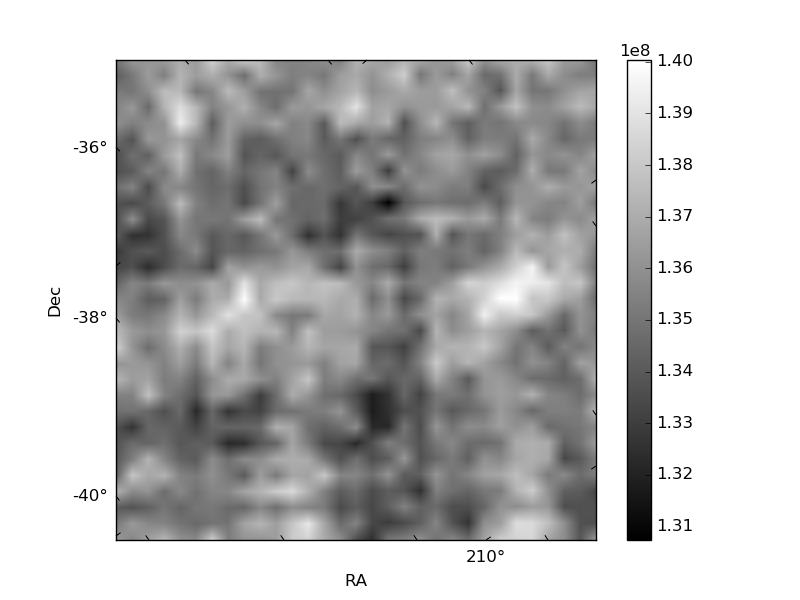
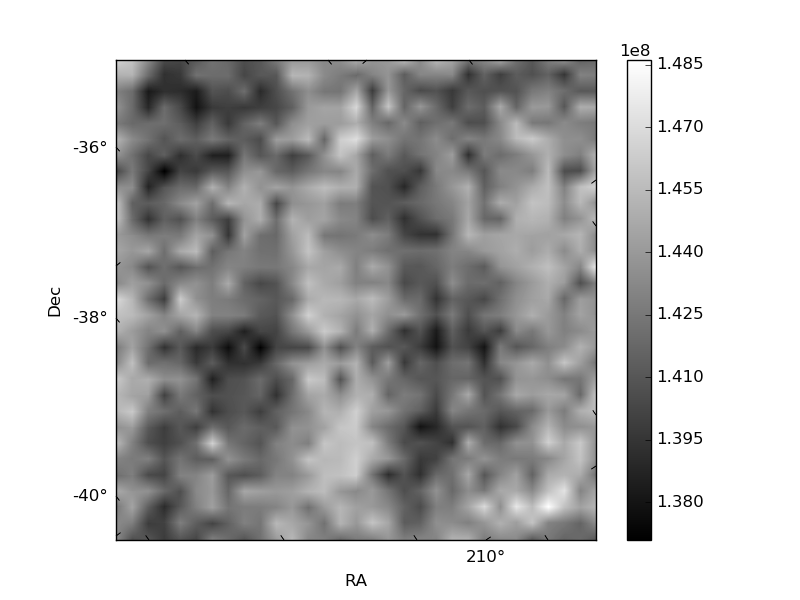
Histogram calculated using DETX and DETY for each event in the final _common_clean file
| Quadrant A | 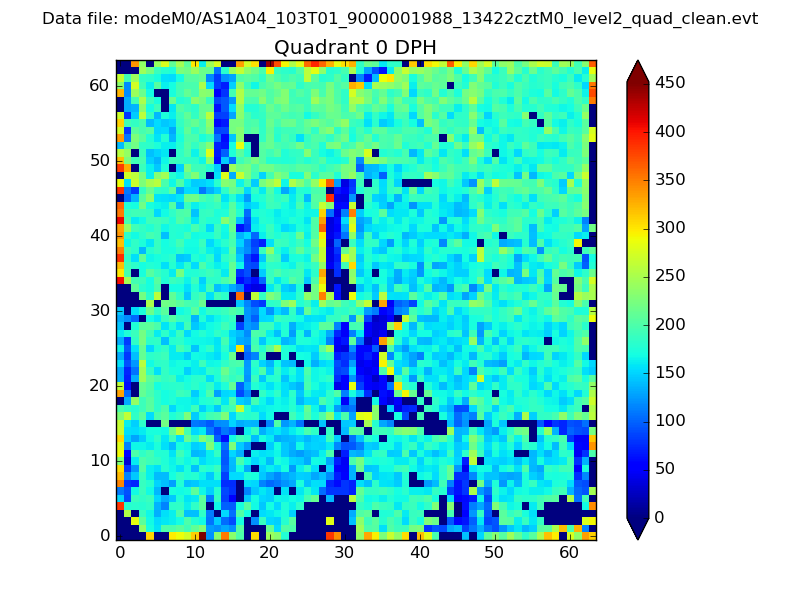 |
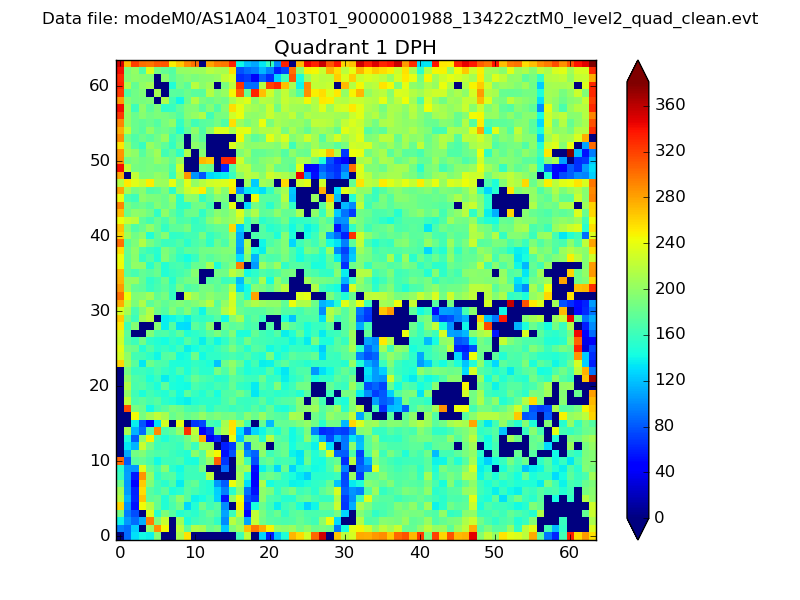 |
Quadrant B |
|---|---|---|---|
| Quadrant D | 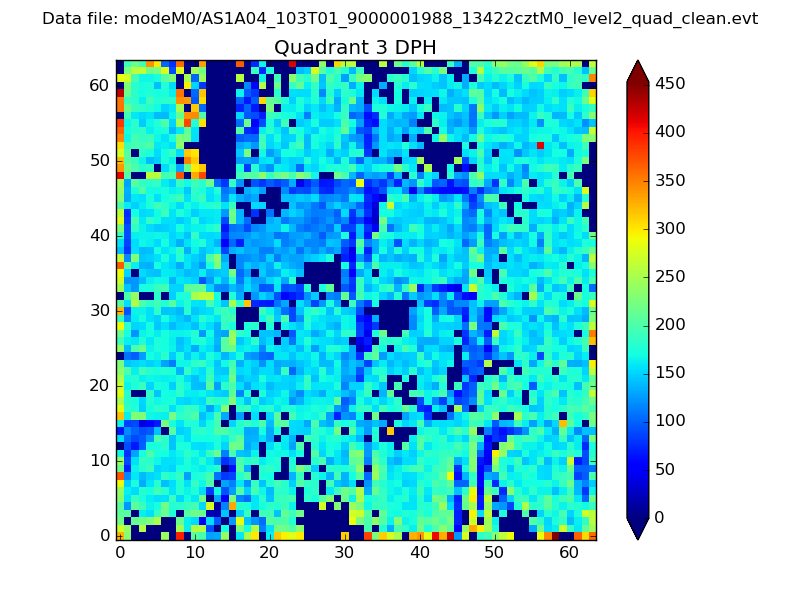 |
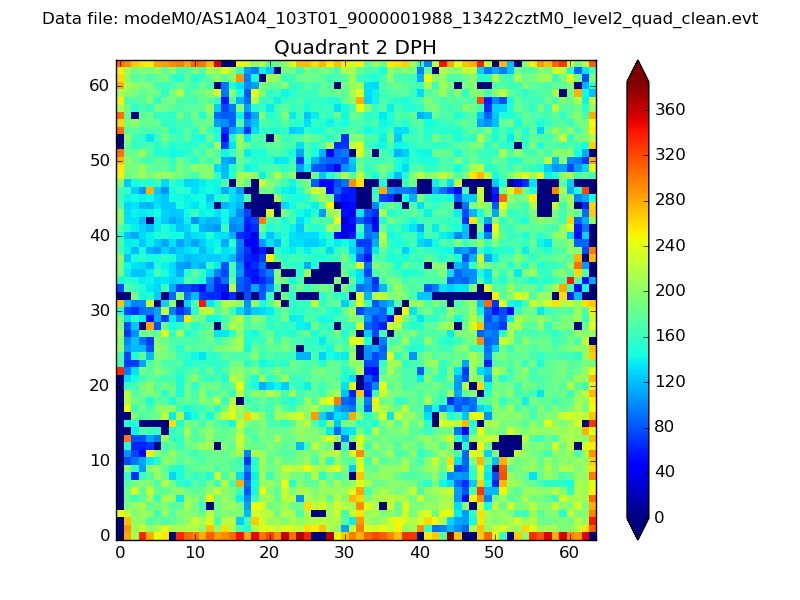 |
Quadrant C |
| Plot type | Count rate plots | Images |
|---|---|---|
| Comparison with Poisson distribution Blue bars denote a histogram of data divided into 1 sec bins. Red curve is a Poisson curve with rate = median count rate of data. |
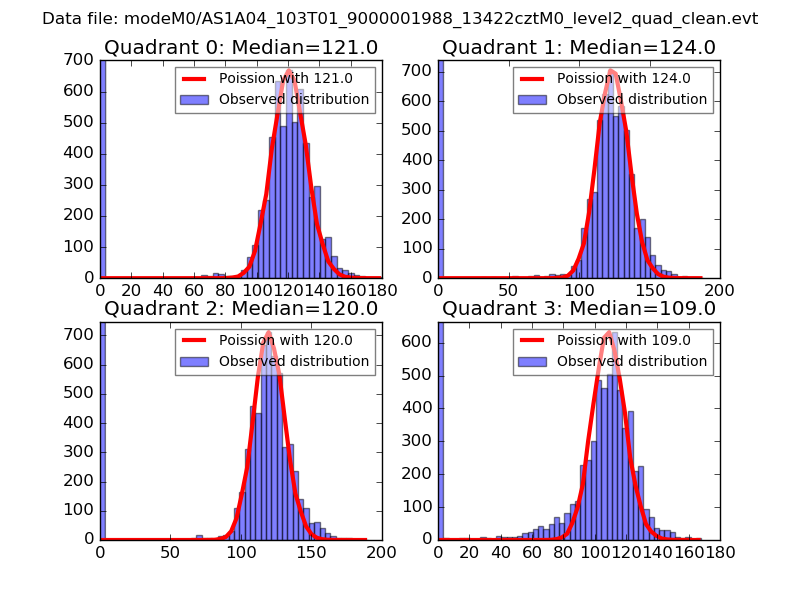 |
 |
| Quadrant-wise count rates Data is divided into 100 sec bins |
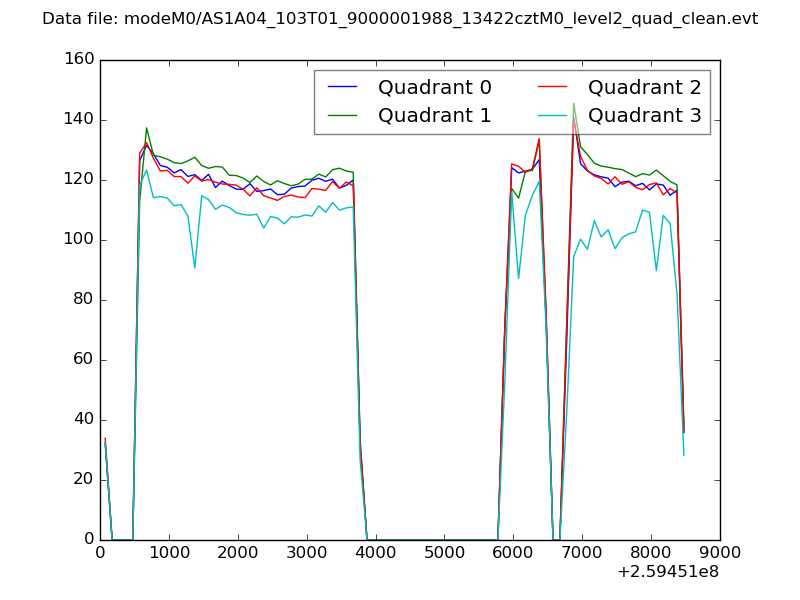 |
|
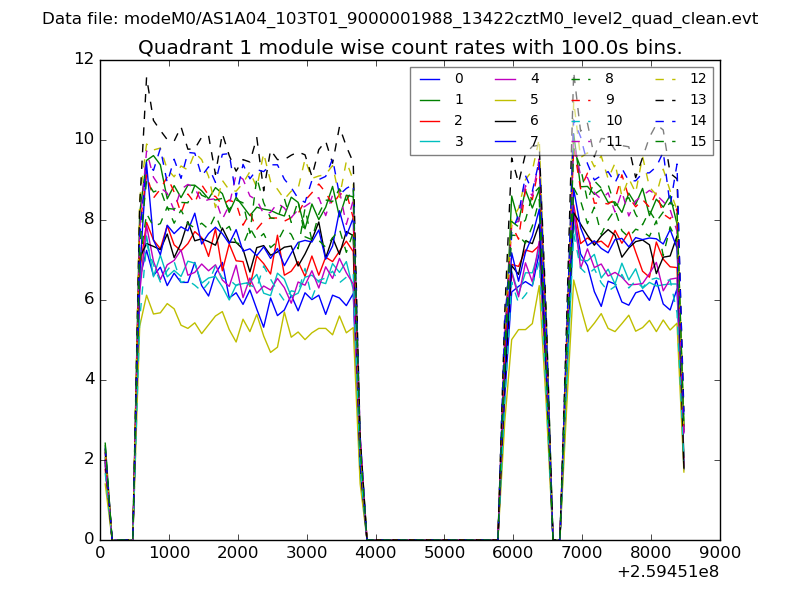
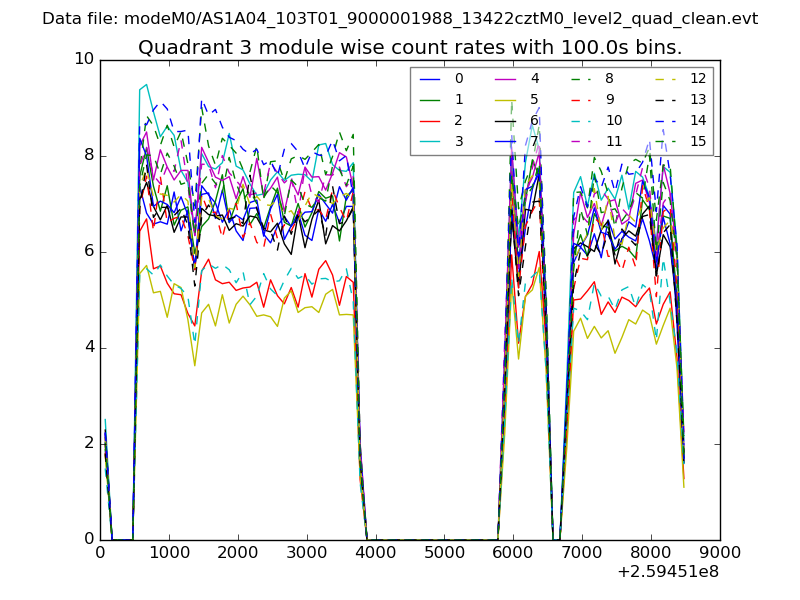
| Module-wise count rates for Quadrant A Data is divided into 100 sec bins |
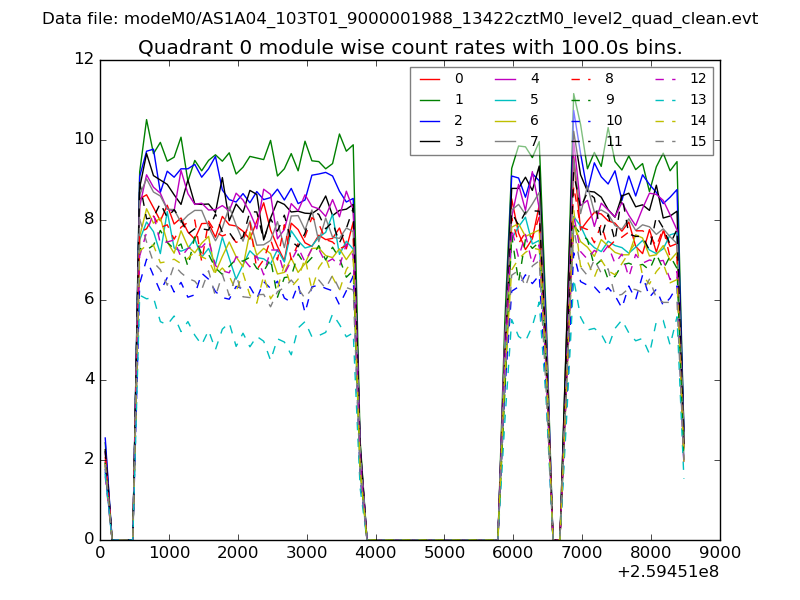 |
 |
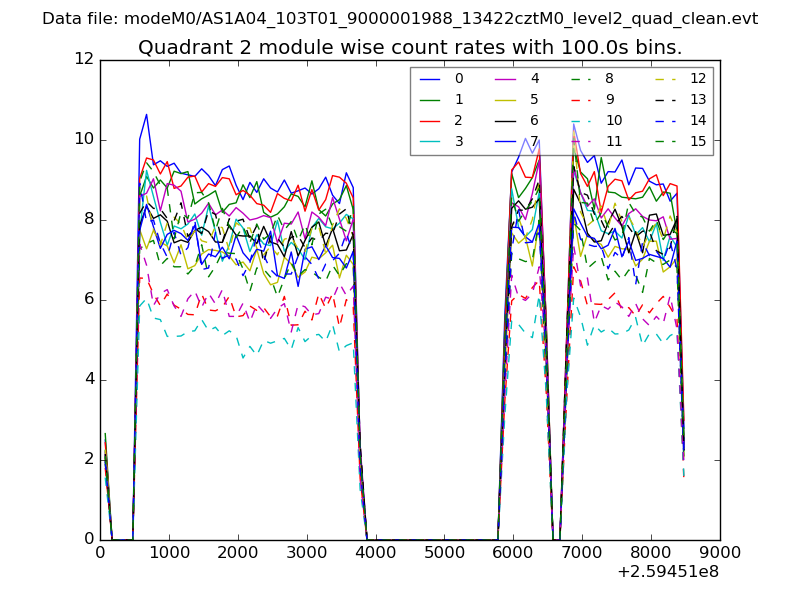
| Module-wise count rates for Quadrant B Data is divided into 100 sec bins |
 |
 |
| Module-wise count rates for Quadrant C Data is divided into 100 sec bins |
 |
 |
| Module-wise count rates for Quadrant D Data is divided into 100 sec bins |
 |
 |
| Parameter | Plot |
|---|---|
| CZT HV Monitor | 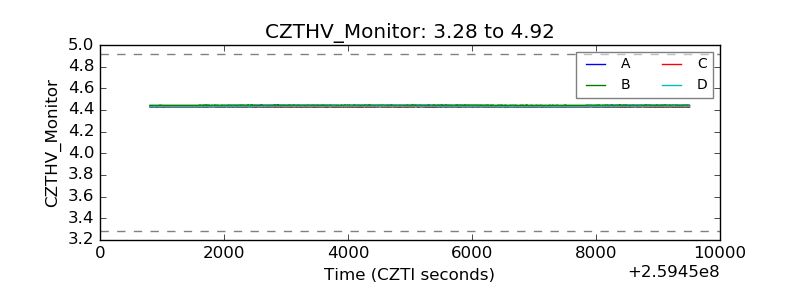 |
| D_VDD | 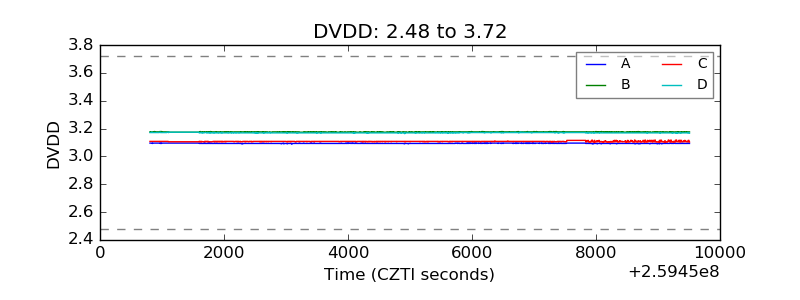 |
| Temperature 1 | 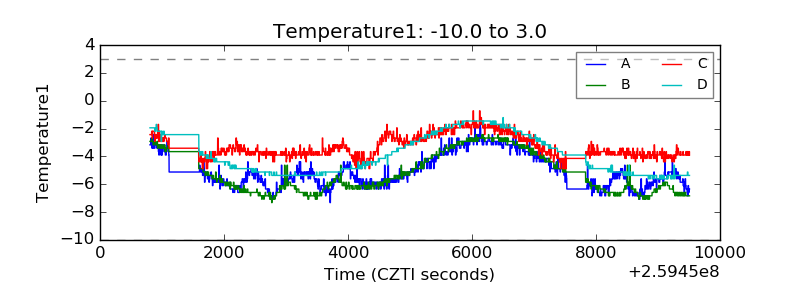 |
| Veto HV Monitor |  |
| Veto LLD | 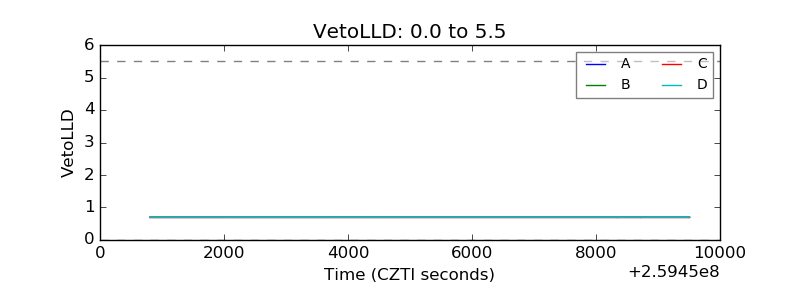 |
| Alpha Counter | 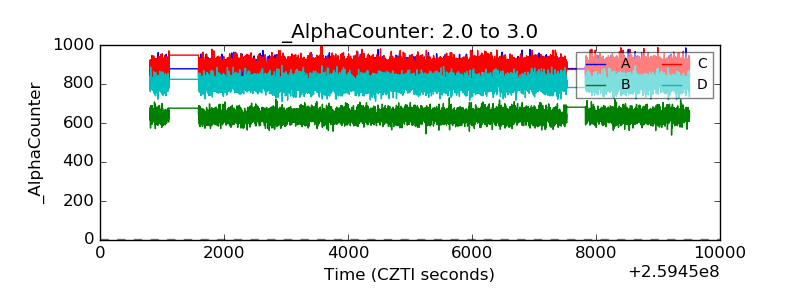 |
| _CPM_Rate | 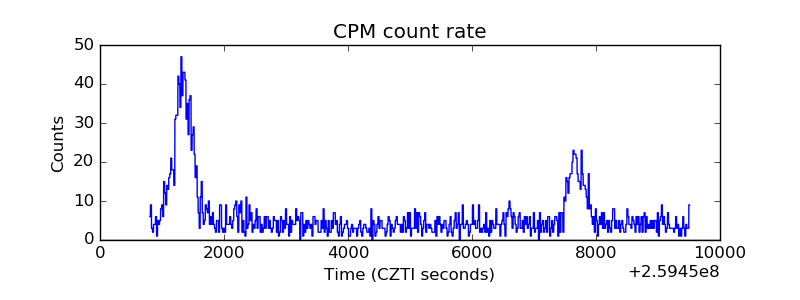 |
| CZT Counter | 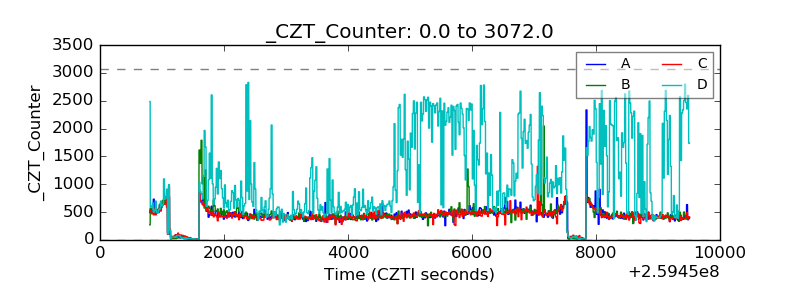 |
| +2.5 Volts monitor |  |
| +5 Volts monitor |  |
| _ROLL_ROT | 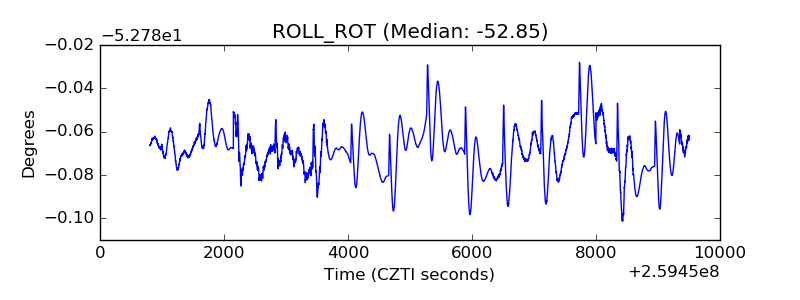 |
| _Roll_DEC | 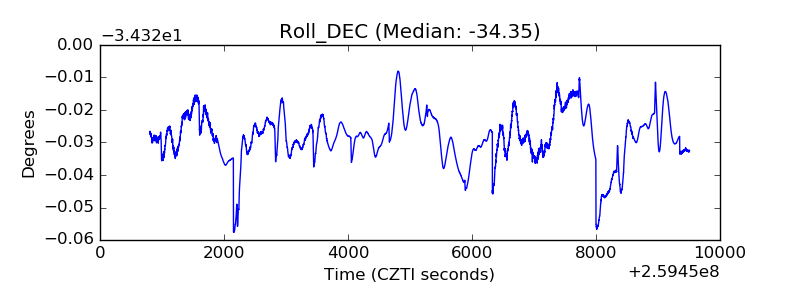 |
| _Roll_RA | 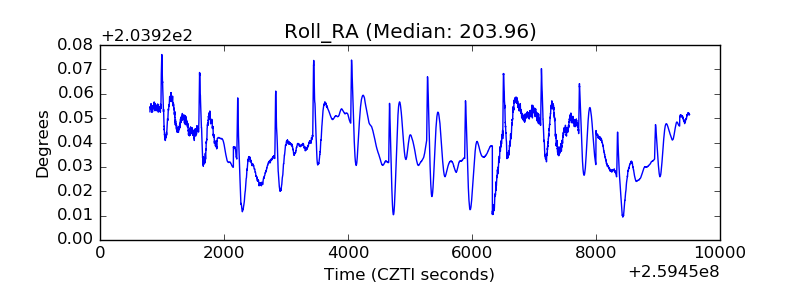 |
| Veto Counter | 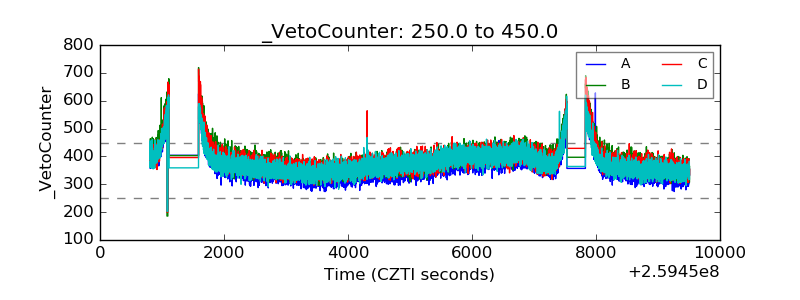 |