| Param | Original file | Final file |
|---|---|---|
| Filename | modeM0/AS1A04_103T01_9000001988_13423cztM0_level2.evt | modeM0/AS1A04_103T01_9000001988_13423cztM0_level2_quad_clean.evt |
| Size (bytes) | 686,197,440 | 104,483,520 |
| Size | 654.4 MB | 99.6 MB |
| Events in quadrant A | 3,521,266 | 676,402 |
| Events in quadrant B | 3,655,191 | 696,109 |
| Events in quadrant C | 3,542,298 | 674,156 |
| Events in quadrant D | 9,540,460 | 580,637 |
| Mode M0 | |||
|---|---|---|---|
| Quadrant | BADHDUFLAG | Total packets | Discarded packets |
| A | 0 | 15872 | 3 |
| B | 0 | 16116 | 2 |
| C | 0 | 15825 | 2 |
| D | 0 | 33779 | 2 |
| Mode SS | |||
|---|---|---|---|
| Quadrant | BADHDUFLAG | Total packets | Discarded packets |
| A | 0 | 160 | 0 |
| B | 0 | 160 | 0 |
| C | 0 | 160 | 0 |
| D | 0 | 160 | 0 |
| Mode M9 | |||
|---|---|---|---|
| Quadrant | BADHDUFLAG | Total packets | Discarded packets |
| A | 0 | 6 | 0 |
| B | 0 | 6 | 0 |
| C | 0 | 6 | 0 |
| D | 0 | 6 | 0 |
| Quadrant | Total seconds | Saturated seconds | Saturation percentage |
|---|---|---|---|
| A | 7705 | 19 | 0.246593% |
| B | 7705 | 51 | 0.661908% |
| C | 7705 | 26 | 0.337443% |
| D | 7705 | 2012 | 26.112914% |
Noise dominated data is calculated using 1-second bins in cleaned event files. If a bin has >2000 counts, and if more than 50% of those come from <1% of pixels, then it is considered to be noise-dominated and hence unusable.
| Quadrant | # 1 sec bins | Bins with >0 counts | Bins with >2000 counts | High rate bins dominated by noise | Noise dominated (total time) | Noise dominated (detector-on time) | Marked lightcurve |
|---|---|---|---|---|---|---|---|
| A | 8366 | 7707 | 2 | 2 | 0.02% | 0.03% | 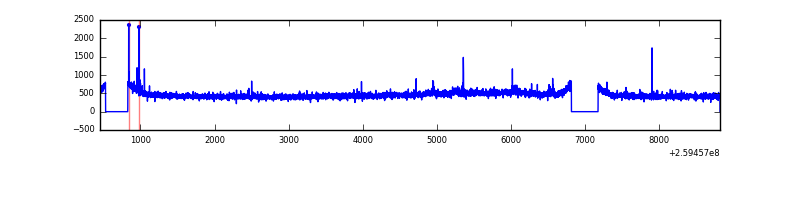 |
| B | 8366 | 7707 | 7 | 7 | 0.08% | 0.09% | 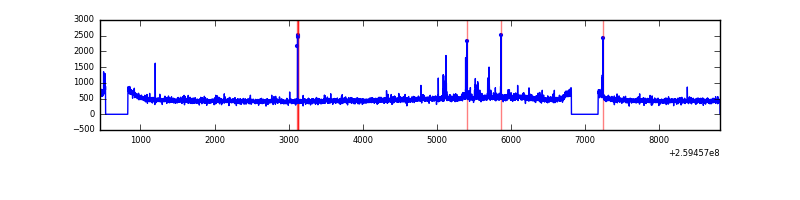 |
| C | 8366 | 7708 | 0 | 0 | 0.00% | 0.00% | 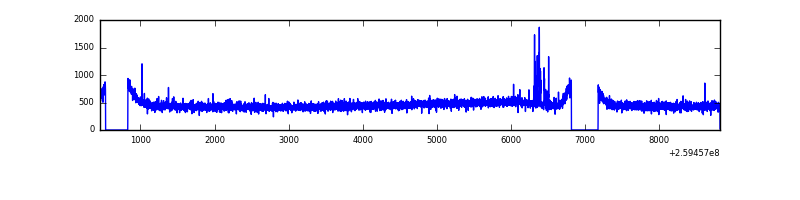 |
| D | 8366 | 7707 | 2029 | 2029 | 24.25% | 26.33% |  |
Top three noisy pixels from each quadrant. If the there are fewer than three noisy pixels in the level2.evt file, extra rows are filled as -1
| Pixel properties | Quadrant properties | ||||||
|---|---|---|---|---|---|---|---|
| Quadrant | DetID | PixID | Counts | Sigma | Mean | Median | Sigma |
| A | 15 | 69 | 20775 | 107.28 | 899 | 880 | 185.5 |
| A | 8 | 15 | 20052 | 103.38 | 899 | 880 | 185.5 |
| A | 1 | 162 | 17442 | 89.31 | 899 | 880 | 185.5 |
| B | 4 | 142 | 52196 | 293.98 | 907 | 882 | 174.5 |
| B | 12 | 111 | 21047 | 115.52 | 907 | 882 | 174.5 |
| B | 11 | 111 | 17423 | 94.76 | 907 | 882 | 174.5 |
| C | 3 | 233 | 45379 | 217.1 | 881 | 885 | 205.0 |
| C | 14 | 220 | 37208 | 177.23 | 881 | 885 | 205.0 |
| C | 8 | 128 | 12899 | 58.62 | 881 | 885 | 205.0 |
| D | 13 | 249 | 5194517 | 27254.89 | 794 | 771 | 190.6 |
| D | 1 | 52 | 986058 | 5170.43 | 794 | 771 | 190.6 |
| D | 2 | 136 | 227095 | 1187.67 | 794 | 771 | 190.6 |
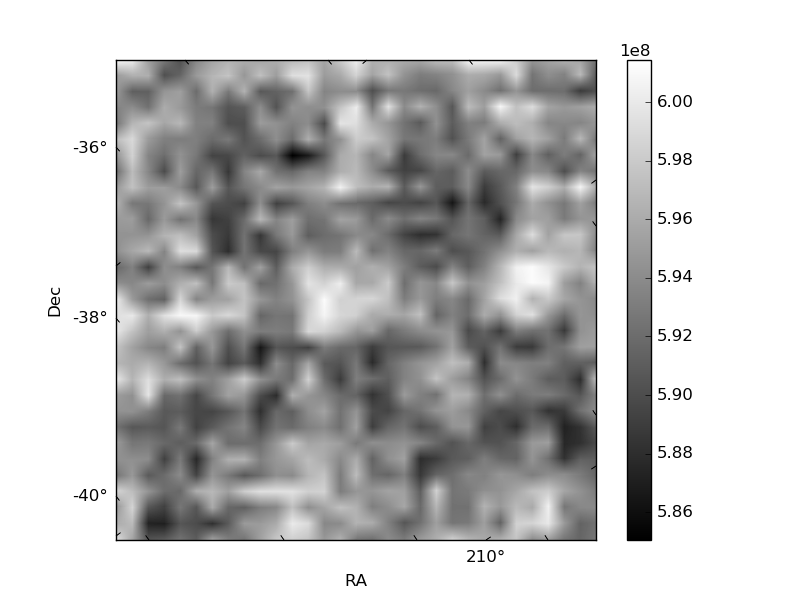
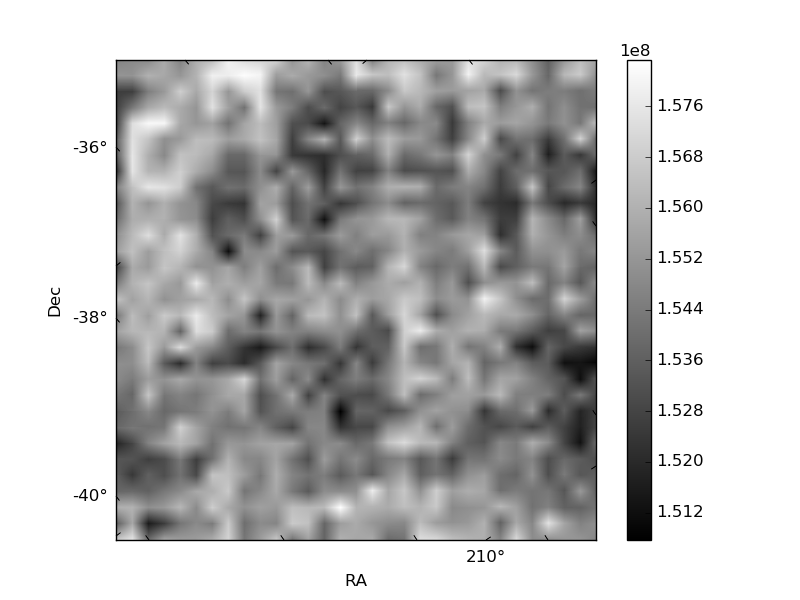
Histogram calculated using DETX and DETY for each event in the final _common_clean file
| Quadrant A |  |
 |
Quadrant B |
|---|---|---|---|
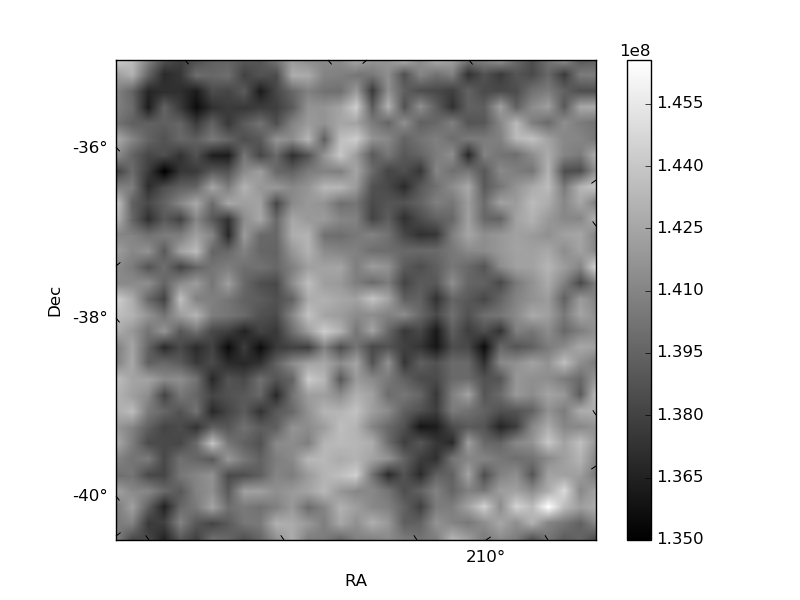
| Quadrant D |  |
 |
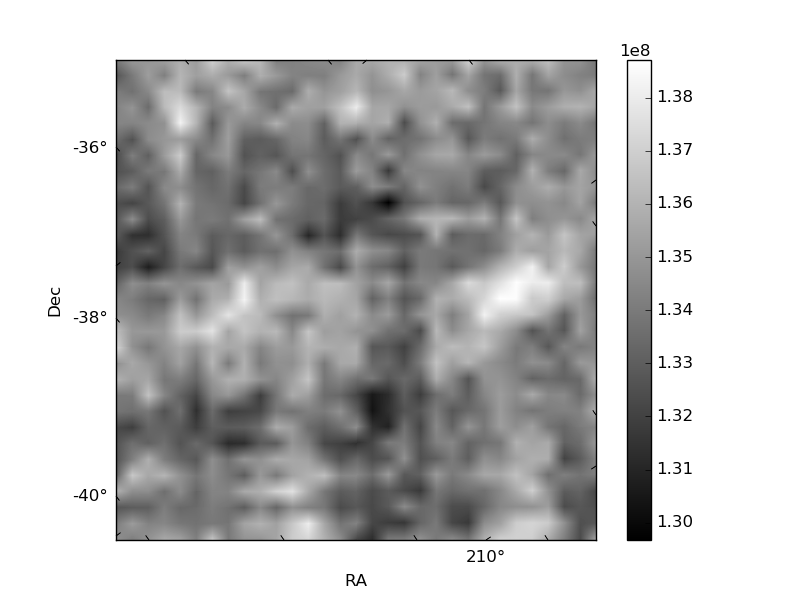
Quadrant C |
| Plot type | Count rate plots | Images |
|---|---|---|
| Comparison with Poisson distribution Blue bars denote a histogram of data divided into 1 sec bins. Red curve is a Poisson curve with rate = median count rate of data. |
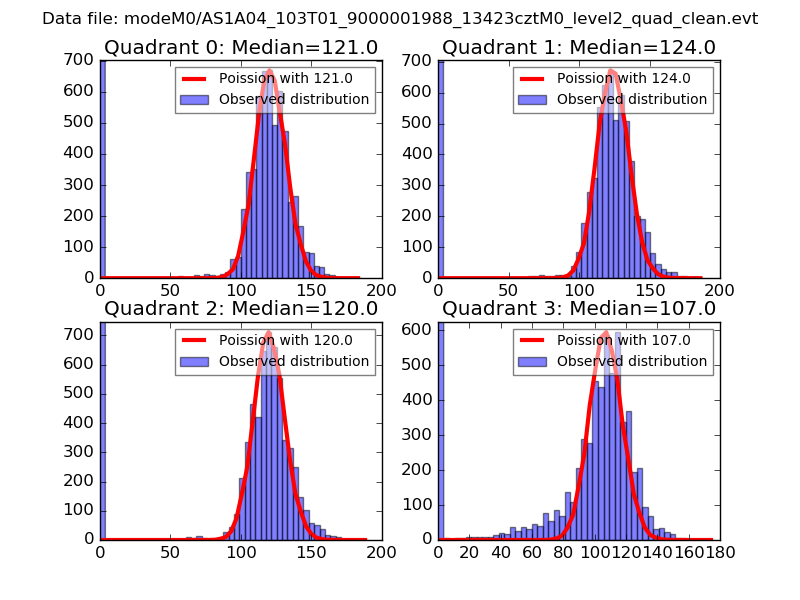 |
 |
| Quadrant-wise count rates Data is divided into 100 sec bins |
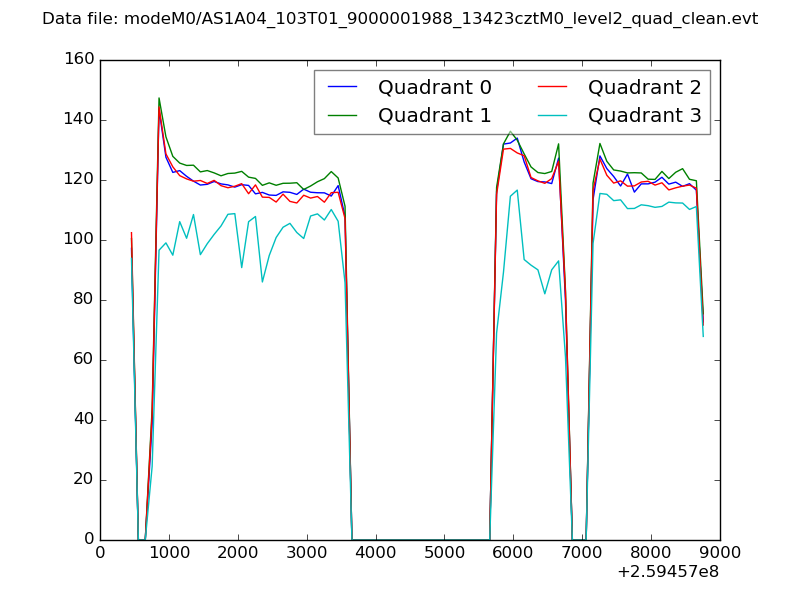 |
|
| Module-wise count rates for Quadrant A Data is divided into 100 sec bins |
 |
 |
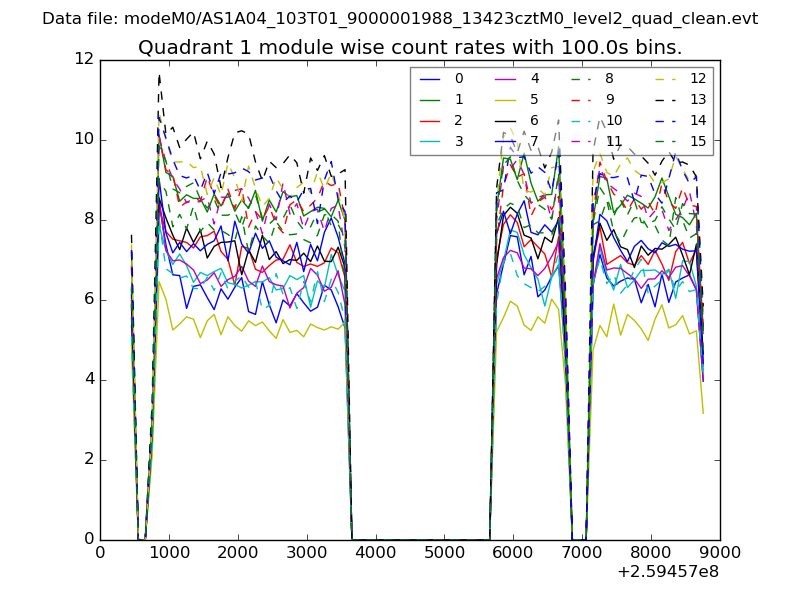
| Module-wise count rates for Quadrant B Data is divided into 100 sec bins |
 |
 |
| Module-wise count rates for Quadrant C Data is divided into 100 sec bins |
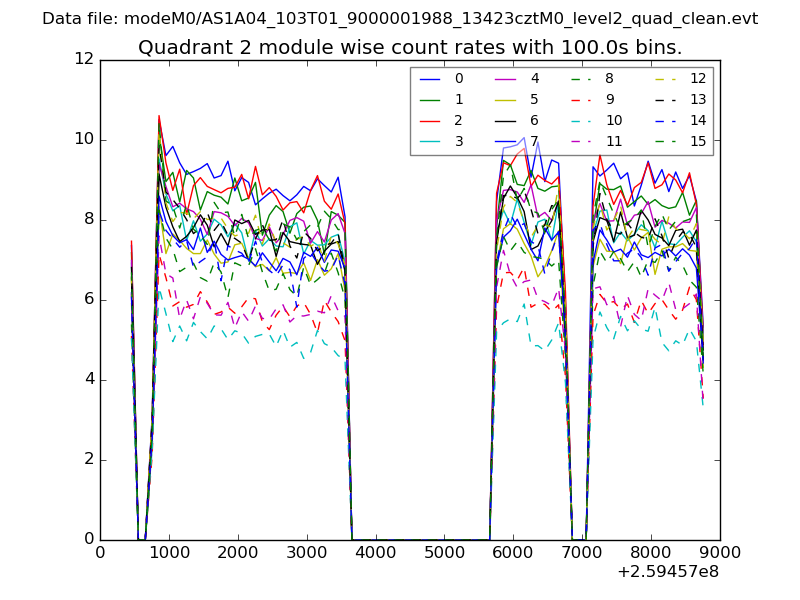 |
 |
| Module-wise count rates for Quadrant D Data is divided into 100 sec bins |
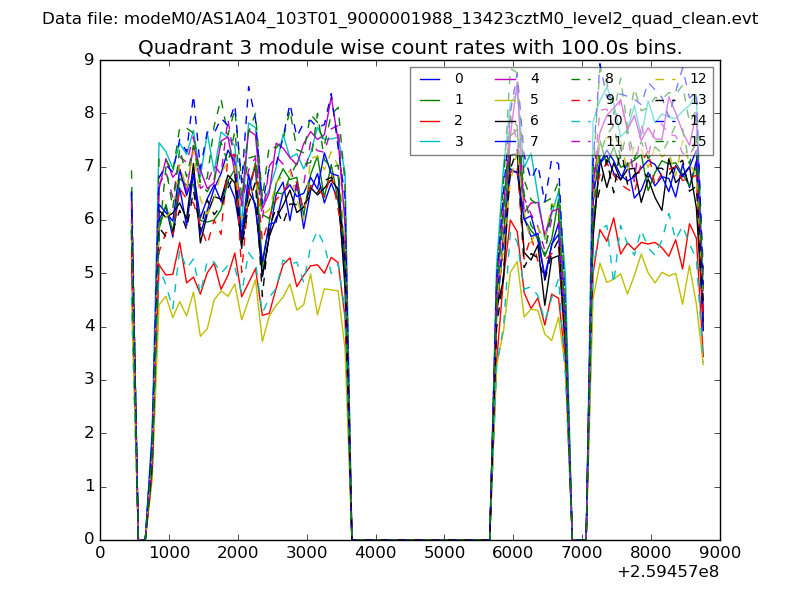 |
 |
| Parameter | Plot |
|---|---|
| CZT HV Monitor | 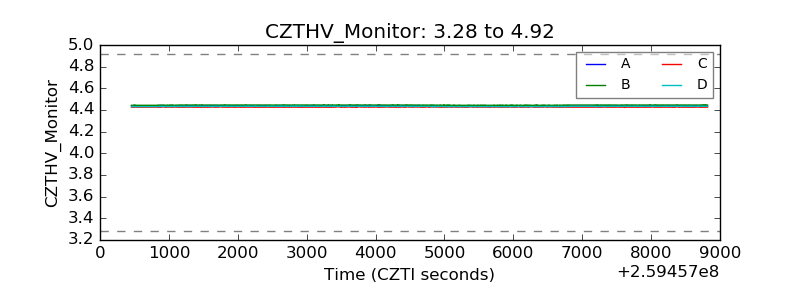 |
| D_VDD | 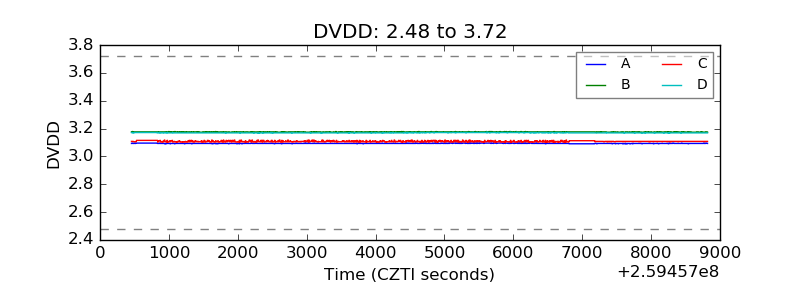 |
| Temperature 1 | 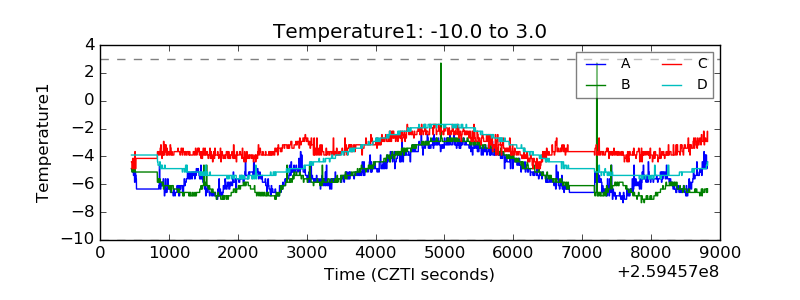 |
| Veto HV Monitor | 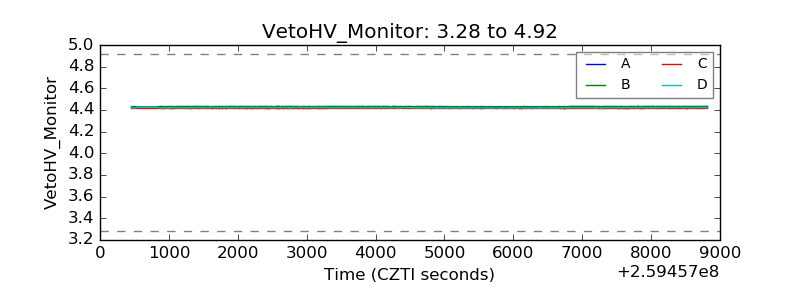 |
| Veto LLD | 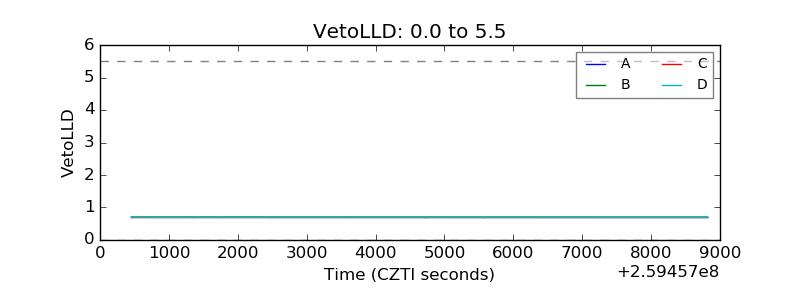 |
| Alpha Counter | 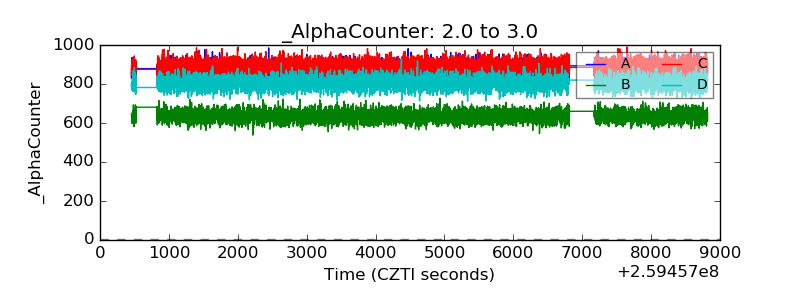 |
| _CPM_Rate | 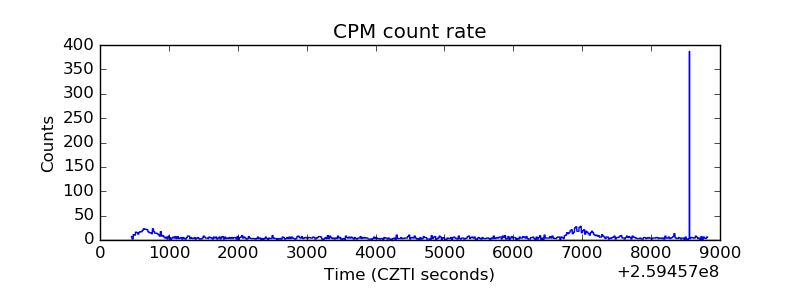 |
| CZT Counter |  |
| +2.5 Volts monitor |  |
| +5 Volts monitor |  |
| _ROLL_ROT | 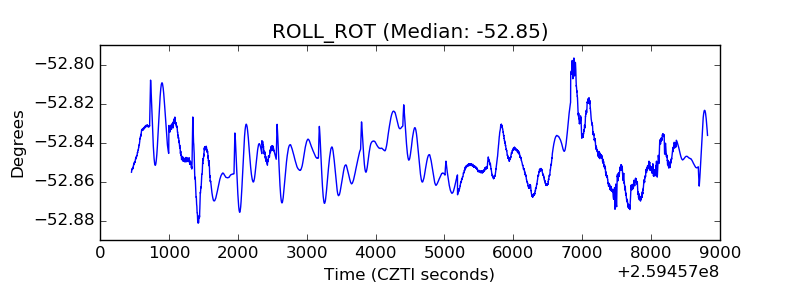 |
| _Roll_DEC | 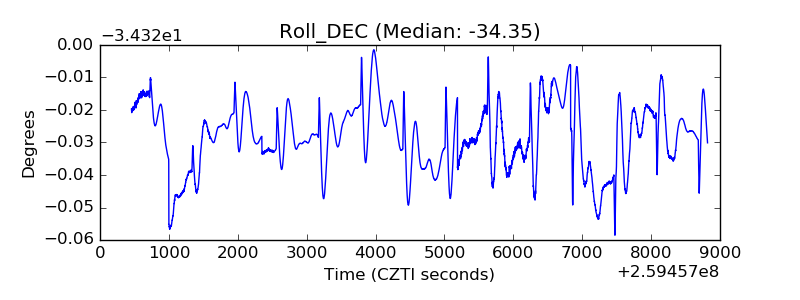 |
| _Roll_RA | 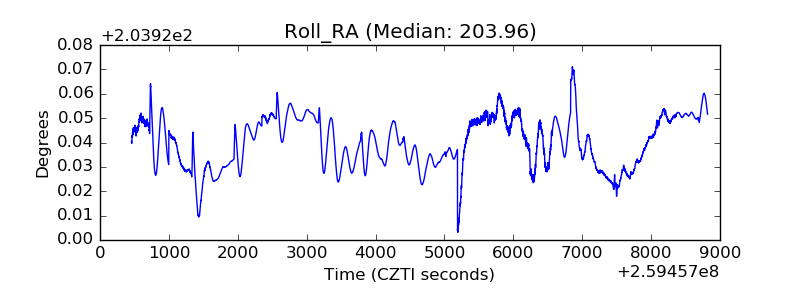 |
| Veto Counter | 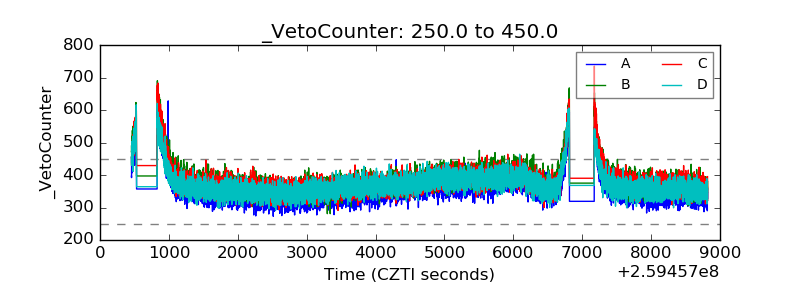 |