| Param | Original file | Final file |
|---|---|---|
| Filename | modeM0/AS1A04_103T01_9000001988_13425cztM0_level2.evt | modeM0/AS1A04_103T01_9000001988_13425cztM0_level2_quad_clean.evt |
| Size (bytes) | 928,851,840 | 160,081,920 |
| Size | 885.8 MB | 152.7 MB |
| Events in quadrant A | 5,655,563 | 1,016,040 |
| Events in quadrant B | 5,812,431 | 1,038,421 |
| Events in quadrant C | 5,745,320 | 1,006,134 |
| Events in quadrant D | 10,068,446 | 920,688 |
| Mode M0 | |||
|---|---|---|---|
| Quadrant | BADHDUFLAG | Total packets | Discarded packets |
| A | 0 | 25419 | 3 |
| B | 0 | 25564 | 2 |
| C | 0 | 25511 | 2 |
| D | 0 | 38421 | 2 |
| Mode SS | |||
|---|---|---|---|
| Quadrant | BADHDUFLAG | Total packets | Discarded packets |
| A | 0 | 256 | 0 |
| B | 0 | 256 | 0 |
| C | 0 | 256 | 0 |
| D | 0 | 256 | 0 |
| Mode M9 | |||
|---|---|---|---|
| Quadrant | BADHDUFLAG | Total packets | Discarded packets |
| A | 0 | 10 | 0 |
| B | 0 | 10 | 0 |
| C | 0 | 10 | 0 |
| D | 0 | 10 | 0 |
| Quadrant | Total seconds | Saturated seconds | Saturation percentage |
|---|---|---|---|
| A | 12530 | 123 | 0.981644% |
| B | 12530 | 143 | 1.141261% |
| C | 12530 | 116 | 0.925778% |
| D | 12530 | 1339 | 10.686353% |
Noise dominated data is calculated using 1-second bins in cleaned event files. If a bin has >2000 counts, and if more than 50% of those come from <1% of pixels, then it is considered to be noise-dominated and hence unusable.
| Quadrant | # 1 sec bins | Bins with >0 counts | Bins with >2000 counts | High rate bins dominated by noise | Noise dominated (total time) | Noise dominated (detector-on time) | Marked lightcurve |
|---|---|---|---|---|---|---|---|
| A | 13611 | 12531 | 1 | 1 | 0.01% | 0.01% | 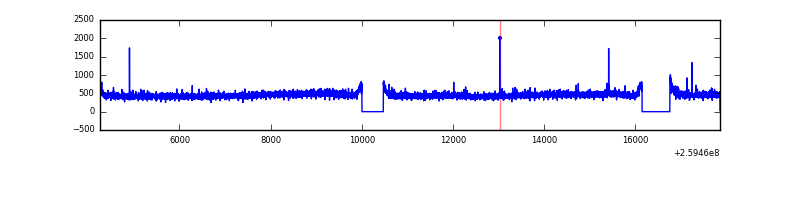 |
| B | 13611 | 12531 | 0 | 0 | 0.00% | 0.00% | 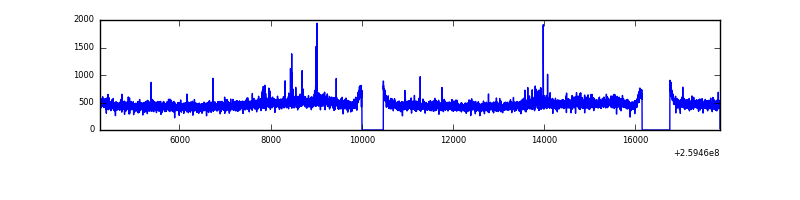 |
| C | 13611 | 12531 | 1 | 1 | 0.01% | 0.01% | 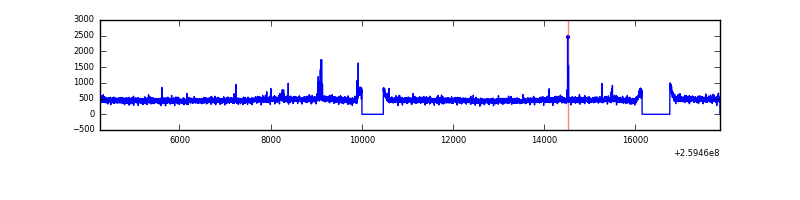 |
| D | 13611 | 12531 | 1264 | 1264 | 9.29% | 10.09% | 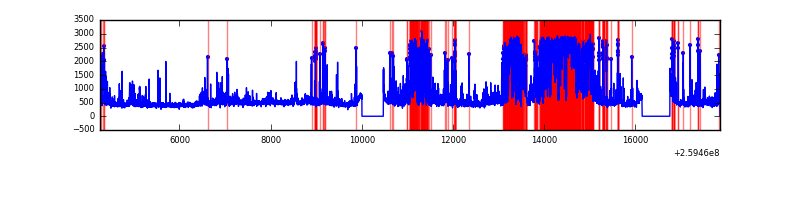 |
Top three noisy pixels from each quadrant. If the there are fewer than three noisy pixels in the level2.evt file, extra rows are filled as -1
| Pixel properties | Quadrant properties | ||||||
|---|---|---|---|---|---|---|---|
| Quadrant | DetID | PixID | Counts | Sigma | Mean | Median | Sigma |
| A | 1 | 162 | 23316 | 73.38 | 1461 | 1427 | 298.3 |
| A | 0 | 226 | 12984 | 38.74 | 1461 | 1427 | 298.3 |
| A | 12 | 194 | 11151 | 32.6 | 1461 | 1427 | 298.3 |
| B | 0 | 230 | 36448 | 124.9 | 1467 | 1429 | 280.4 |
| B | 4 | 142 | 35594 | 121.85 | 1467 | 1429 | 280.4 |
| B | 12 | 111 | 33722 | 115.17 | 1467 | 1429 | 280.4 |
| C | 3 | 233 | 110210 | 329.05 | 1430 | 1434 | 330.6 |
| C | 14 | 220 | 33253 | 96.25 | 1430 | 1434 | 330.6 |
| C | 14 | 234 | 23521 | 66.81 | 1430 | 1434 | 330.6 |
| D | 1 | 52 | 3525442 | 10795.13 | 1355 | 1319 | 326.5 |
| D | 13 | 249 | 912890 | 2792.33 | 1355 | 1319 | 326.5 |
| D | 8 | 195 | 435960 | 1331.4 | 1355 | 1319 | 326.5 |
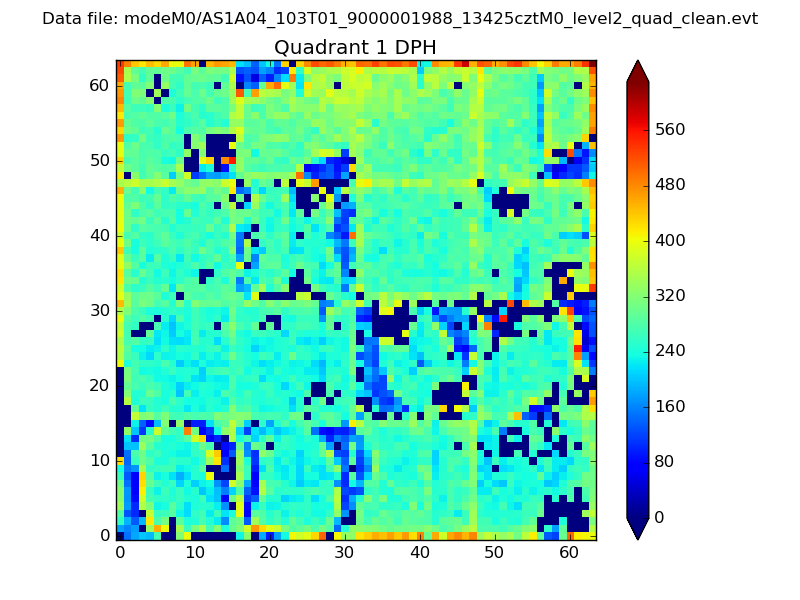
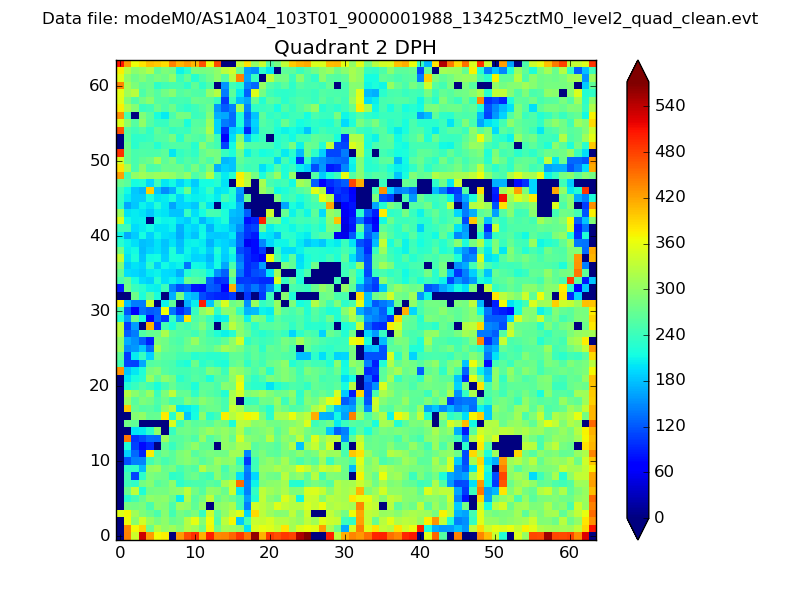
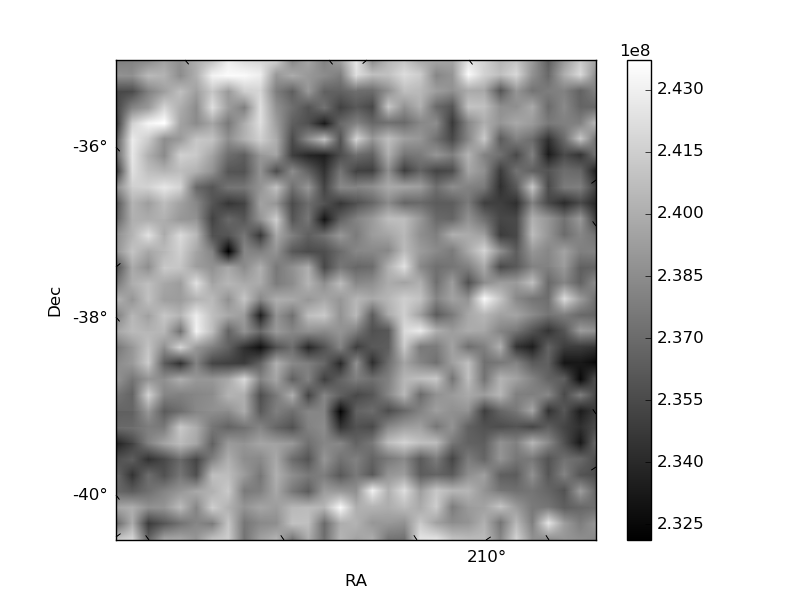
Histogram calculated using DETX and DETY for each event in the final _common_clean file
| Quadrant A |  |
 |
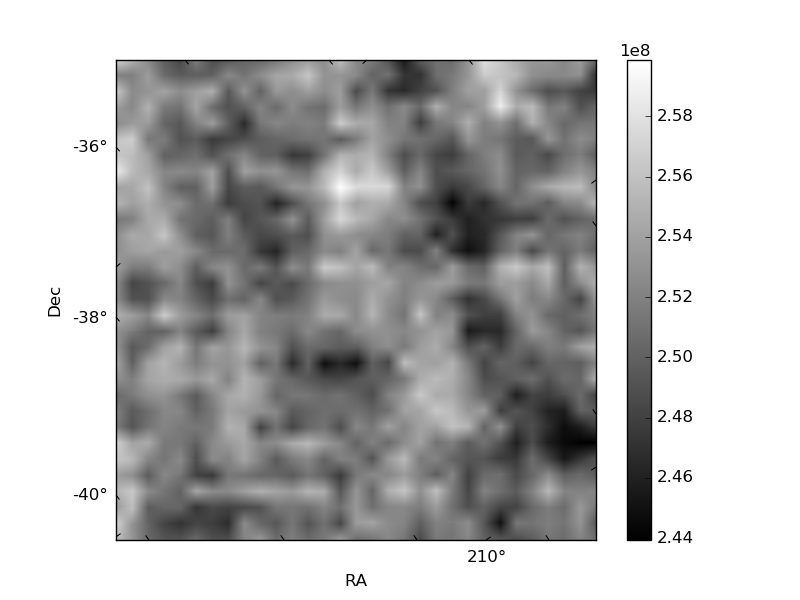
Quadrant B |
|---|---|---|---|
| Quadrant D |  |
 |
Quadrant C |
| Plot type | Count rate plots | Images |
|---|---|---|
| Comparison with Poisson distribution Blue bars denote a histogram of data divided into 1 sec bins. Red curve is a Poisson curve with rate = median count rate of data. |
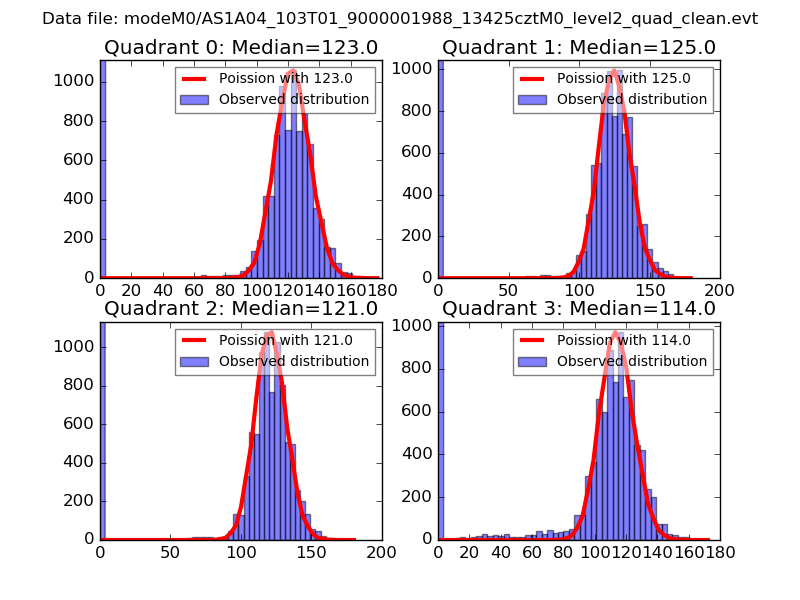 |
 |
| Quadrant-wise count rates Data is divided into 100 sec bins |
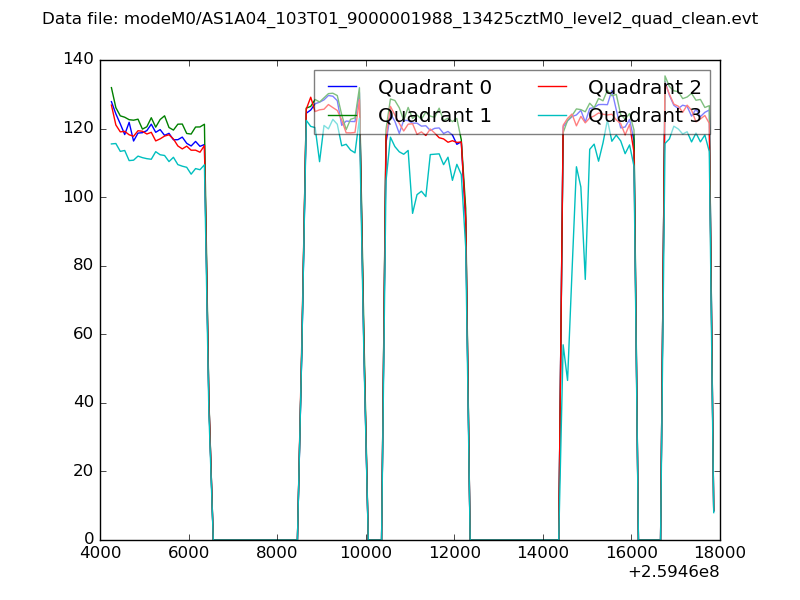 |
|
| Module-wise count rates for Quadrant A Data is divided into 100 sec bins |
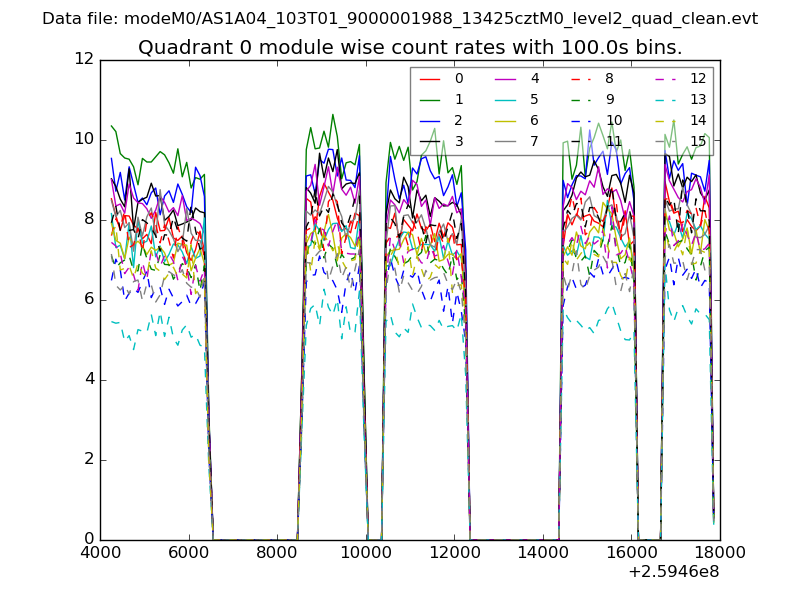 |
 |
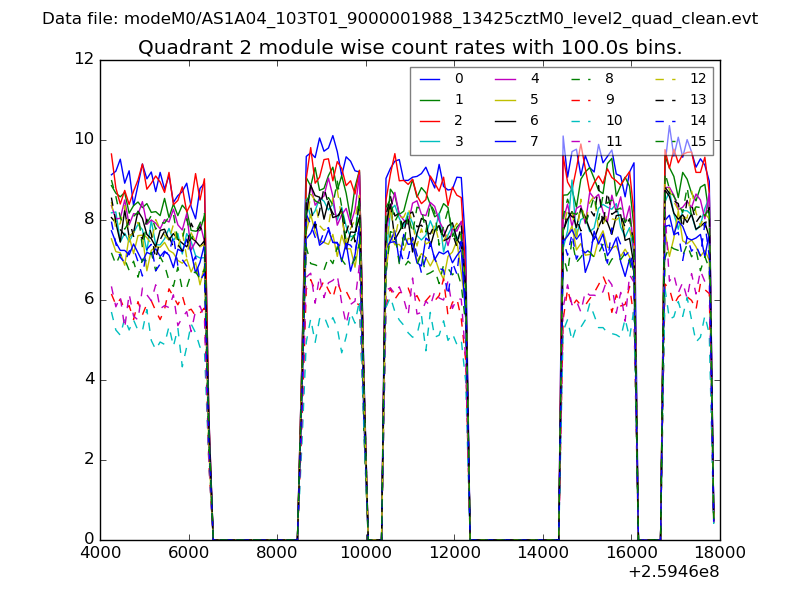
| Module-wise count rates for Quadrant B Data is divided into 100 sec bins |
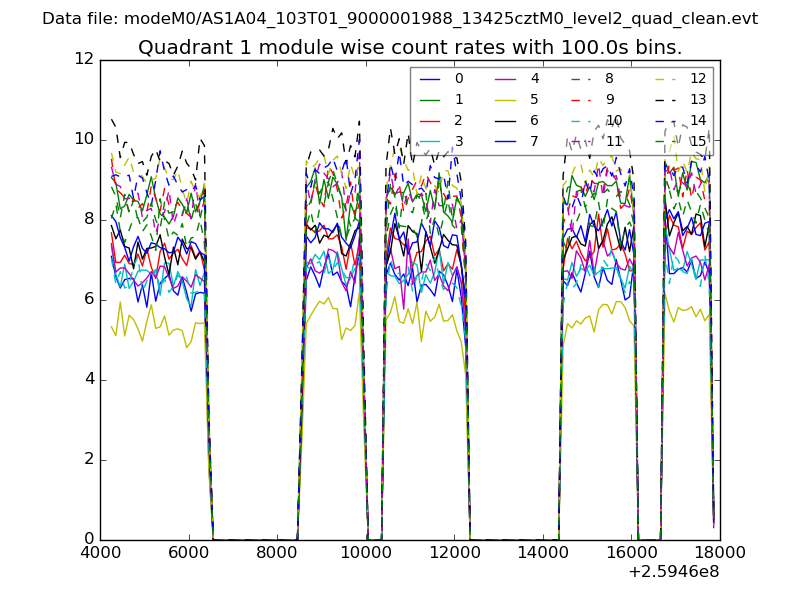 |
 |
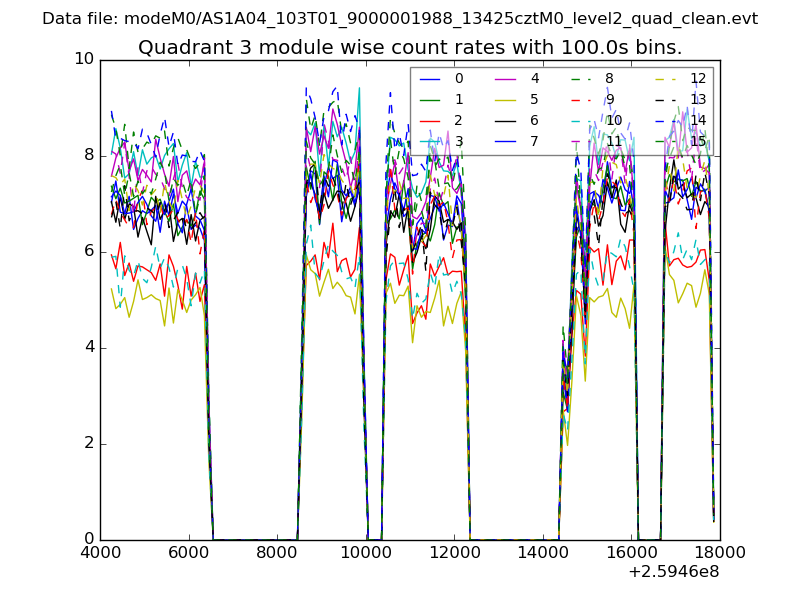
| Module-wise count rates for Quadrant C Data is divided into 100 sec bins |
 |
 |
| Module-wise count rates for Quadrant D Data is divided into 100 sec bins |
 |
 |
| Parameter | Plot |
|---|---|
| CZT HV Monitor | 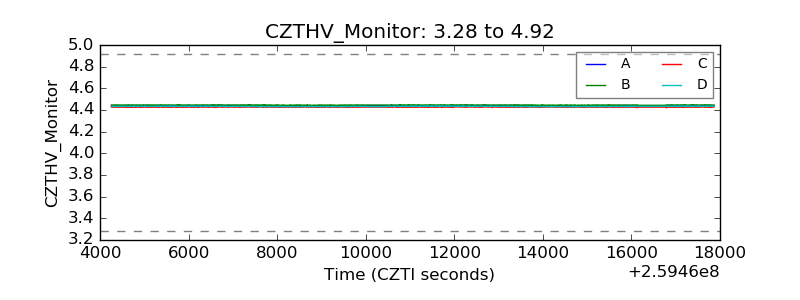 |
| D_VDD | 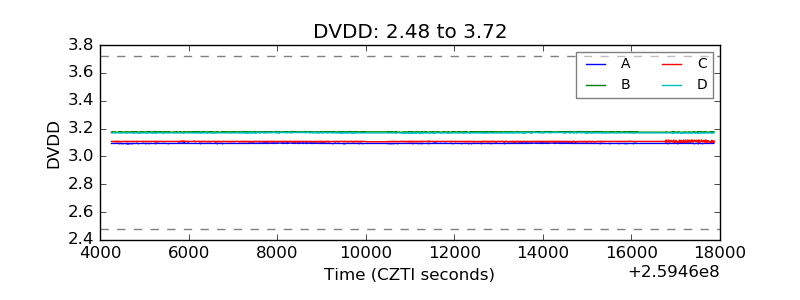 |
| Temperature 1 | 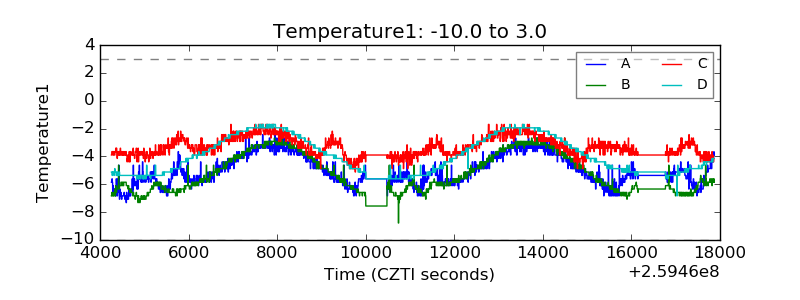 |
| Veto HV Monitor | 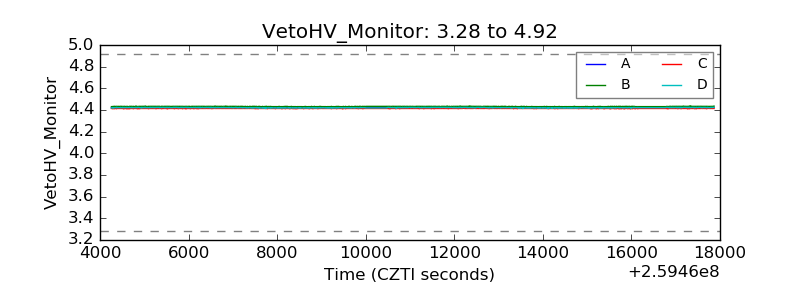 |
| Veto LLD | 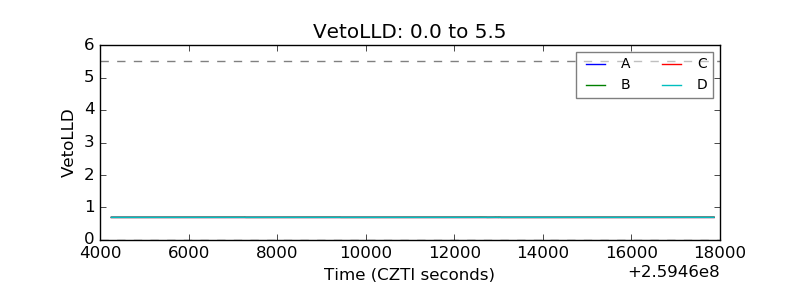 |
| Alpha Counter | 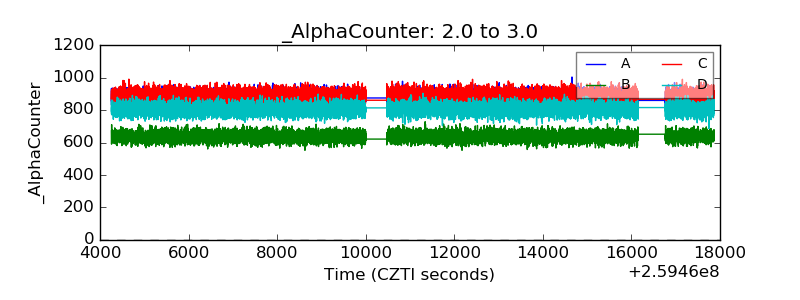 |
| _CPM_Rate | 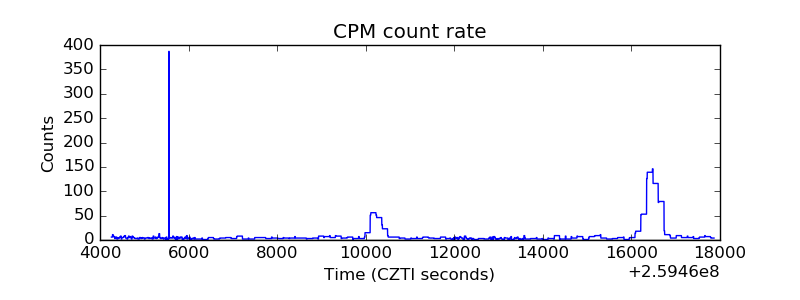 |
| CZT Counter | 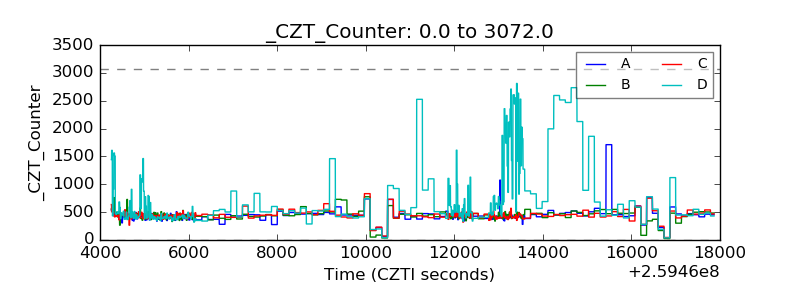 |
| +2.5 Volts monitor |  |
| +5 Volts monitor |  |
| _ROLL_ROT | 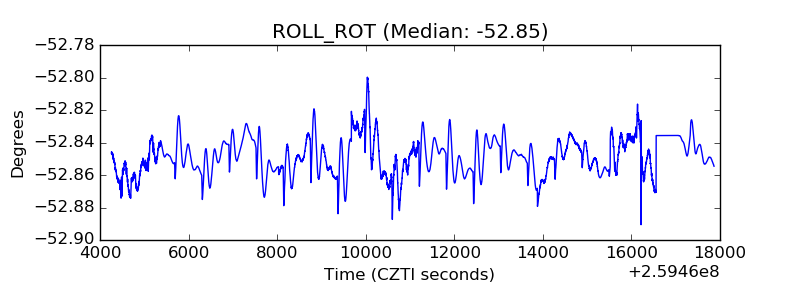 |
| _Roll_DEC | 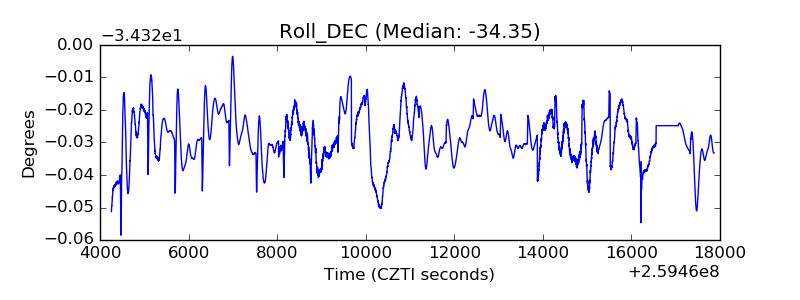 |
| _Roll_RA |  |
| Veto Counter | 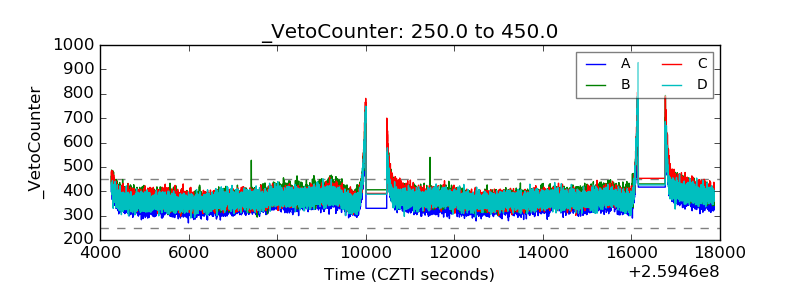 |