| Param | Original file | Final file |
|---|---|---|
| Filename | modeM0/AS1A04_103T01_9000001988_13426cztM0_level2.evt | modeM0/AS1A04_103T01_9000001988_13426cztM0_level2_quad_clean.evt |
| Size (bytes) | 536,820,480 | 75,758,400 |
| Size | 512.0 MB | 72.2 MB |
| Events in quadrant A | 2,974,457 | 485,671 |
| Events in quadrant B | 3,097,509 | 497,565 |
| Events in quadrant C | 2,991,844 | 485,012 |
| Events in quadrant D | 6,754,502 | 374,083 |
| Mode M0 | |||
|---|---|---|---|
| Quadrant | BADHDUFLAG | Total packets | Discarded packets |
| A | 0 | 13135 | 2 |
| B | 0 | 13395 | 1 |
| C | 0 | 13181 | 1 |
| D | 0 | 24276 | 1 |
| Mode SS | |||
|---|---|---|---|
| Quadrant | BADHDUFLAG | Total packets | Discarded packets |
| A | 0 | 132 | 0 |
| B | 0 | 132 | 0 |
| C | 0 | 132 | 0 |
| D | 0 | 132 | 0 |
| Mode M9 | |||
|---|---|---|---|
| Quadrant | BADHDUFLAG | Total packets | Discarded packets |
| A | 0 | 8 | 0 |
| B | 0 | 8 | 0 |
| C | 0 | 8 | 0 |
| D | 0 | 8 | 0 |
| Quadrant | Total seconds | Saturated seconds | Saturation percentage |
|---|---|---|---|
| A | 6466 | 51 | 0.788741% |
| B | 6466 | 80 | 1.237241% |
| C | 6466 | 53 | 0.819672% |
| D | 6466 | 1484 | 22.950820% |
Noise dominated data is calculated using 1-second bins in cleaned event files. If a bin has >2000 counts, and if more than 50% of those come from <1% of pixels, then it is considered to be noise-dominated and hence unusable.
| Quadrant | # 1 sec bins | Bins with >0 counts | Bins with >2000 counts | High rate bins dominated by noise | Noise dominated (total time) | Noise dominated (detector-on time) | Marked lightcurve |
|---|---|---|---|---|---|---|---|
| A | 7272 | 6467 | 0 | 0 | 0.00% | 0.00% | 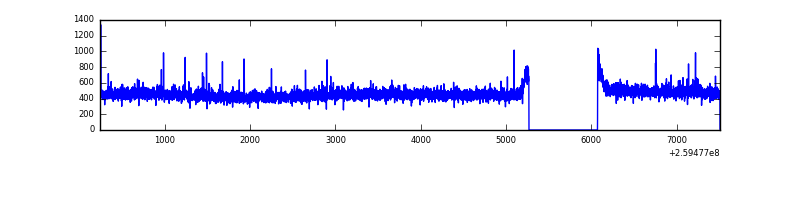 |
| B | 7272 | 6467 | 15 | 15 | 0.21% | 0.23% | 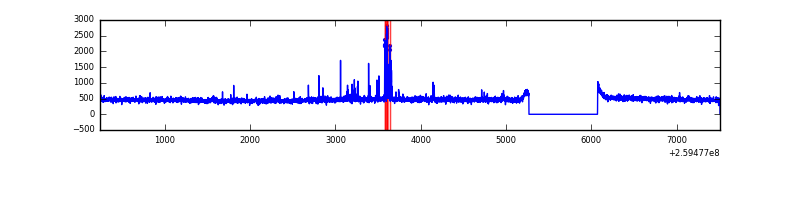 |
| C | 7272 | 6467 | 7 | 7 | 0.10% | 0.11% | 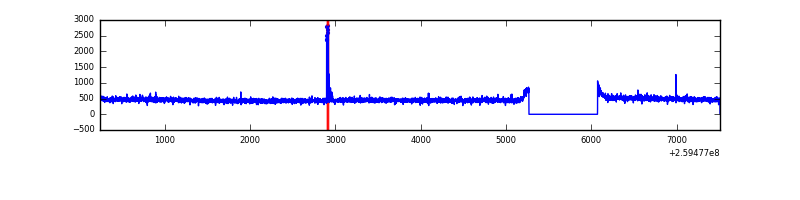 |
| D | 7271 | 6466 | 1426 | 1426 | 19.61% | 22.05% |  |
Top three noisy pixels from each quadrant. If the there are fewer than three noisy pixels in the level2.evt file, extra rows are filled as -1
| Pixel properties | Quadrant properties | ||||||
|---|---|---|---|---|---|---|---|
| Quadrant | DetID | PixID | Counts | Sigma | Mean | Median | Sigma |
| A | 1 | 162 | 22531 | 139.64 | 763 | 745 | 156.0 |
| A | 1 | 178 | 7083 | 40.62 | 763 | 745 | 156.0 |
| A | 0 | 226 | 6791 | 38.75 | 763 | 745 | 156.0 |
| B | 4 | 142 | 95436 | 646.14 | 762 | 742 | 146.6 |
| B | 12 | 111 | 17273 | 112.8 | 762 | 742 | 146.6 |
| B | 11 | 111 | 14819 | 96.05 | 762 | 742 | 146.6 |
| C | 14 | 234 | 30739 | 173.18 | 746 | 749 | 173.2 |
| C | 3 | 233 | 26270 | 147.37 | 746 | 749 | 173.2 |
| C | 8 | 128 | 11271 | 60.76 | 746 | 749 | 173.2 |
| D | 1 | 52 | 3971599 | 26680.86 | 612 | 595 | 148.8 |
| D | 13 | 249 | 202265 | 1355.0 | 612 | 595 | 148.8 |
| D | 8 | 195 | 199975 | 1339.62 | 612 | 595 | 148.8 |
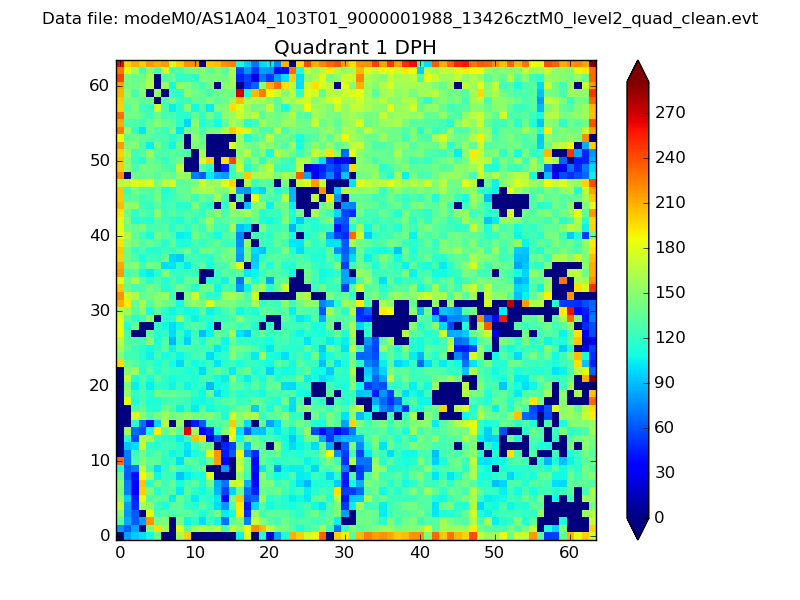
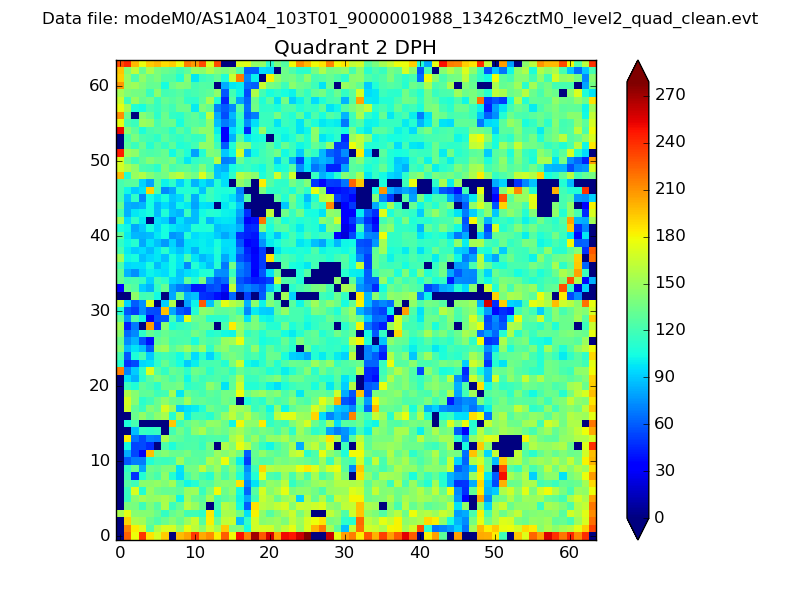
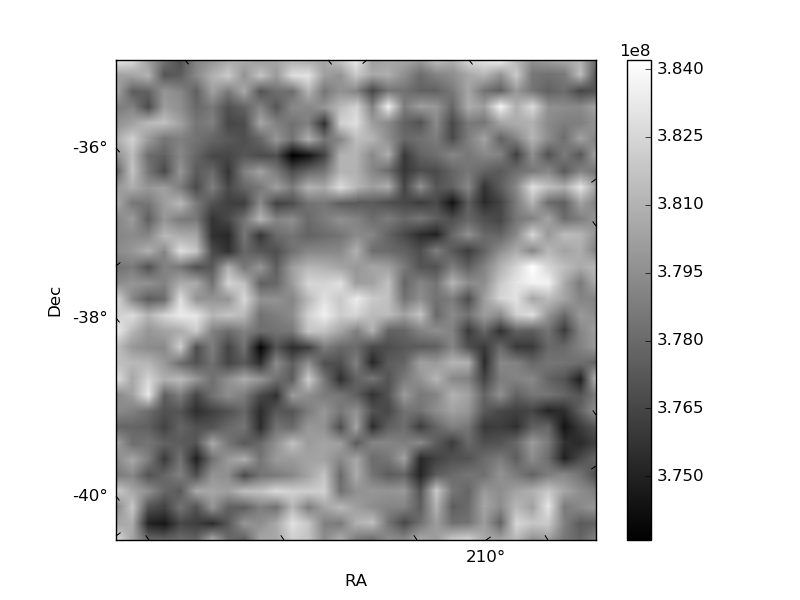
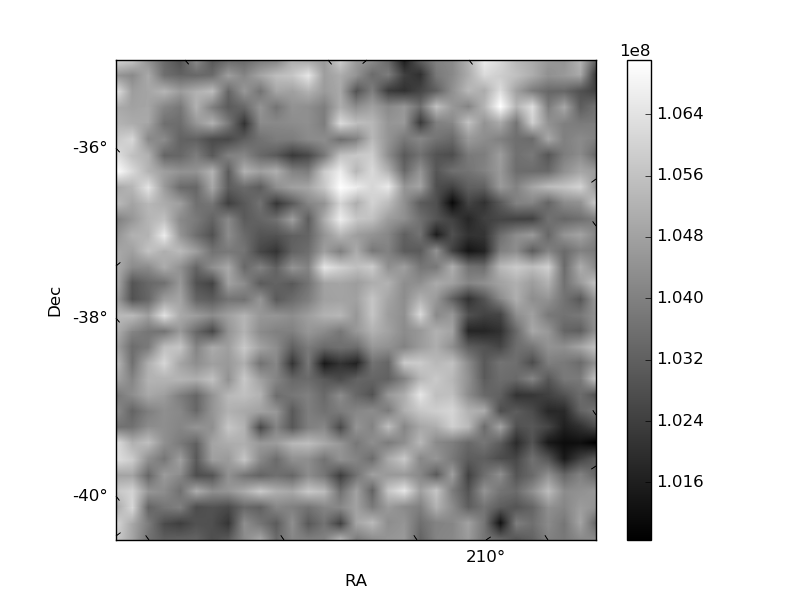
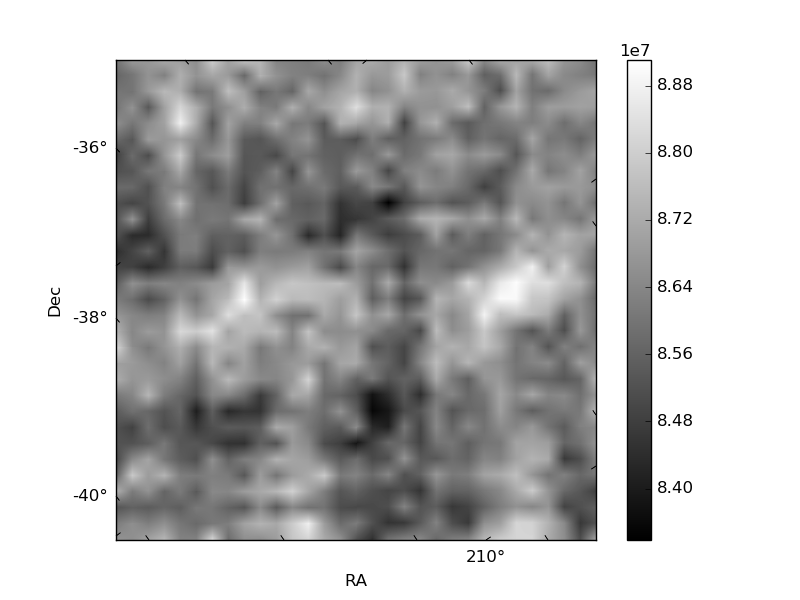
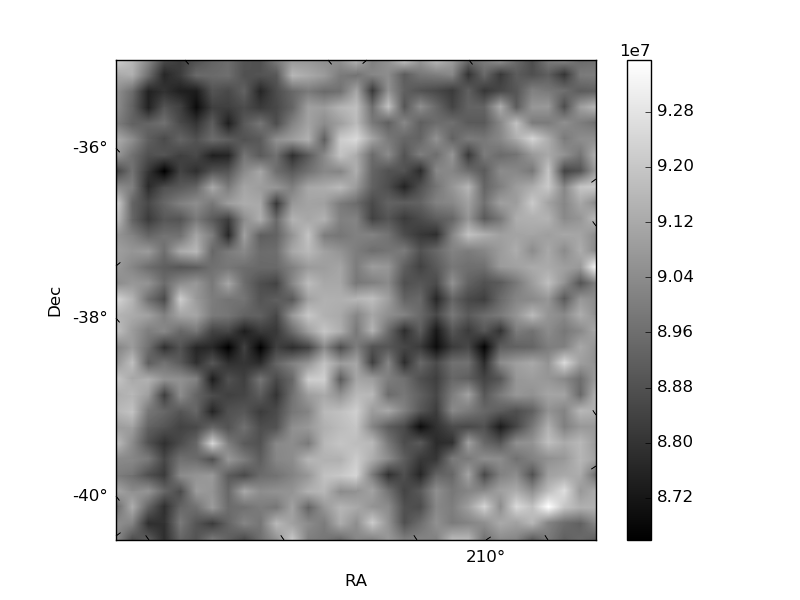
Histogram calculated using DETX and DETY for each event in the final _common_clean file
| Quadrant A | 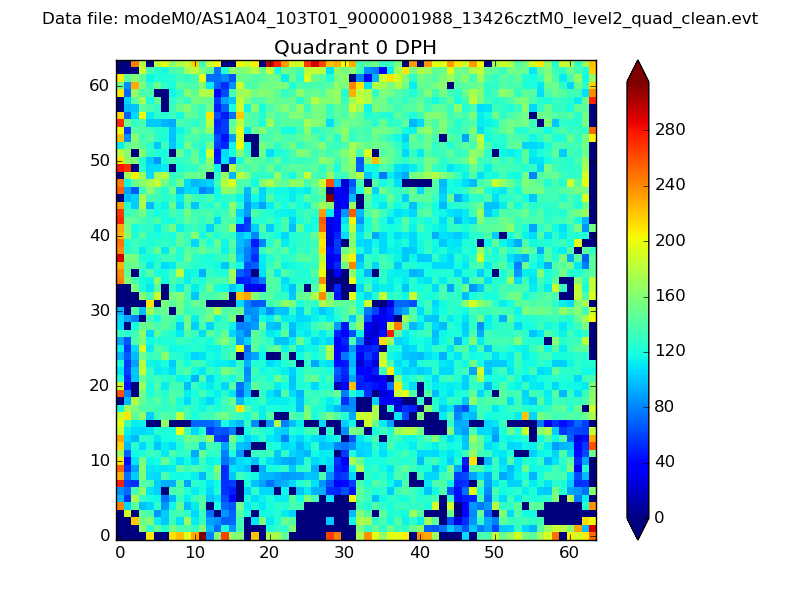 |
 |
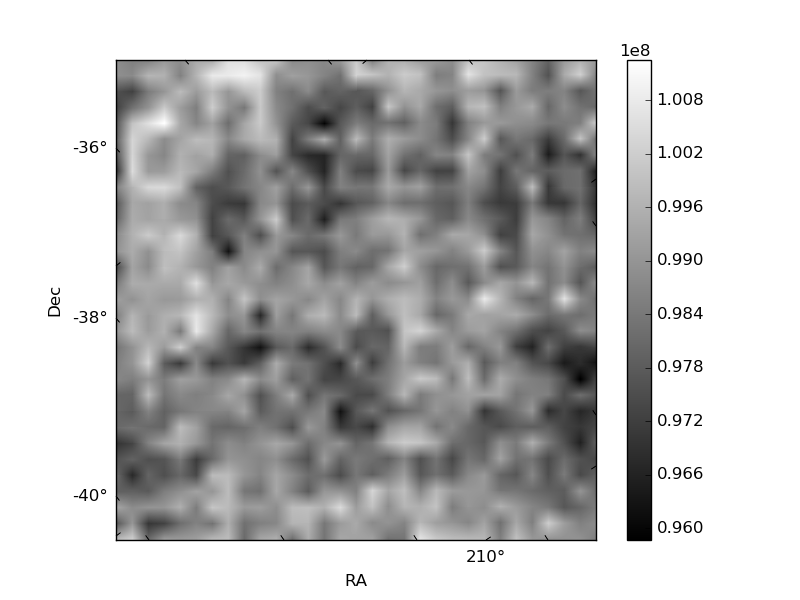
Quadrant B |
|---|---|---|---|
| Quadrant D | 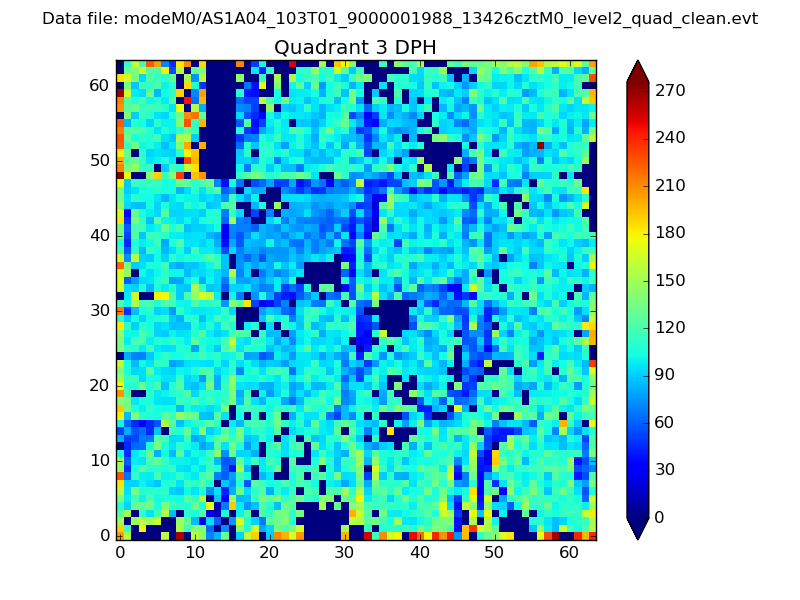 |
 |
Quadrant C |
| Plot type | Count rate plots | Images |
|---|---|---|
| Comparison with Poisson distribution Blue bars denote a histogram of data divided into 1 sec bins. Red curve is a Poisson curve with rate = median count rate of data. |
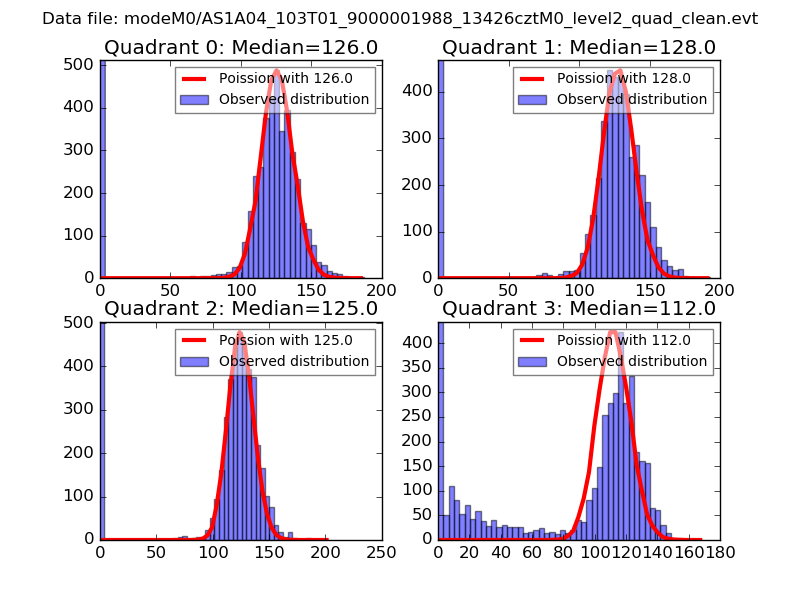 |
 |
| Quadrant-wise count rates Data is divided into 100 sec bins |
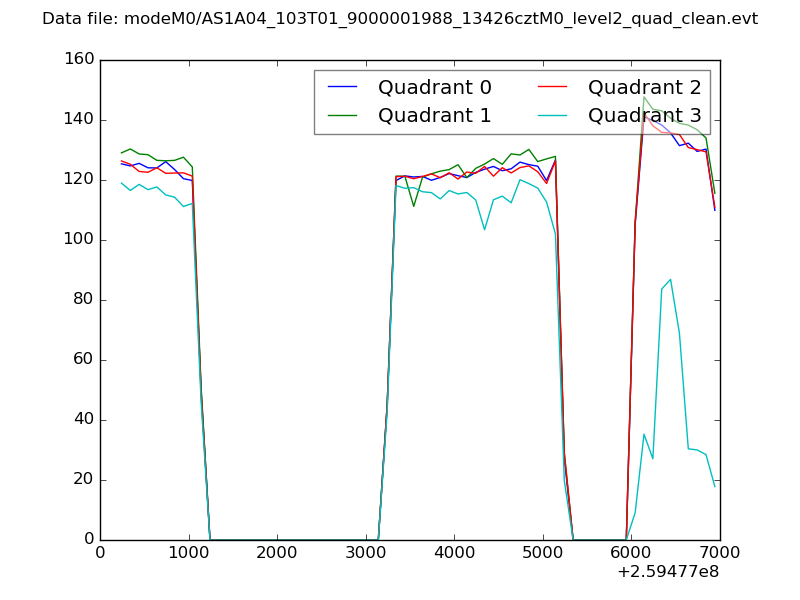 |
|
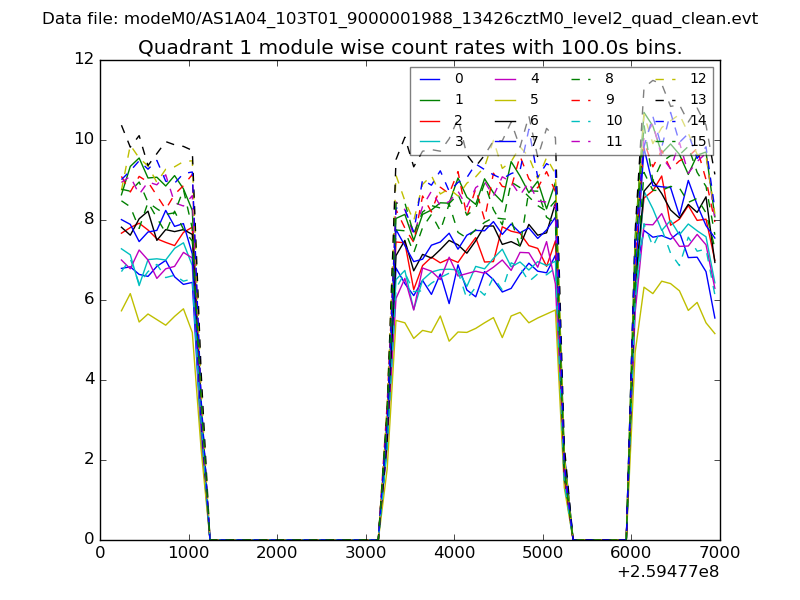
| Module-wise count rates for Quadrant A Data is divided into 100 sec bins |
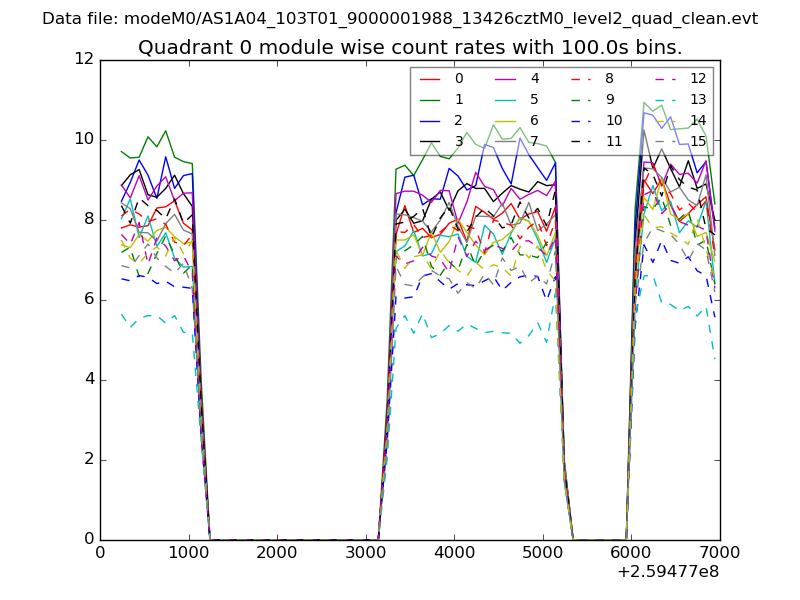 |
 |
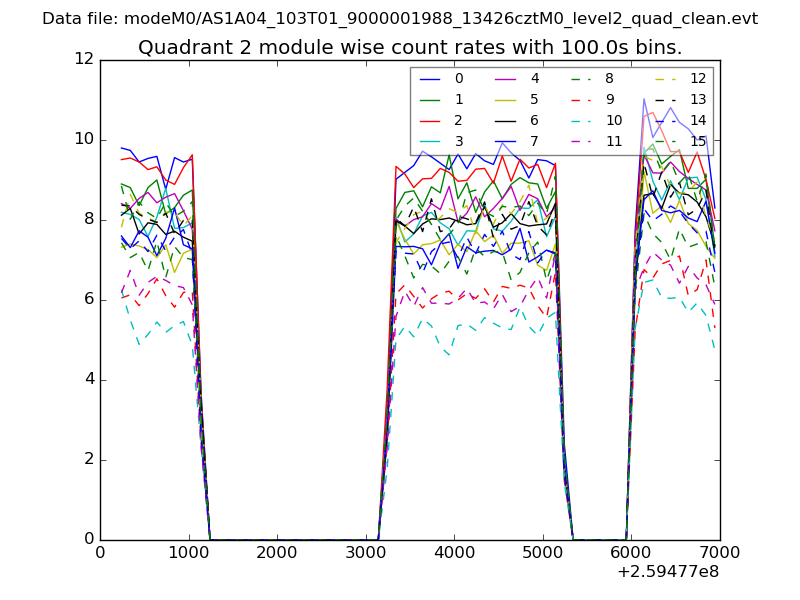
| Module-wise count rates for Quadrant B Data is divided into 100 sec bins |
 |
 |
| Module-wise count rates for Quadrant C Data is divided into 100 sec bins |
 |
 |
| Module-wise count rates for Quadrant D Data is divided into 100 sec bins |
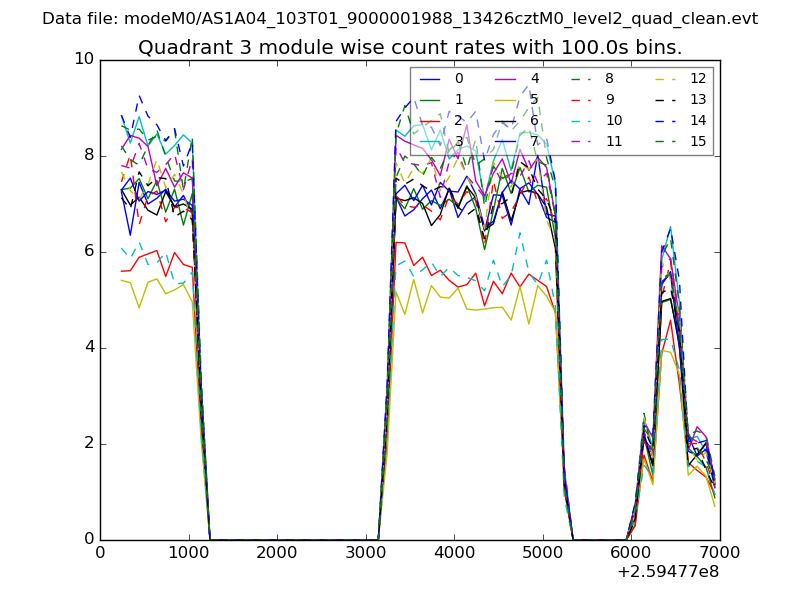 |
 |
| Parameter | Plot |
|---|---|
| CZT HV Monitor | 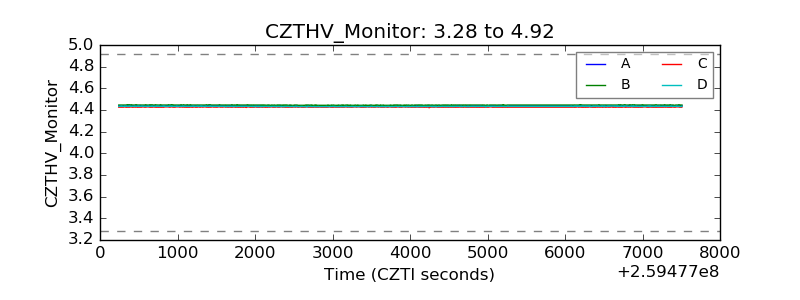 |
| D_VDD | 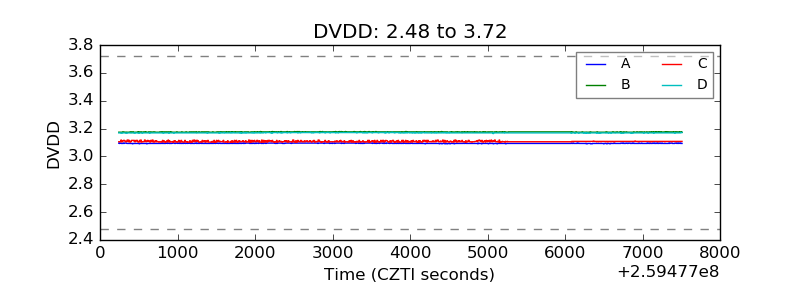 |
| Temperature 1 | 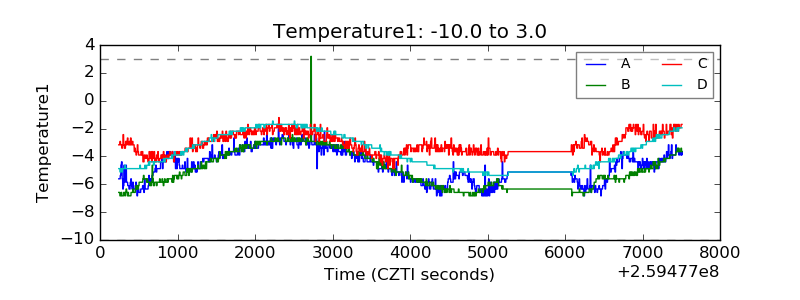 |
| Veto HV Monitor | 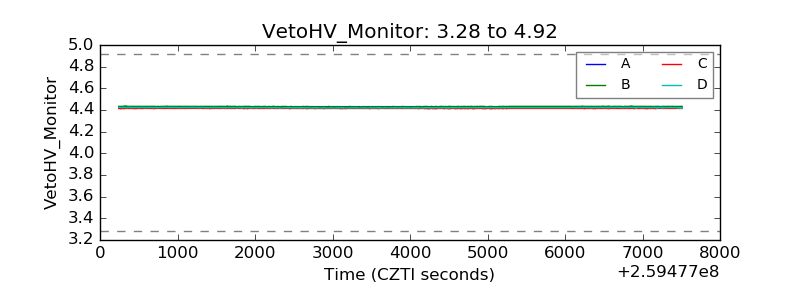 |
| Veto LLD | 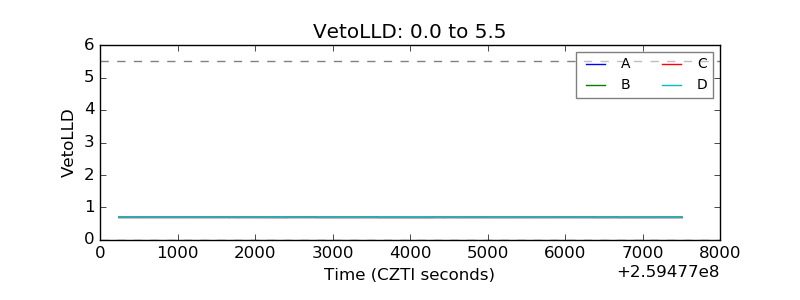 |
| Alpha Counter | 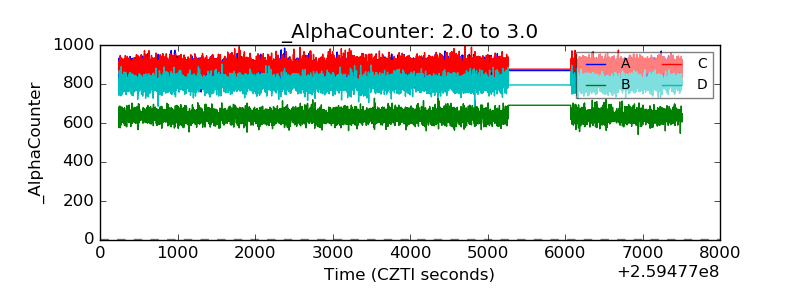 |
| _CPM_Rate | 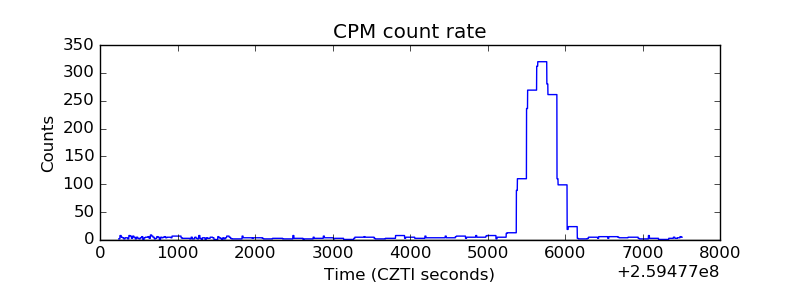 |
| CZT Counter | 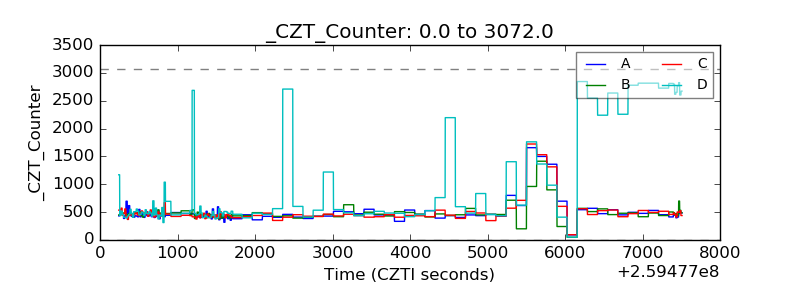 |
| +2.5 Volts monitor |  |
| +5 Volts monitor |  |
| _ROLL_ROT | 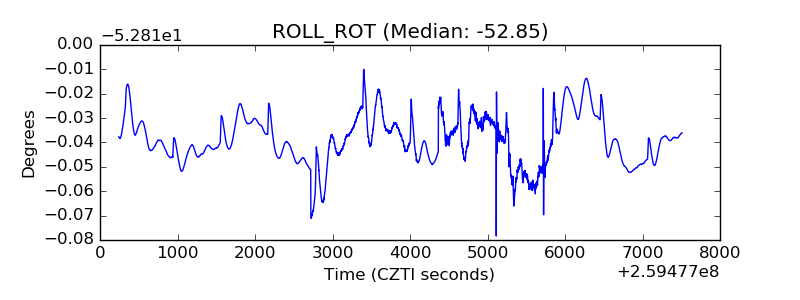 |
| _Roll_DEC | 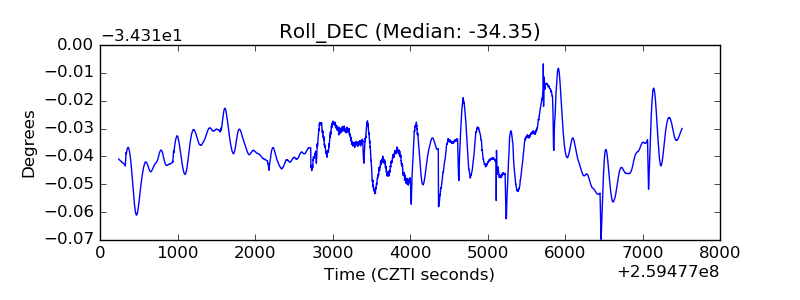 |
| _Roll_RA | 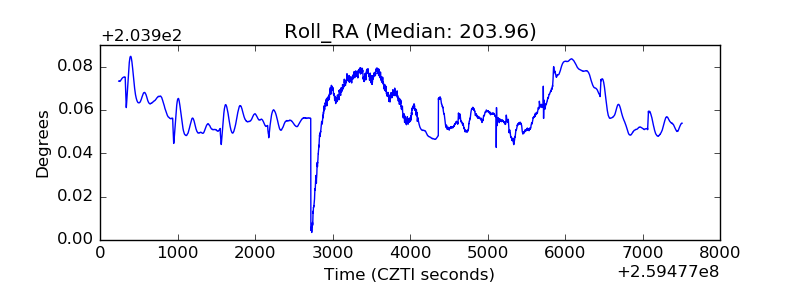 |
| Veto Counter | 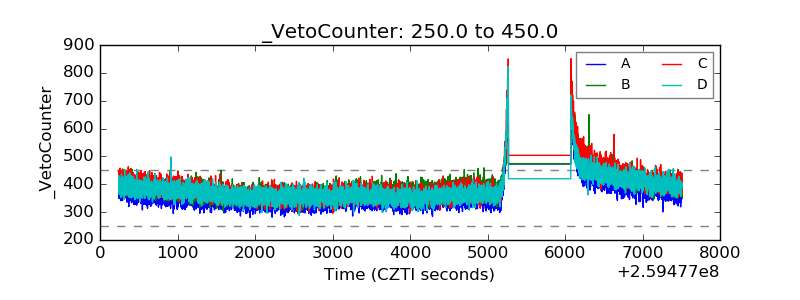 |