| Param | Original file | Final file |
|---|---|---|
| Filename | modeM0/AS1A04_103T01_9000001988_13427cztM0_level2.evt | modeM0/AS1A04_103T01_9000001988_13427cztM0_level2_quad_clean.evt |
| Size (bytes) | 852,439,680 | 68,405,760 |
| Size | 812.9 MB | 65.2 MB |
| Events in quadrant A | 3,102,198 | 481,736 |
| Events in quadrant B | 3,157,193 | 494,922 |
| Events in quadrant C | 3,128,273 | 480,686 |
| Events in quadrant D | 15,984,396 | 154,781 |
| Mode M0 | |||
|---|---|---|---|
| Quadrant | BADHDUFLAG | Total packets | Discarded packets |
| A | 0 | 13488 | 3 |
| B | 0 | 13525 | 2 |
| C | 0 | 13588 | 2 |
| D | 0 | 51873 | 2 |
| Mode SS | |||
|---|---|---|---|
| Quadrant | BADHDUFLAG | Total packets | Discarded packets |
| A | 0 | 136 | 0 |
| B | 0 | 136 | 0 |
| C | 0 | 136 | 0 |
| D | 0 | 136 | 0 |
| Mode M9 | |||
|---|---|---|---|
| Quadrant | BADHDUFLAG | Total packets | Discarded packets |
| A | 0 | 9 | 0 |
| B | 0 | 9 | 0 |
| C | 0 | 9 | 0 |
| D | 0 | 10 | 0 |
| Quadrant | Total seconds | Saturated seconds | Saturation percentage |
|---|---|---|---|
| A | 6553 | 57 | 0.869831% |
| B | 6553 | 64 | 0.976652% |
| C | 6553 | 65 | 0.991912% |
| D | 6553 | 5638 | 86.036930% |
Noise dominated data is calculated using 1-second bins in cleaned event files. If a bin has >2000 counts, and if more than 50% of those come from <1% of pixels, then it is considered to be noise-dominated and hence unusable.
| Quadrant | # 1 sec bins | Bins with >0 counts | Bins with >2000 counts | High rate bins dominated by noise | Noise dominated (total time) | Noise dominated (detector-on time) | Marked lightcurve |
|---|---|---|---|---|---|---|---|
| A | 7529 | 6554 | 1 | 1 | 0.01% | 0.02% | 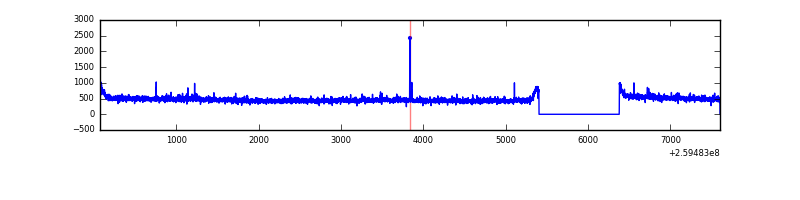 |
| B | 7529 | 6554 | 2 | 2 | 0.03% | 0.03% | 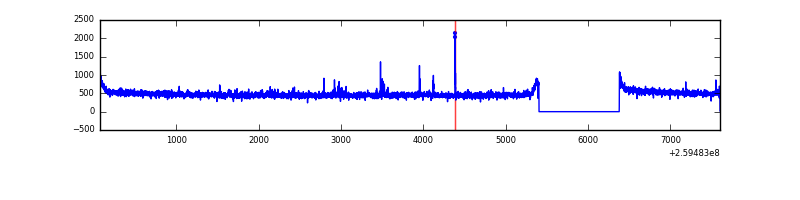 |
| C | 7529 | 6554 | 10 | 10 | 0.13% | 0.15% | 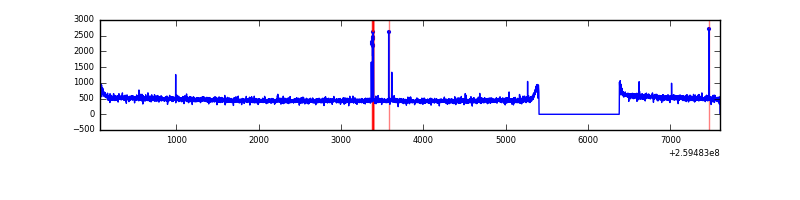 |
| D | 7528 | 6553 | 5611 | 5611 | 74.54% | 85.62% | 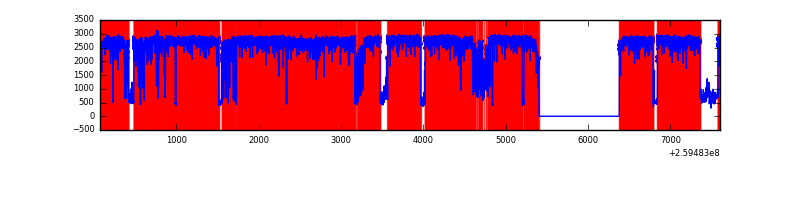 |
Top three noisy pixels from each quadrant. If the there are fewer than three noisy pixels in the level2.evt file, extra rows are filled as -1
| Pixel properties | Quadrant properties | ||||||
|---|---|---|---|---|---|---|---|
| Quadrant | DetID | PixID | Counts | Sigma | Mean | Median | Sigma |
| A | 1 | 162 | 17688 | 104.13 | 795 | 776 | 162.4 |
| A | 15 | 69 | 10206 | 58.06 | 795 | 776 | 162.4 |
| A | 0 | 226 | 7183 | 39.45 | 795 | 776 | 162.4 |
| B | 3 | 209 | 21481 | 135.77 | 794 | 775 | 152.5 |
| B | 12 | 111 | 17583 | 110.21 | 794 | 775 | 152.5 |
| B | 11 | 111 | 15183 | 94.47 | 794 | 775 | 152.5 |
| C | 14 | 234 | 44230 | 240.86 | 778 | 783 | 180.4 |
| C | 3 | 233 | 39913 | 216.92 | 778 | 783 | 180.4 |
| C | 14 | 220 | 8373 | 42.08 | 778 | 783 | 180.4 |
| D | 1 | 52 | 13685691 | 202150.73 | 281 | 272 | 67.7 |
| D | 13 | 249 | 1069468 | 15793.36 | 281 | 272 | 67.7 |
| D | 2 | 136 | 81365 | 1197.84 | 281 | 272 | 67.7 |
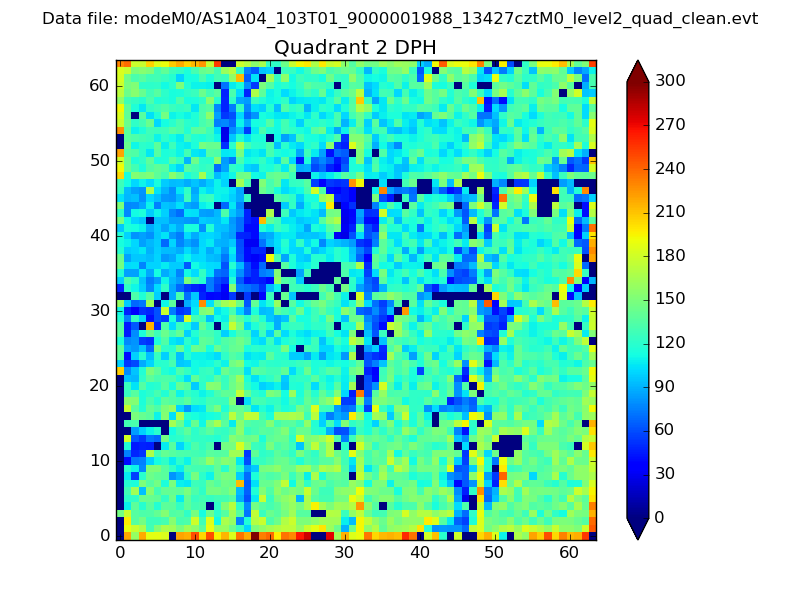
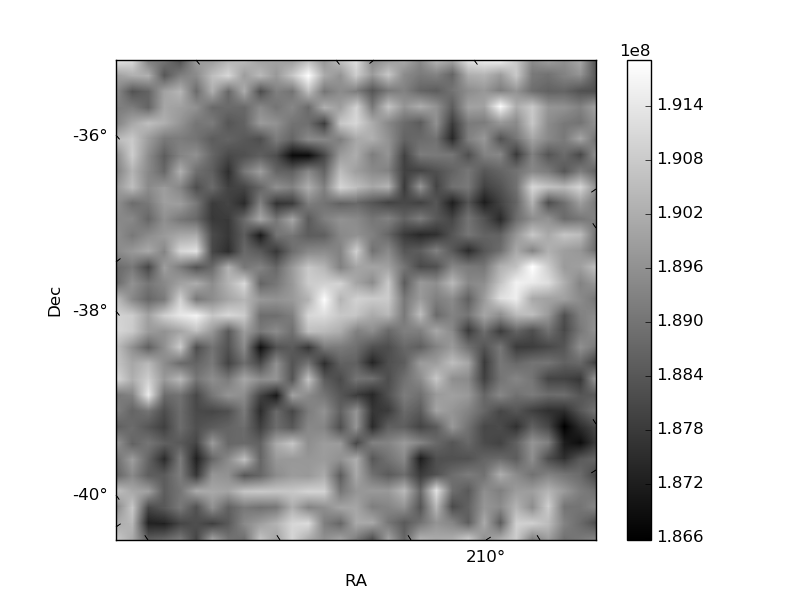
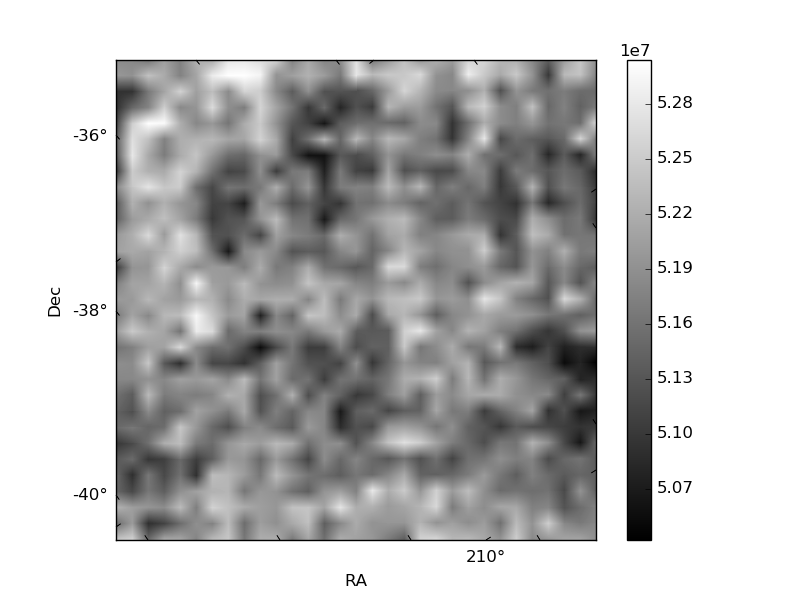
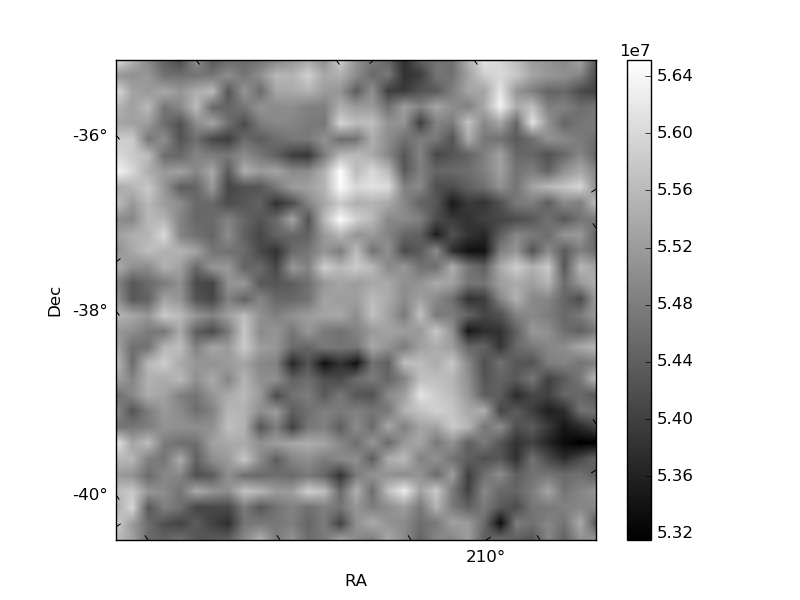
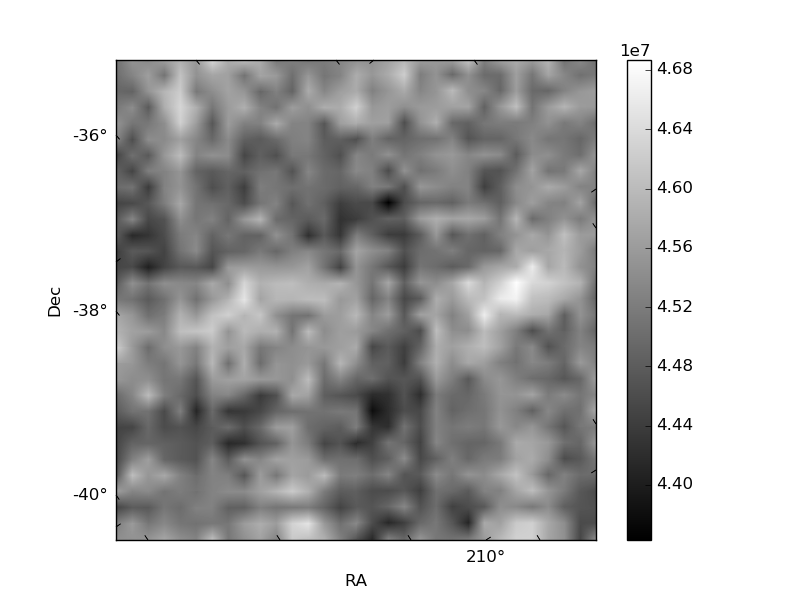
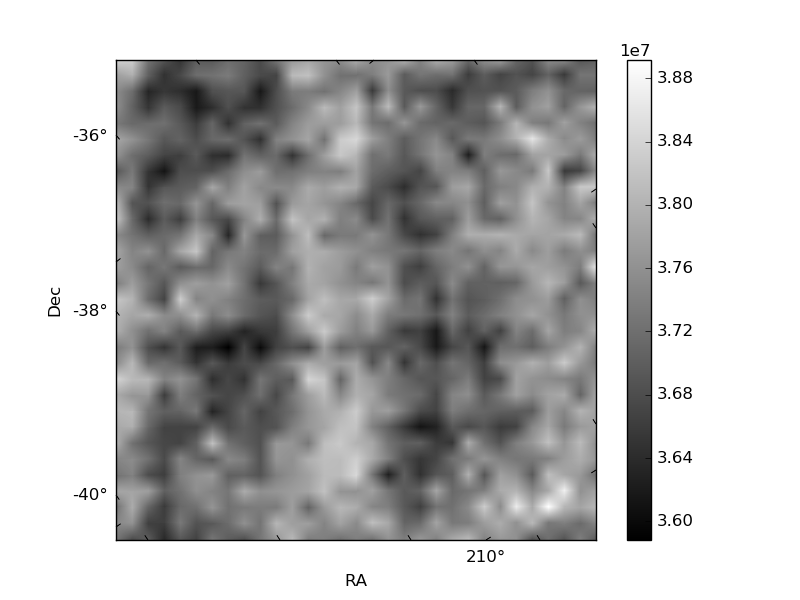
Histogram calculated using DETX and DETY for each event in the final _common_clean file
| Quadrant A | 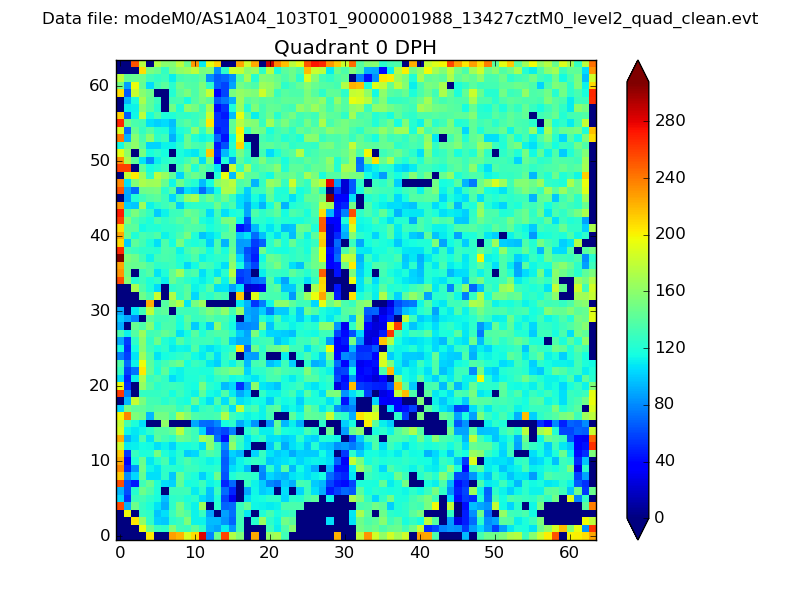 |
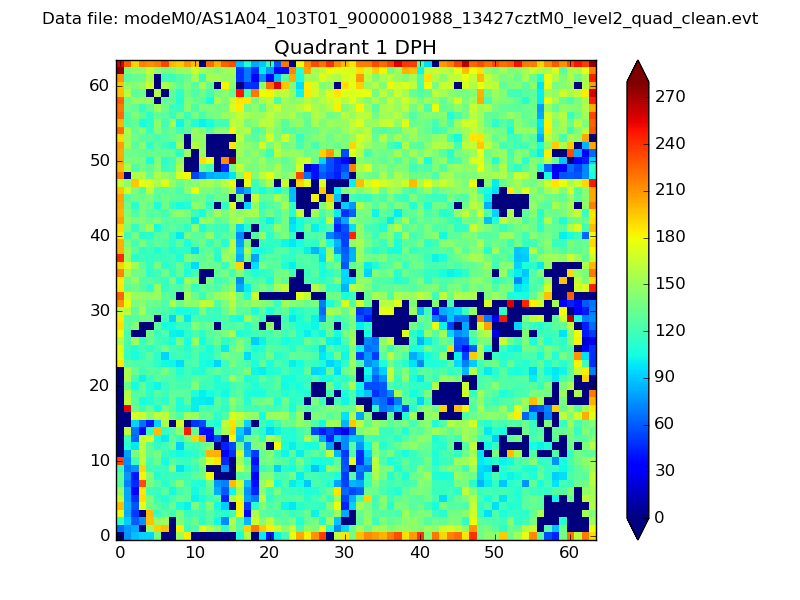 |
Quadrant B |
|---|---|---|---|
| Quadrant D | 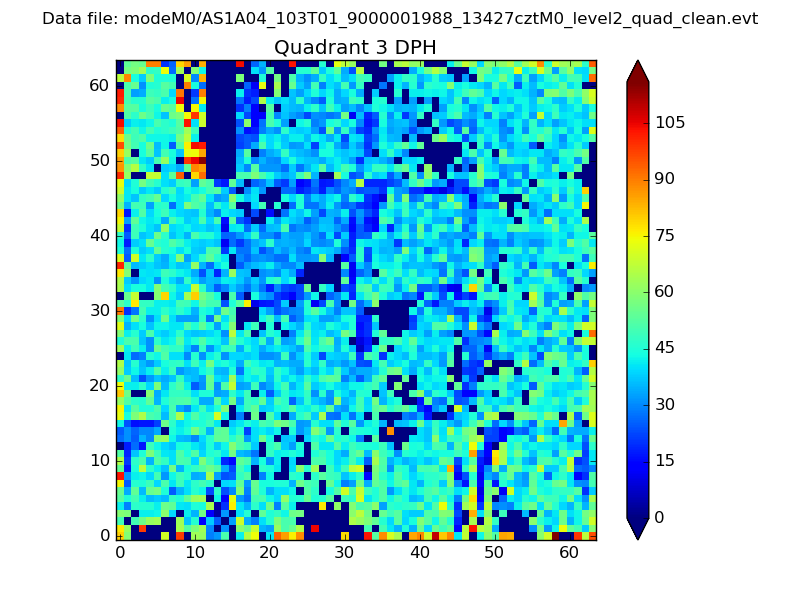 |
 |
Quadrant C |
| Plot type | Count rate plots | Images |
|---|---|---|
| Comparison with Poisson distribution Blue bars denote a histogram of data divided into 1 sec bins. Red curve is a Poisson curve with rate = median count rate of data. |
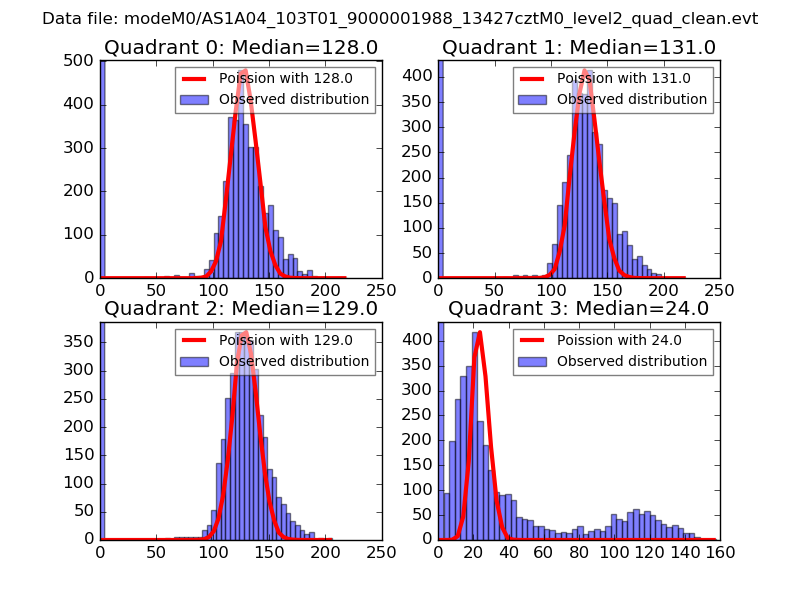 |
 |
| Quadrant-wise count rates Data is divided into 100 sec bins |
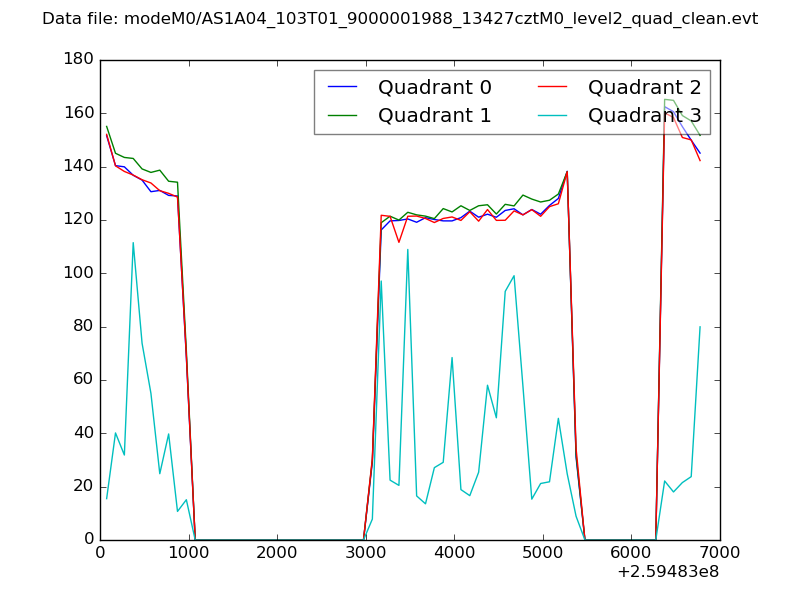 |
|
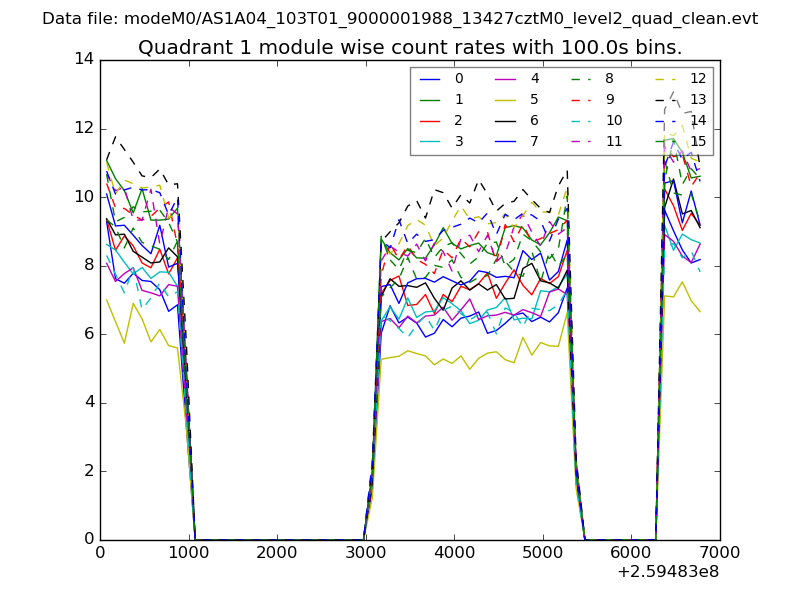
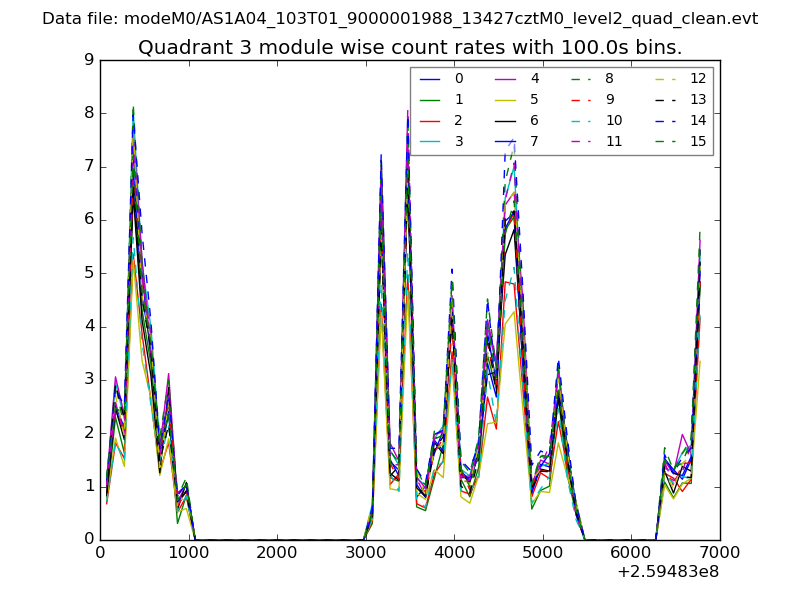
| Module-wise count rates for Quadrant A Data is divided into 100 sec bins |
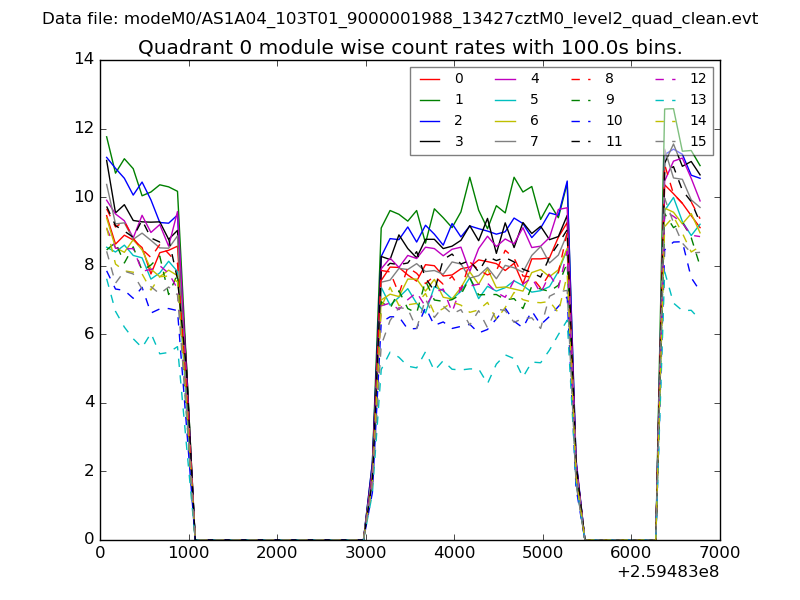 |
 |
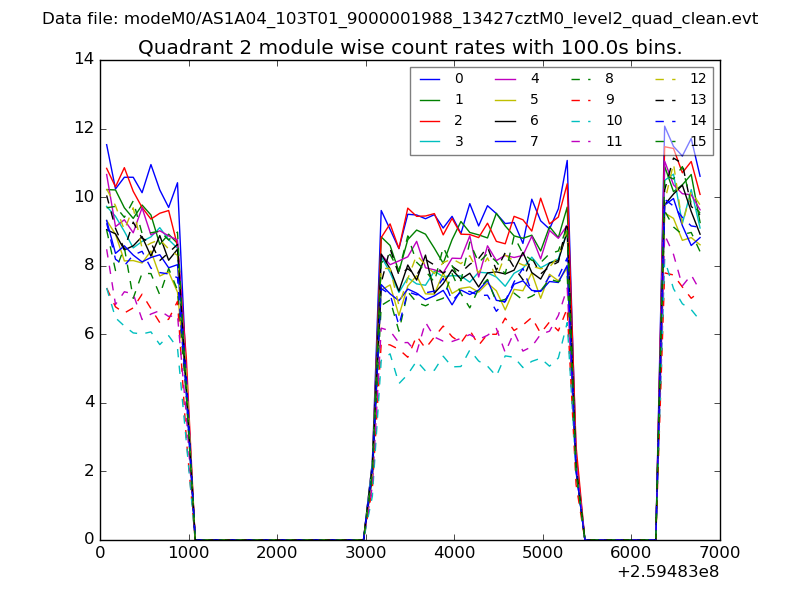
| Module-wise count rates for Quadrant B Data is divided into 100 sec bins |
 |
 |
| Module-wise count rates for Quadrant C Data is divided into 100 sec bins |
 |
 |
| Module-wise count rates for Quadrant D Data is divided into 100 sec bins |
 |
 |
| Parameter | Plot |
|---|---|
| CZT HV Monitor | 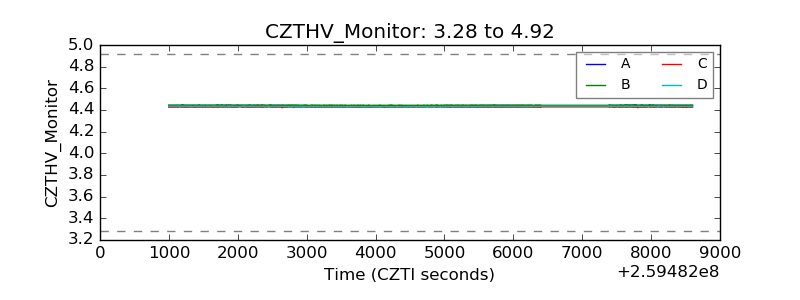 |
| D_VDD | 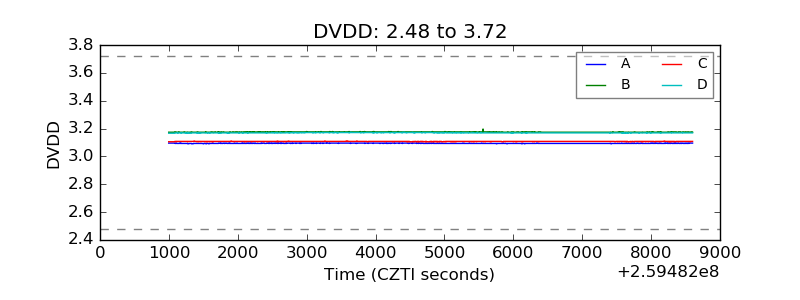 |
| Temperature 1 | 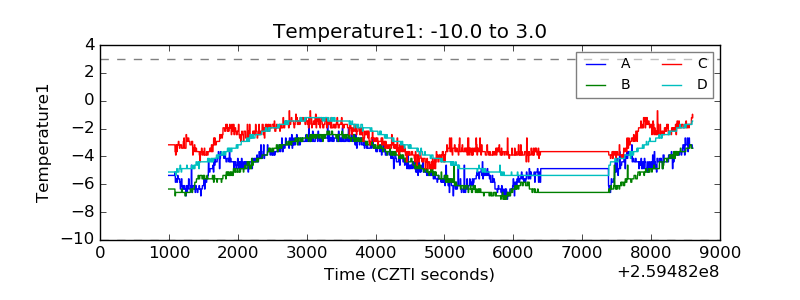 |
| Veto HV Monitor | 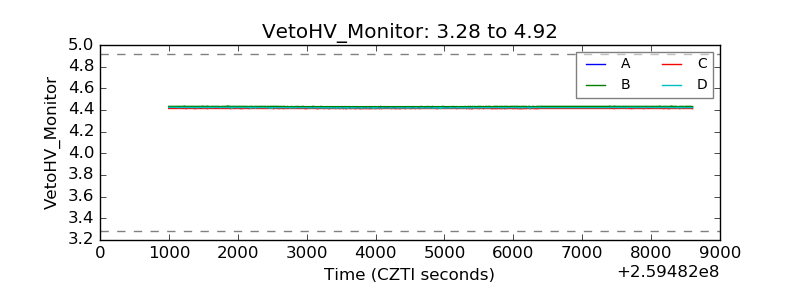 |
| Veto LLD | 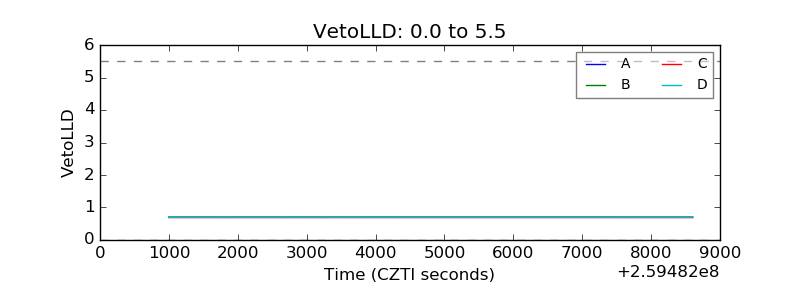 |
| Alpha Counter | 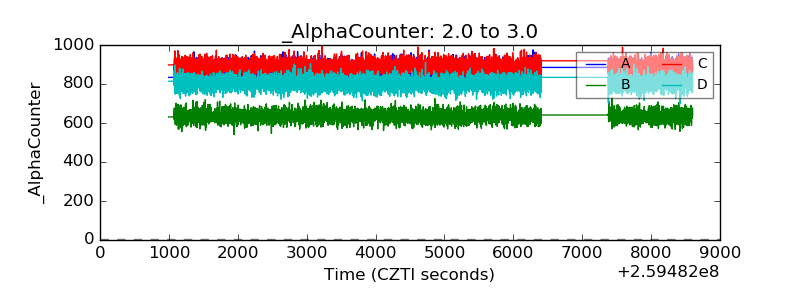 |
| _CPM_Rate | 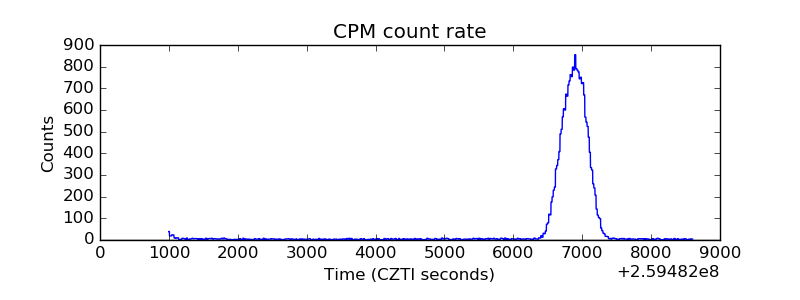 |
| CZT Counter | 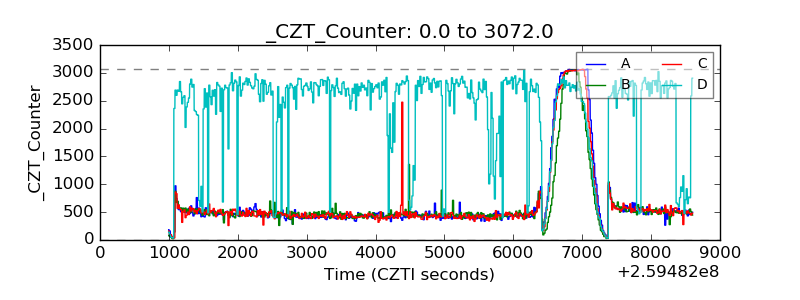 |
| +2.5 Volts monitor |  |
| +5 Volts monitor |  |
| _ROLL_ROT | 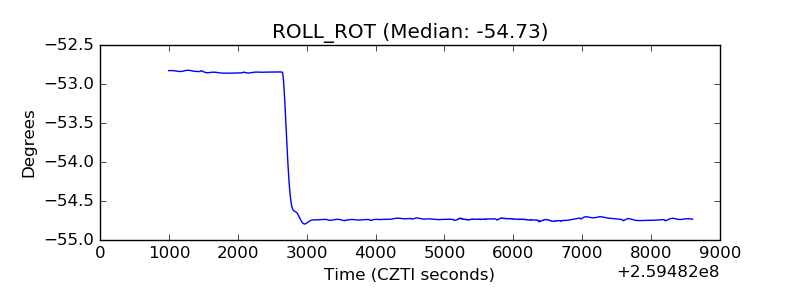 |
| _Roll_DEC | 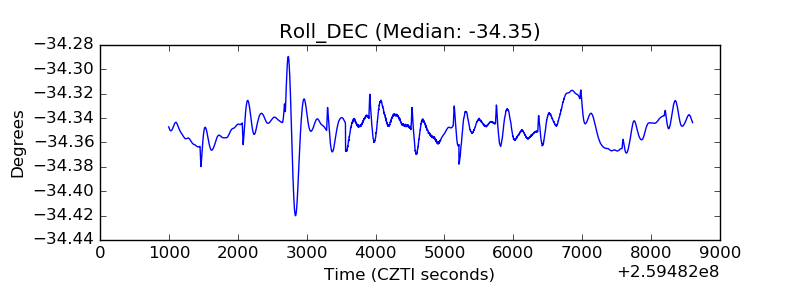 |
| _Roll_RA | 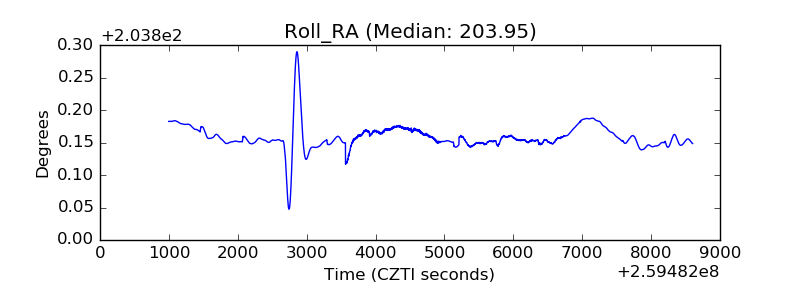 |
| Veto Counter | 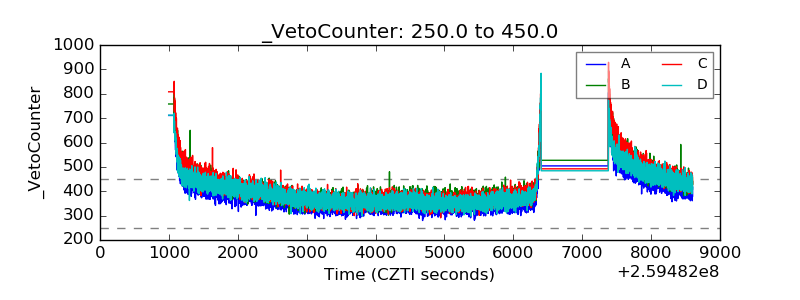 |