| Param | Original file | Final file |
|---|---|---|
| Filename | modeM0/AS1A04_103T01_9000001988_13430cztM0_level2.evt | modeM0/AS1A04_103T01_9000001988_13430cztM0_level2_quad_clean.evt |
| Size (bytes) | 561,960,000 | 63,993,600 |
| Size | 535.9 MB | 61.0 MB |
| Events in quadrant A | 3,274,817 | 385,720 |
| Events in quadrant B | 3,442,604 | 388,604 |
| Events in quadrant C | 3,244,322 | 383,877 |
| Events in quadrant D | 6,623,078 | 332,414 |
| Mode M0 | |||
|---|---|---|---|
| Quadrant | BADHDUFLAG | Total packets | Discarded packets |
| A | 0 | 13928 | 3 |
| B | 0 | 14343 | 2 |
| C | 0 | 13827 | 2 |
| D | 0 | 23978 | 2 |
| Mode SS | |||
|---|---|---|---|
| Quadrant | BADHDUFLAG | Total packets | Discarded packets |
| A | 0 | 130 | 0 |
| B | 0 | 130 | 0 |
| C | 0 | 130 | 0 |
| D | 0 | 130 | 0 |
| Mode M9 | |||
|---|---|---|---|
| Quadrant | BADHDUFLAG | Total packets | Discarded packets |
| A | 0 | 20 | 0 |
| B | 0 | 20 | 0 |
| C | 0 | 20 | 0 |
| D | 0 | 21 | 0 |
| Quadrant | Total seconds | Saturated seconds | Saturation percentage |
|---|---|---|---|
| A | 6403 | 95 | 1.483680% |
| B | 6403 | 137 | 2.139622% |
| C | 6403 | 65 | 1.015149% |
| D | 6403 | 1206 | 18.834921% |
Noise dominated data is calculated using 1-second bins in cleaned event files. If a bin has >2000 counts, and if more than 50% of those come from <1% of pixels, then it is considered to be noise-dominated and hence unusable.
| Quadrant | # 1 sec bins | Bins with >0 counts | Bins with >2000 counts | High rate bins dominated by noise | Noise dominated (total time) | Noise dominated (detector-on time) | Marked lightcurve |
|---|---|---|---|---|---|---|---|
| A | 7584 | 6404 | 0 | 0 | 0.00% | 0.00% | 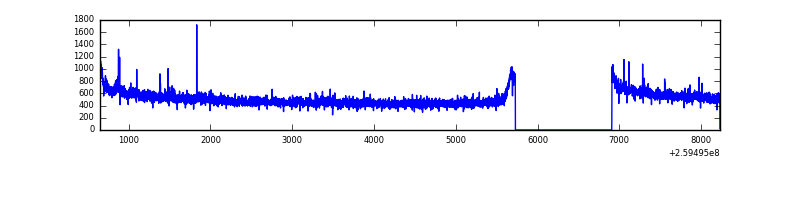 |
| B | 7584 | 6404 | 36 | 36 | 0.47% | 0.56% | 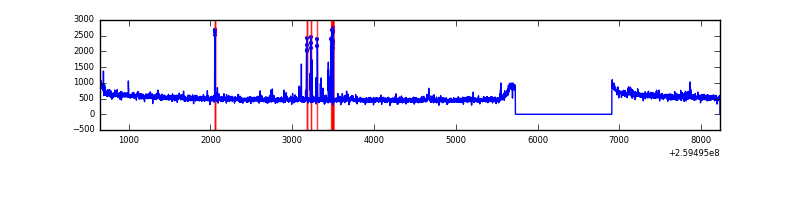 |
| C | 7584 | 6404 | 0 | 0 | 0.00% | 0.00% | 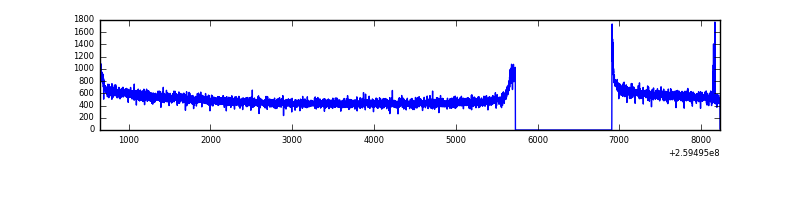 |
| D | 7584 | 6404 | 1043 | 1043 | 13.75% | 16.29% | 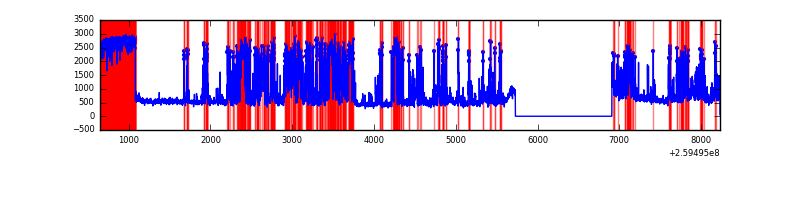 |
Top three noisy pixels from each quadrant. If the there are fewer than three noisy pixels in the level2.evt file, extra rows are filled as -1
| Pixel properties | Quadrant properties | ||||||
|---|---|---|---|---|---|---|---|
| Quadrant | DetID | PixID | Counts | Sigma | Mean | Median | Sigma |
| A | 1 | 162 | 16149 | 91.21 | 841 | 824 | 168.0 |
| A | 15 | 69 | 15379 | 86.63 | 841 | 824 | 168.0 |
| A | 0 | 226 | 7593 | 40.29 | 841 | 824 | 168.0 |
| B | 4 | 142 | 121021 | 764.93 | 834 | 814 | 157.1 |
| B | 0 | 214 | 39418 | 245.66 | 834 | 814 | 157.1 |
| B | 3 | 64 | 19321 | 117.77 | 834 | 814 | 157.1 |
| C | 3 | 233 | 69489 | 370.65 | 812 | 818 | 185.3 |
| C | 14 | 234 | 6867 | 32.65 | 812 | 818 | 185.3 |
| C | 13 | 61 | 5842 | 27.12 | 812 | 818 | 185.3 |
| D | 13 | 249 | 2555070 | 14845.93 | 721 | 700 | 172.1 |
| D | 1 | 52 | 1068055 | 6203.44 | 721 | 700 | 172.1 |
| D | 8 | 195 | 175912 | 1018.33 | 721 | 700 | 172.1 |
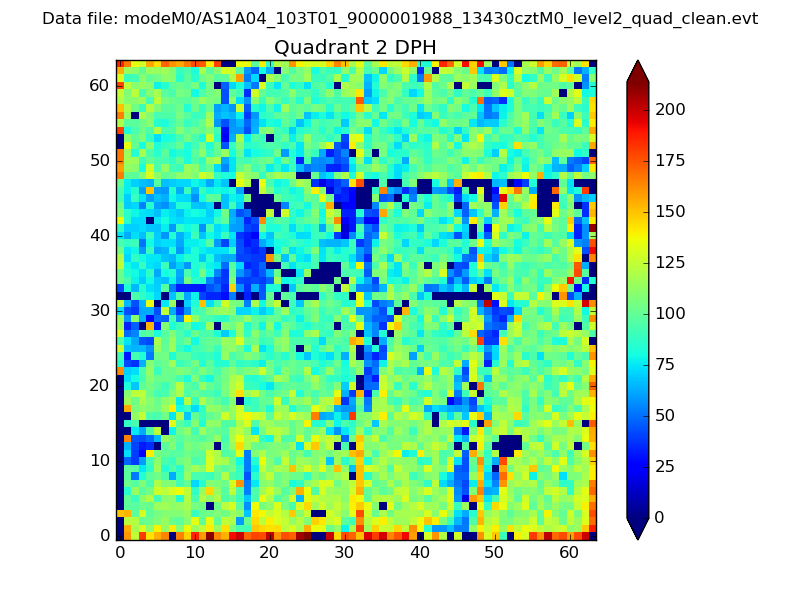
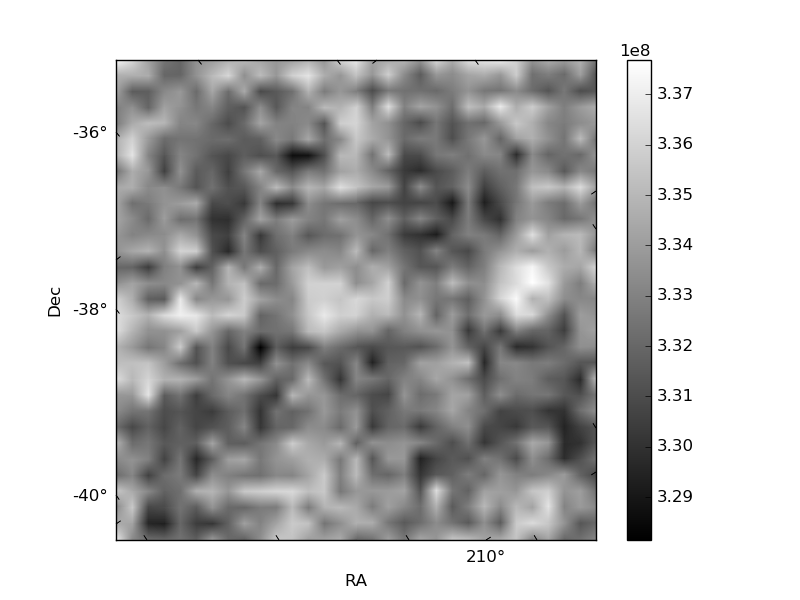
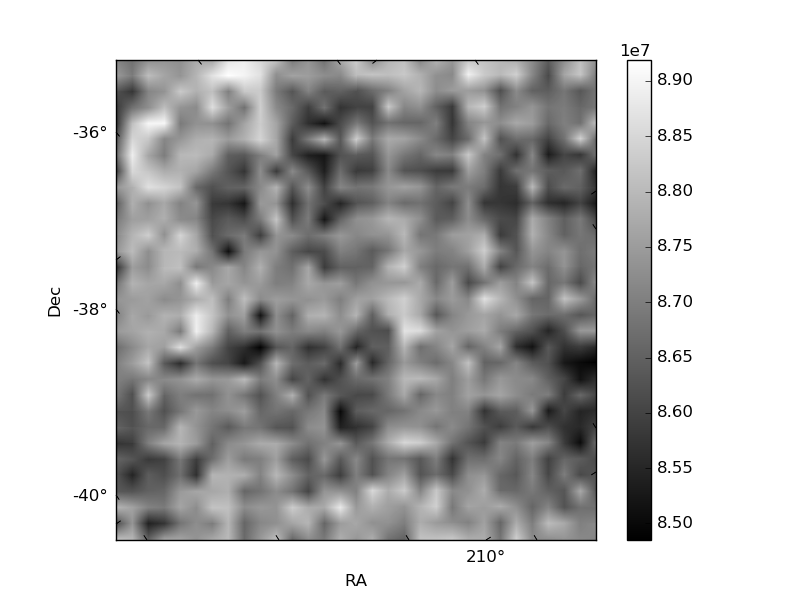
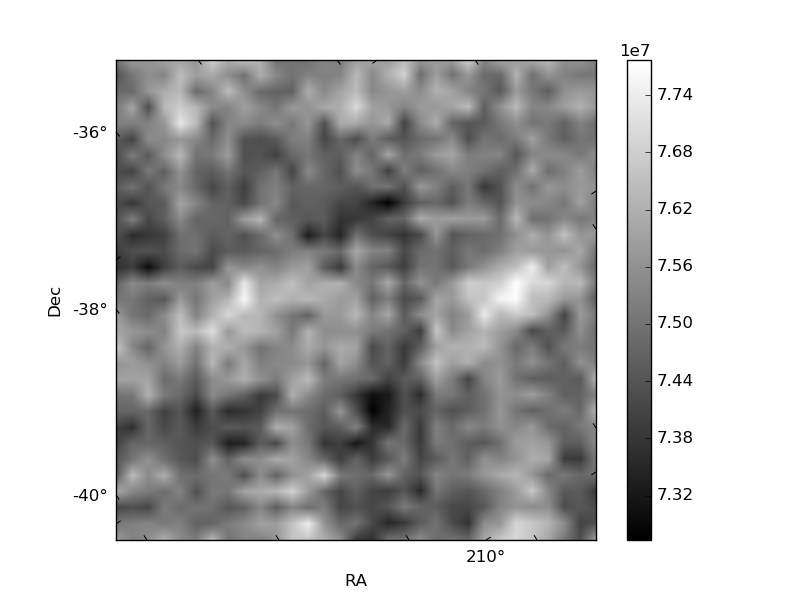
Histogram calculated using DETX and DETY for each event in the final _common_clean file
| Quadrant A | 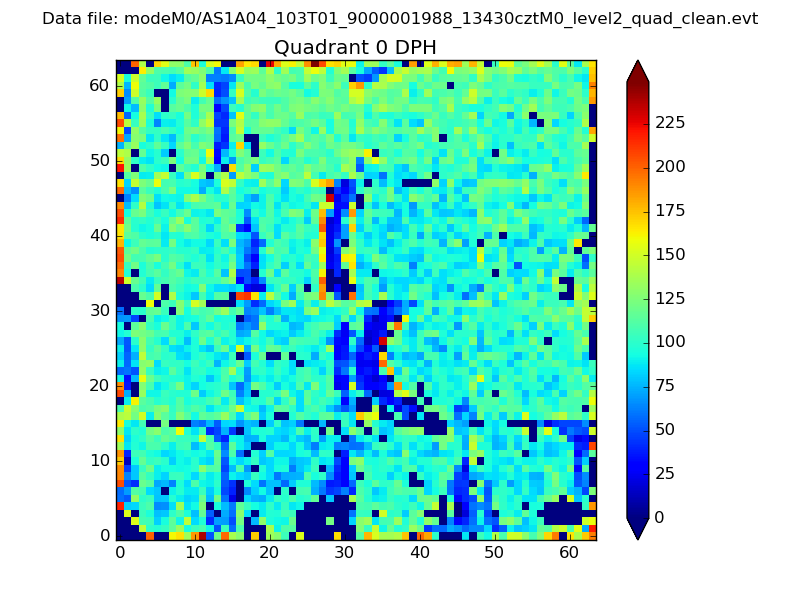 |
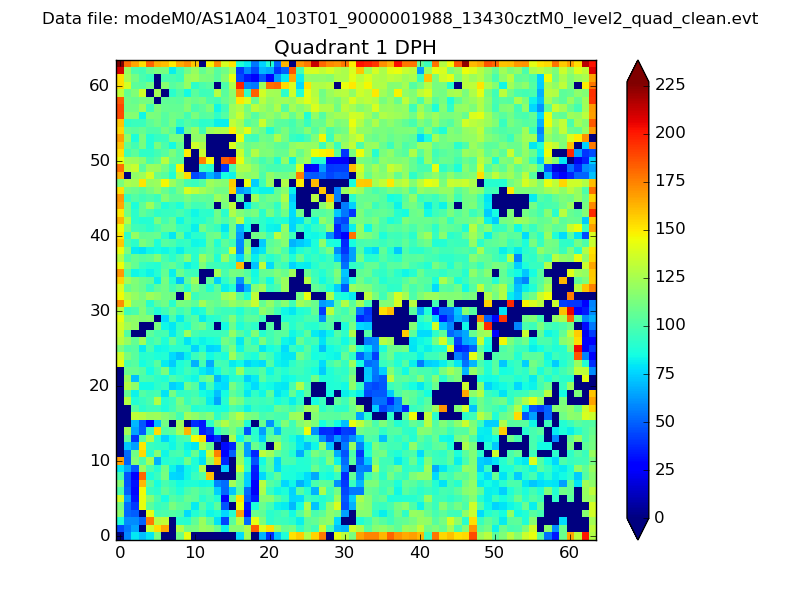 |
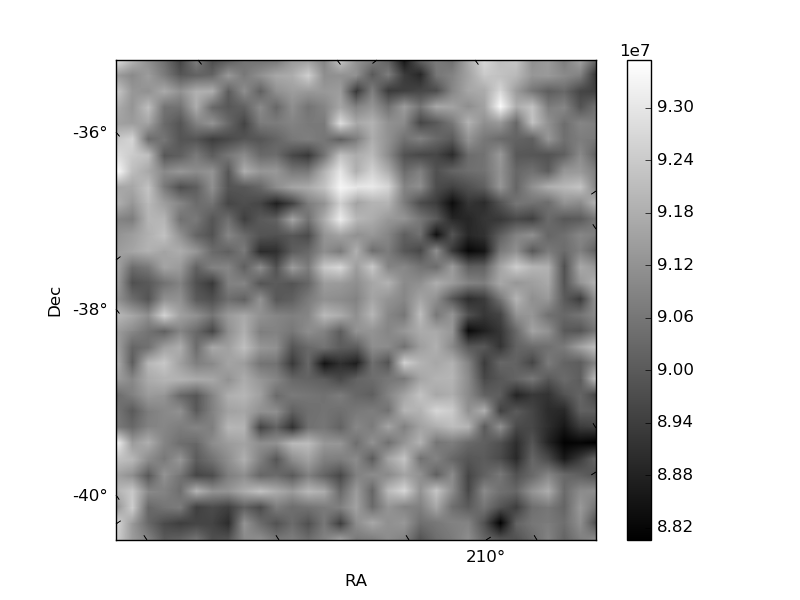
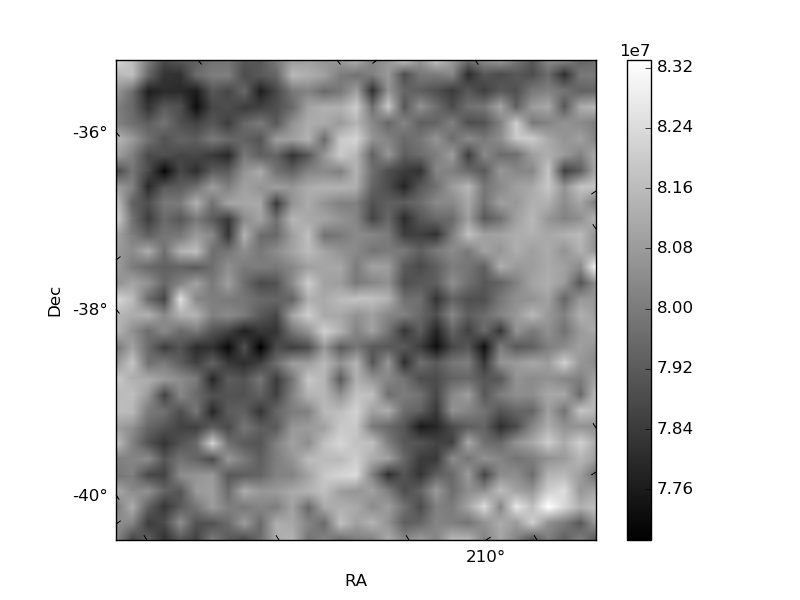
Quadrant B |
|---|---|---|---|
| Quadrant D | 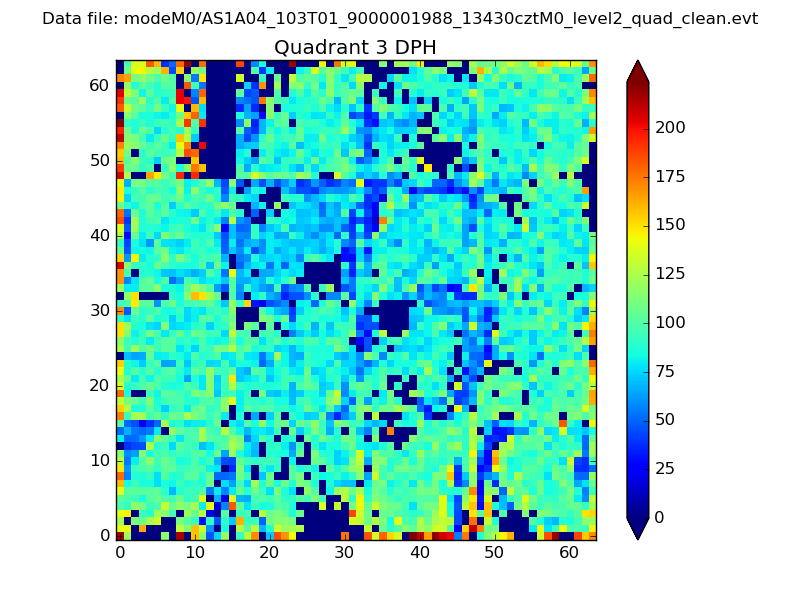 |
 |
Quadrant C |
| Plot type | Count rate plots | Images |
|---|---|---|
| Comparison with Poisson distribution Blue bars denote a histogram of data divided into 1 sec bins. Red curve is a Poisson curve with rate = median count rate of data. |
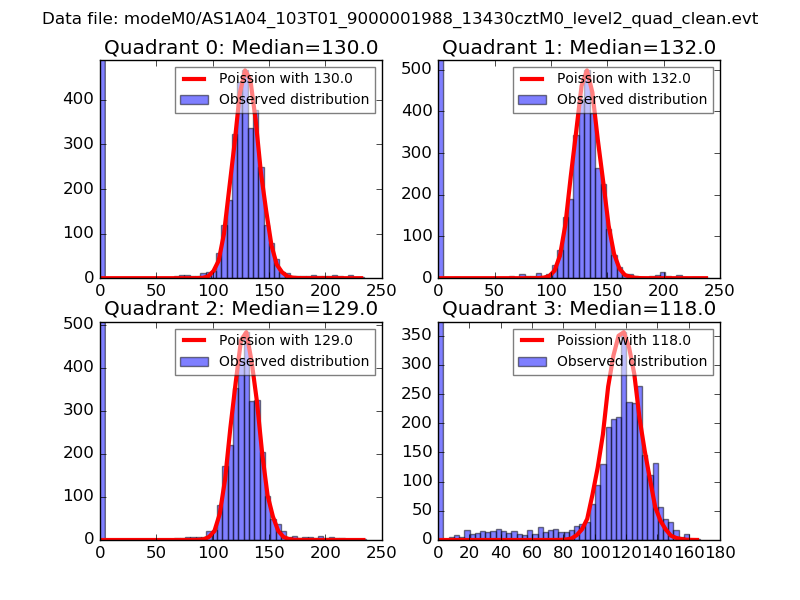 |
 |
| Quadrant-wise count rates Data is divided into 100 sec bins |
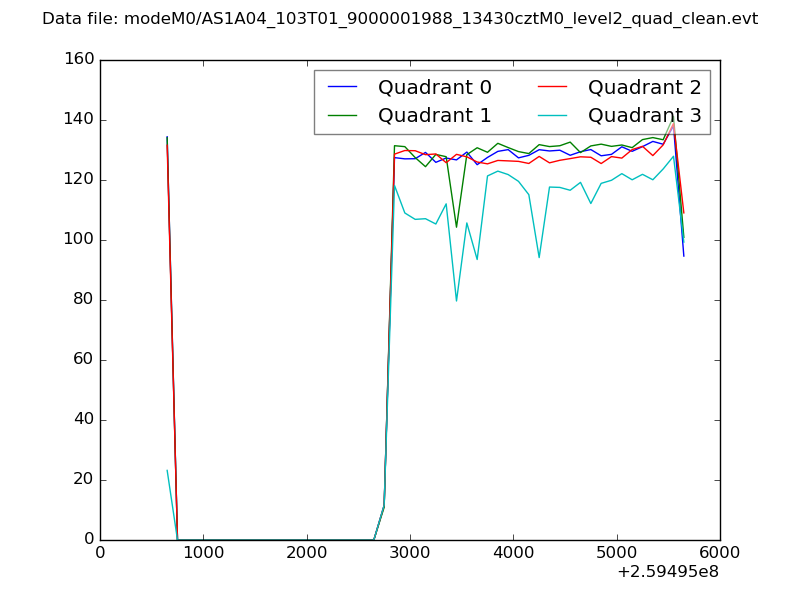 |
|
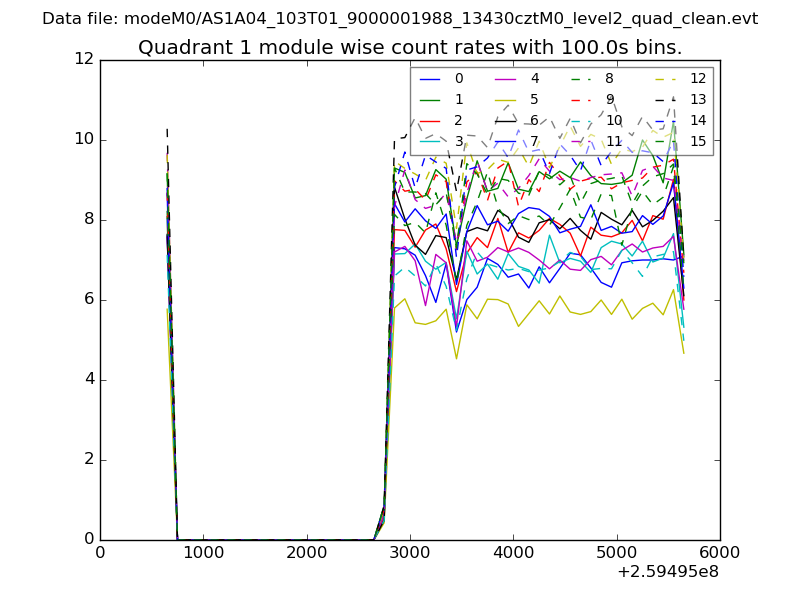
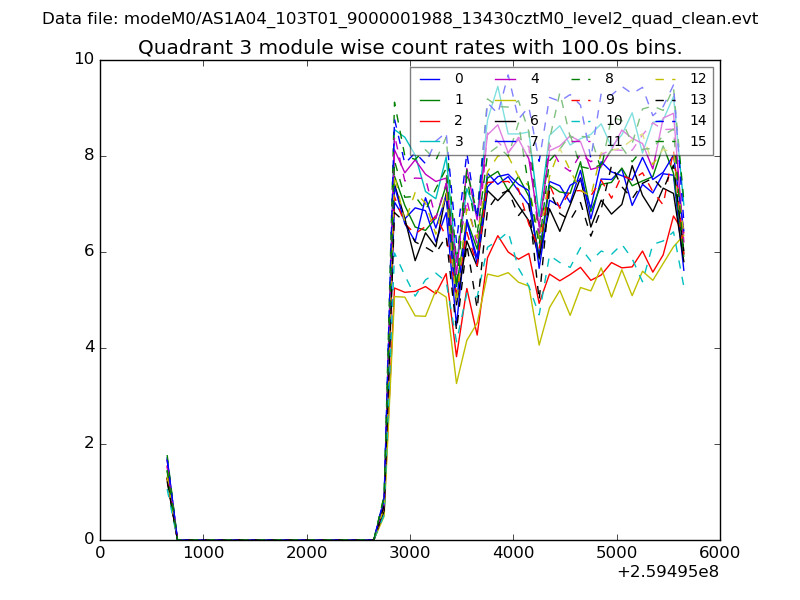
| Module-wise count rates for Quadrant A Data is divided into 100 sec bins |
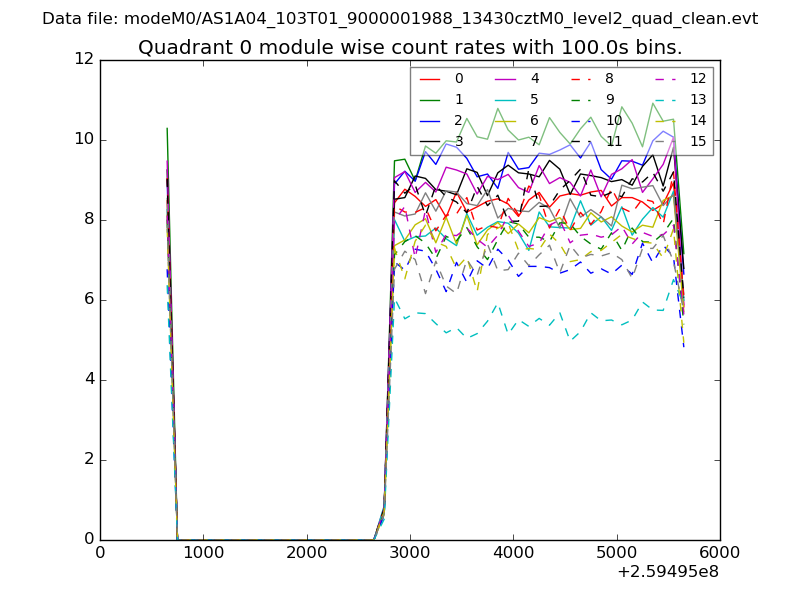 |
 |
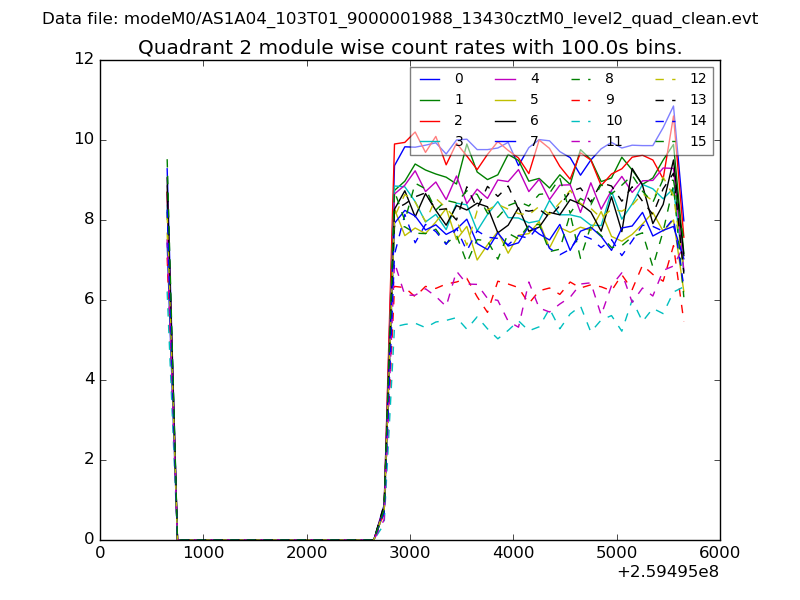
| Module-wise count rates for Quadrant B Data is divided into 100 sec bins |
 |
 |
| Module-wise count rates for Quadrant C Data is divided into 100 sec bins |
 |
 |
| Module-wise count rates for Quadrant D Data is divided into 100 sec bins |
 |
 |
| Parameter | Plot |
|---|---|
| CZT HV Monitor | 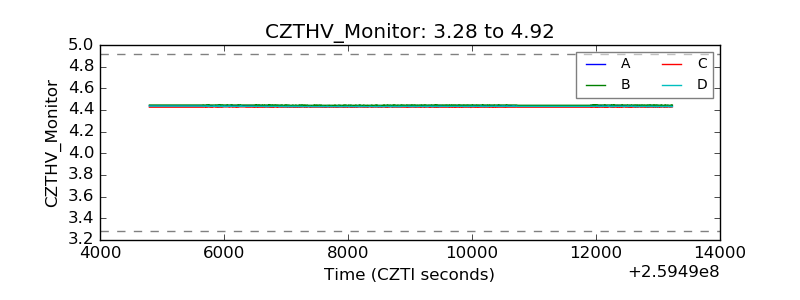 |
| D_VDD | 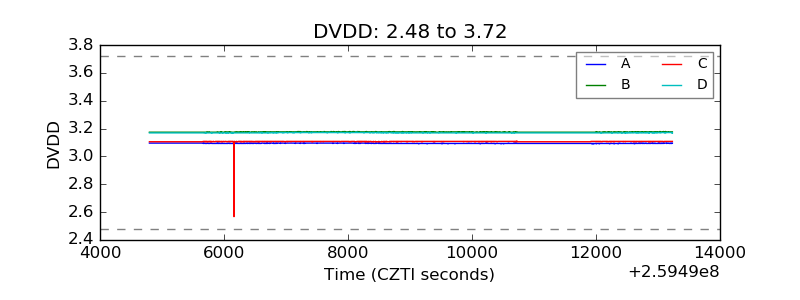 |
| Temperature 1 | 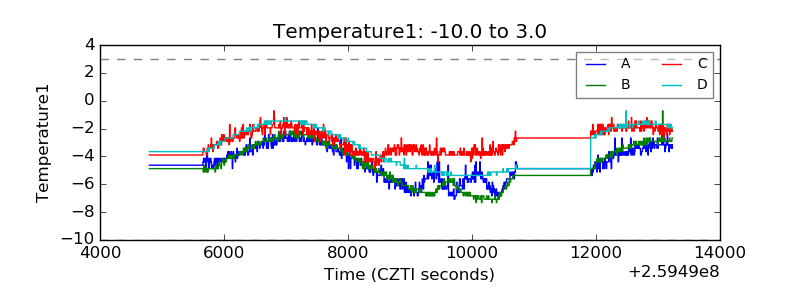 |
| Veto HV Monitor | 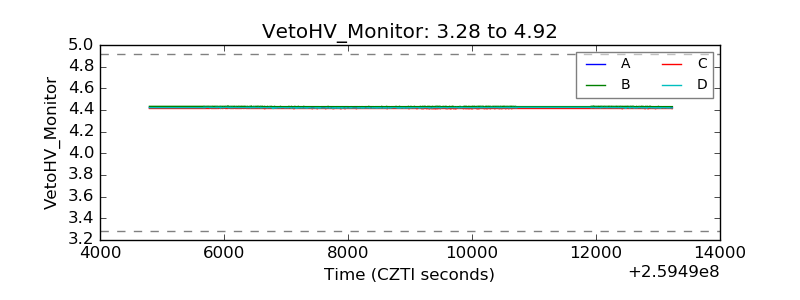 |
| Veto LLD | 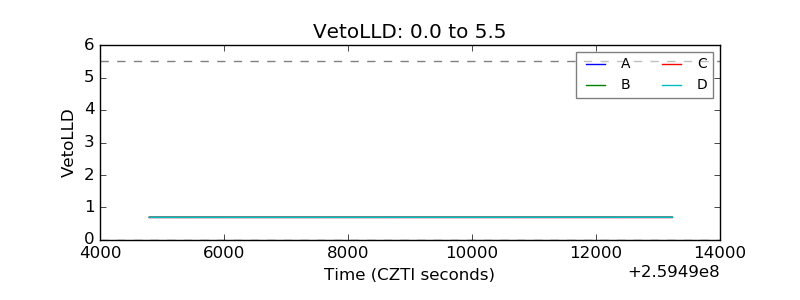 |
| Alpha Counter | 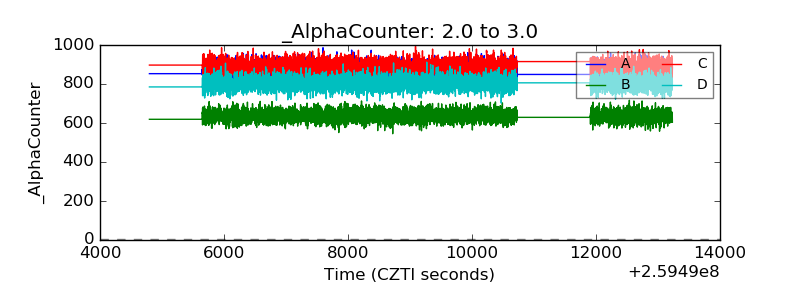 |
| _CPM_Rate | 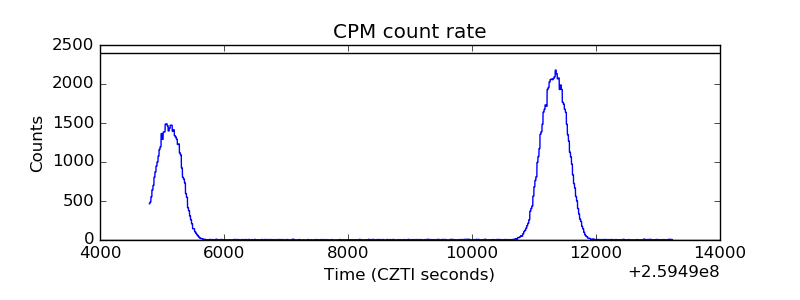 |
| CZT Counter | 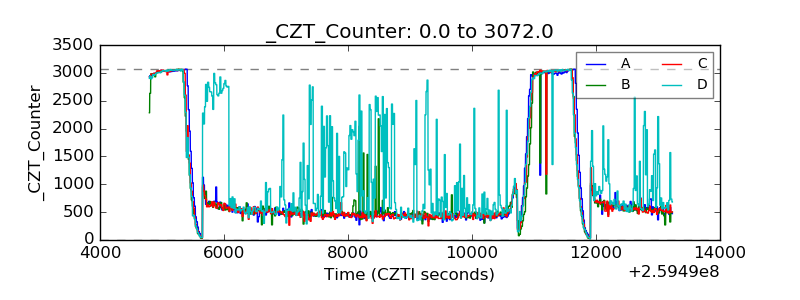 |
| +2.5 Volts monitor |  |
| +5 Volts monitor |  |
| _ROLL_ROT | 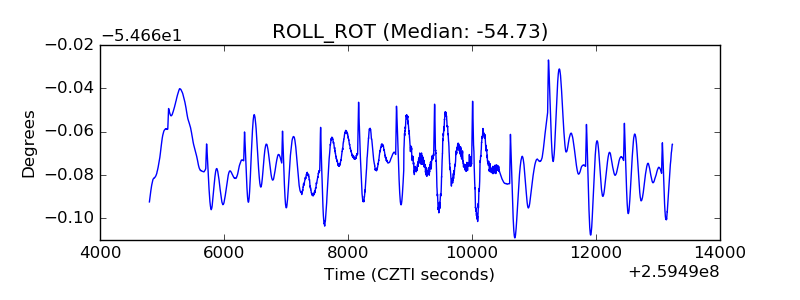 |
| _Roll_DEC | 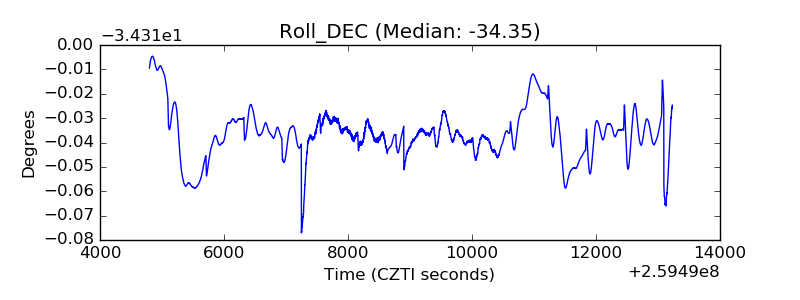 |
| _Roll_RA | 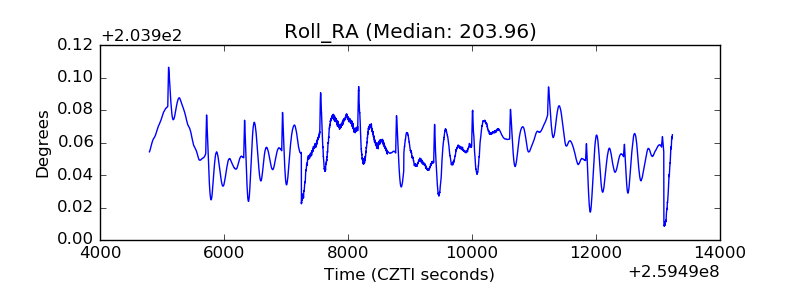 |
| Veto Counter | 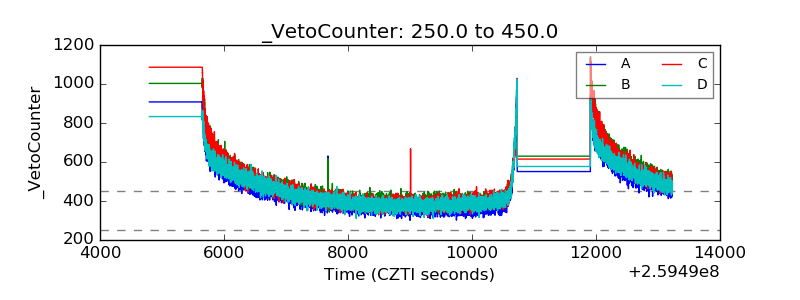 |