| Param | Original file | Final file |
|---|---|---|
| Filename | modeM0/AS1A04_103T01_9000001988_13431cztM0_level2.evt | modeM0/AS1A04_103T01_9000001988_13431cztM0_level2_quad_clean.evt |
| Size (bytes) | 542,952,000 | 74,318,400 |
| Size | 517.8 MB | 70.9 MB |
| Events in quadrant A | 3,412,517 | 461,698 |
| Events in quadrant B | 3,455,510 | 468,995 |
| Events in quadrant C | 3,388,380 | 456,550 |
| Events in quadrant D | 5,742,720 | 405,976 |
| Mode M0 | |||
|---|---|---|---|
| Quadrant | BADHDUFLAG | Total packets | Discarded packets |
| A | 0 | 14349 | 3 |
| B | 0 | 14430 | 2 |
| C | 0 | 14225 | 2 |
| D | 0 | 21536 | 2 |
| Mode SS | |||
|---|---|---|---|
| Quadrant | BADHDUFLAG | Total packets | Discarded packets |
| A | 0 | 134 | 0 |
| B | 0 | 134 | 0 |
| C | 0 | 134 | 0 |
| D | 0 | 134 | 0 |
| Mode M9 | |||
|---|---|---|---|
| Quadrant | BADHDUFLAG | Total packets | Discarded packets |
| A | 0 | 15 | 0 |
| B | 0 | 15 | 0 |
| C | 0 | 15 | 0 |
| D | 0 | 16 | 0 |
| Quadrant | Total seconds | Saturated seconds | Saturation percentage |
|---|---|---|---|
| A | 6547 | 112 | 1.710707% |
| B | 6547 | 125 | 1.909271% |
| C | 6547 | 76 | 1.160837% |
| D | 6547 | 755 | 11.531999% |
Noise dominated data is calculated using 1-second bins in cleaned event files. If a bin has >2000 counts, and if more than 50% of those come from <1% of pixels, then it is considered to be noise-dominated and hence unusable.
| Quadrant | # 1 sec bins | Bins with >0 counts | Bins with >2000 counts | High rate bins dominated by noise | Noise dominated (total time) | Noise dominated (detector-on time) | Marked lightcurve |
|---|---|---|---|---|---|---|---|
| A | 7803 | 6548 | 0 | 0 | 0.00% | 0.00% | 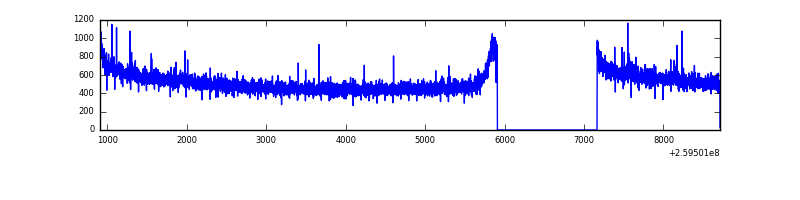 |
| B | 7803 | 6548 | 0 | 0 | 0.00% | 0.00% | 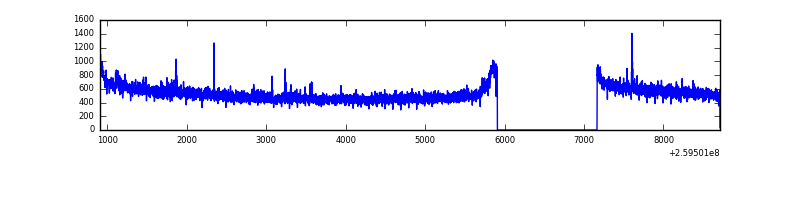 |
| C | 7803 | 6548 | 0 | 0 | 0.00% | 0.00% |  |
| D | 7803 | 6548 | 584 | 584 | 7.48% | 8.92% | 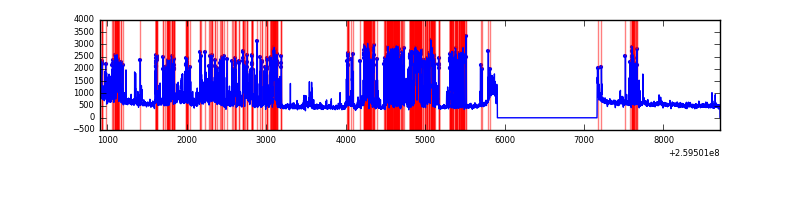 |
Top three noisy pixels from each quadrant. If the there are fewer than three noisy pixels in the level2.evt file, extra rows are filled as -1
| Pixel properties | Quadrant properties | ||||||
|---|---|---|---|---|---|---|---|
| Quadrant | DetID | PixID | Counts | Sigma | Mean | Median | Sigma |
| A | 1 | 162 | 14187 | 75.44 | 881 | 865 | 176.6 |
| A | 0 | 226 | 7931 | 40.01 | 881 | 865 | 176.6 |
| A | 12 | 194 | 6534 | 32.1 | 881 | 865 | 176.6 |
| B | 12 | 111 | 18277 | 106.02 | 878 | 858 | 164.3 |
| B | 0 | 214 | 17195 | 99.43 | 878 | 858 | 164.3 |
| B | 11 | 111 | 15796 | 90.92 | 878 | 858 | 164.3 |
| C | 3 | 233 | 72967 | 374.44 | 848 | 853 | 192.6 |
| C | 14 | 234 | 7172 | 32.81 | 848 | 853 | 192.6 |
| C | 13 | 61 | 6153 | 27.52 | 848 | 853 | 192.6 |
| D | 13 | 249 | 2455433 | 12721.52 | 807 | 783 | 193.0 |
| D | 8 | 195 | 183993 | 949.51 | 807 | 783 | 193.0 |
| D | 2 | 136 | 47747 | 243.4 | 807 | 783 | 193.0 |
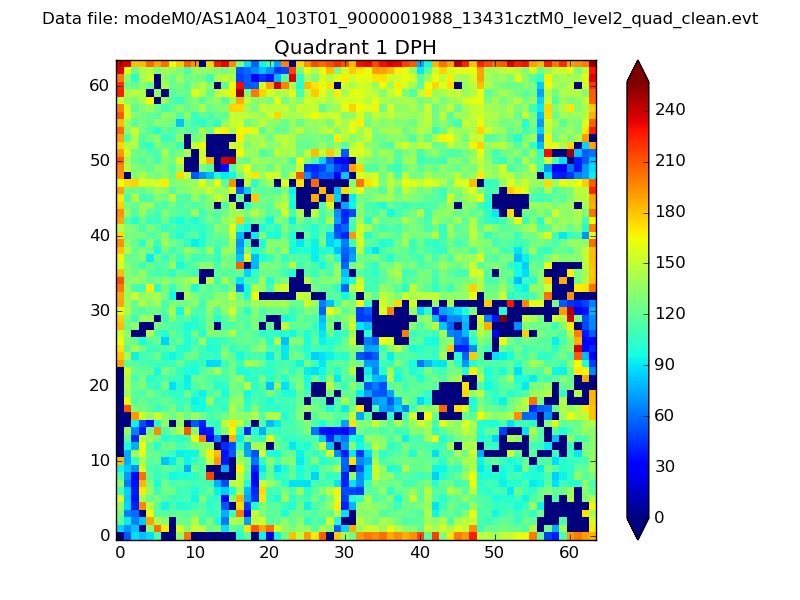
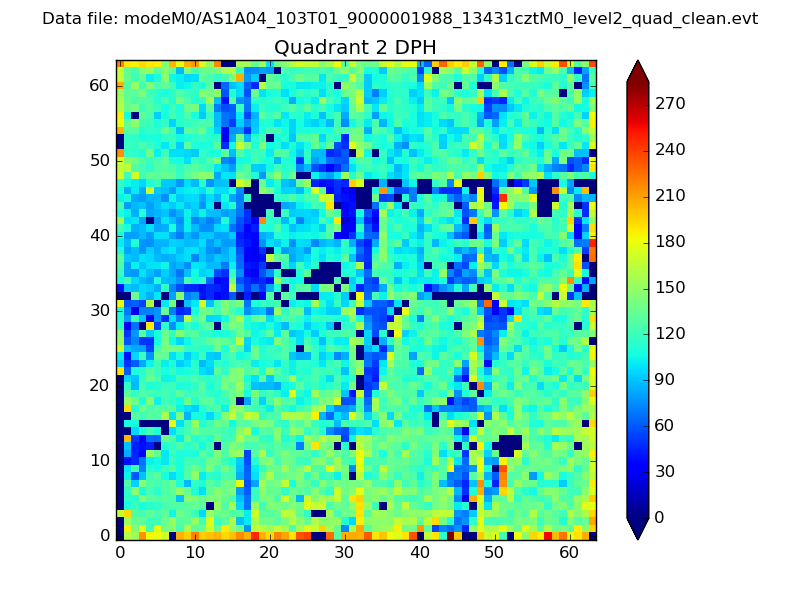
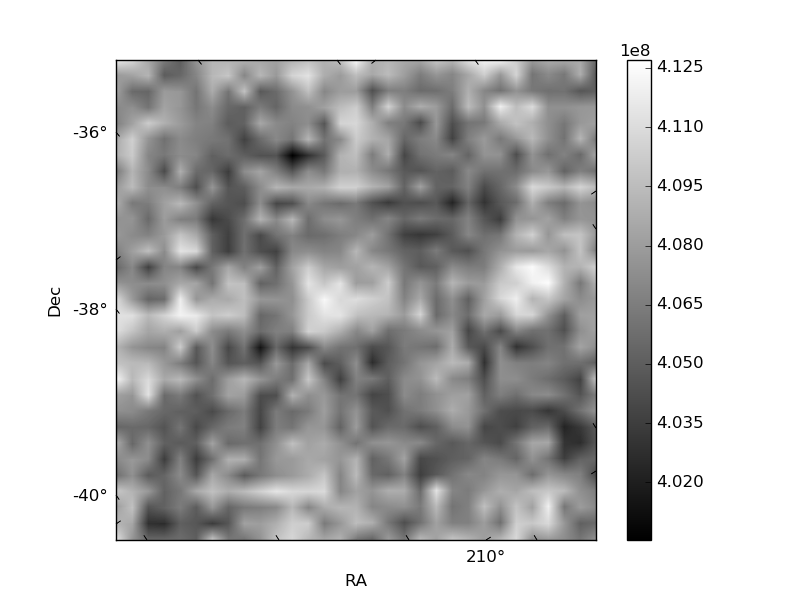
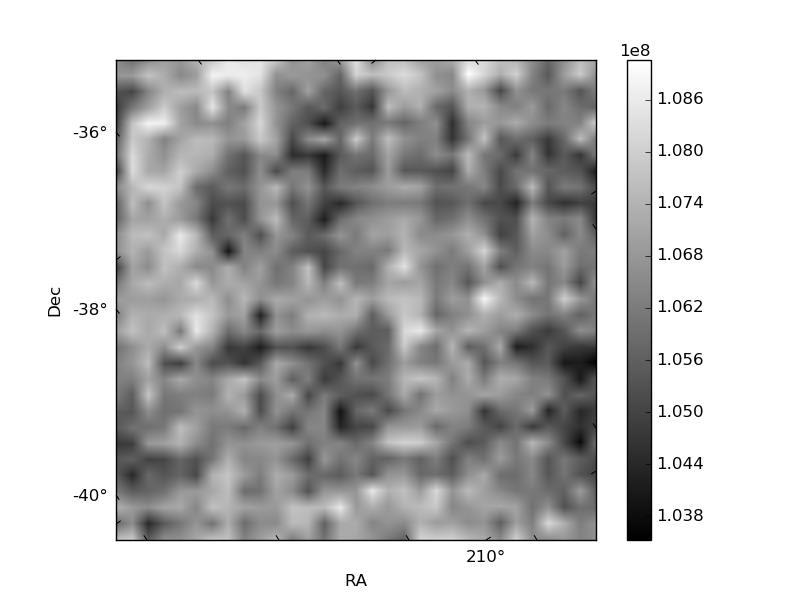
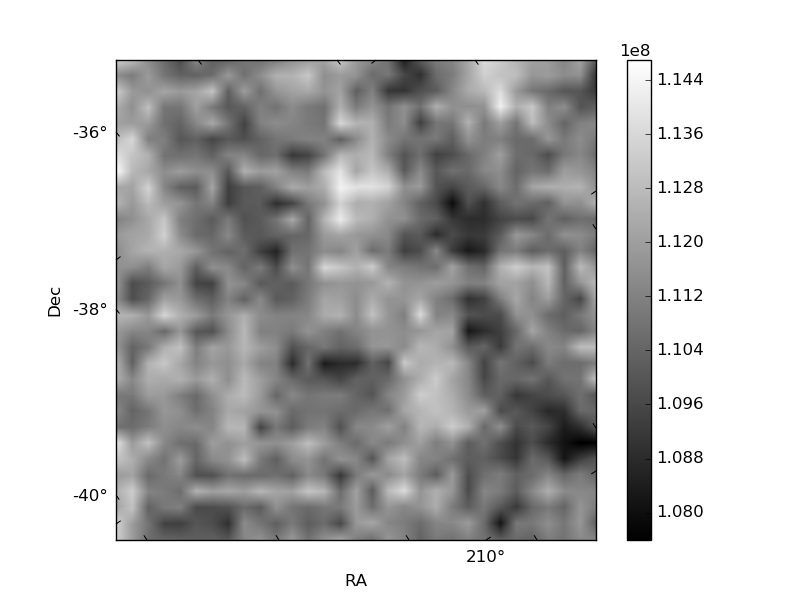
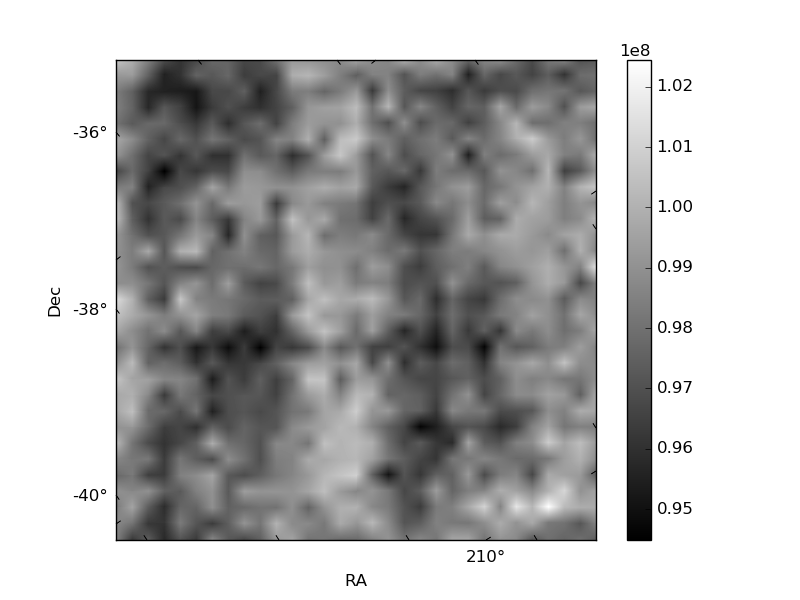
Histogram calculated using DETX and DETY for each event in the final _common_clean file
| Quadrant A | 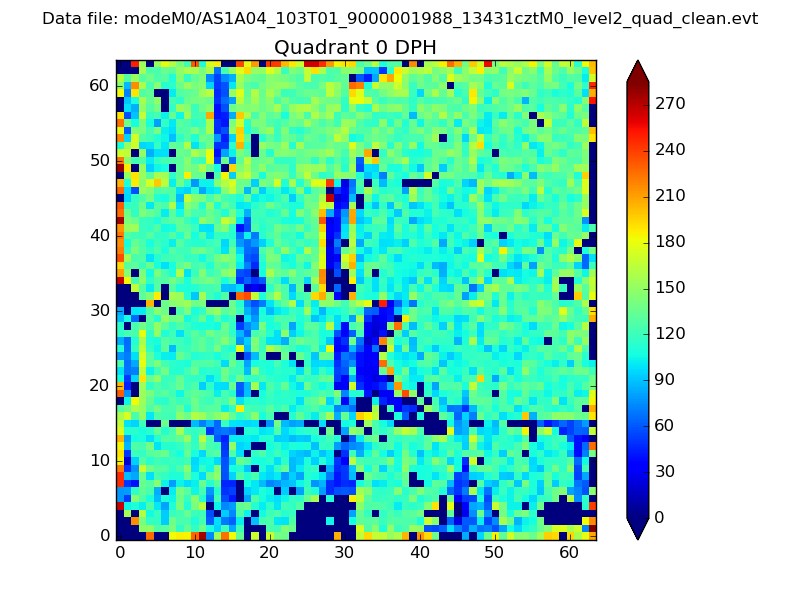 |
 |
Quadrant B |
|---|---|---|---|
| Quadrant D | 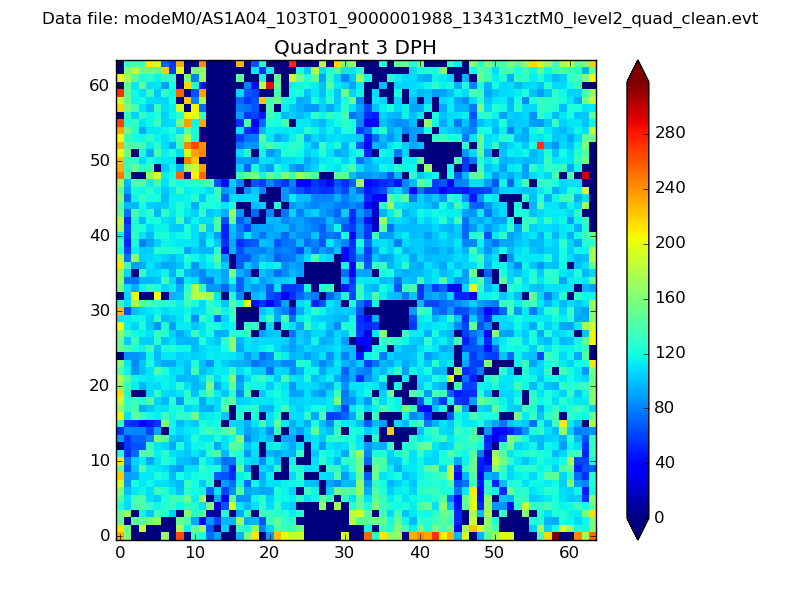 |
 |
Quadrant C |
| Plot type | Count rate plots | Images |
|---|---|---|
| Comparison with Poisson distribution Blue bars denote a histogram of data divided into 1 sec bins. Red curve is a Poisson curve with rate = median count rate of data. |
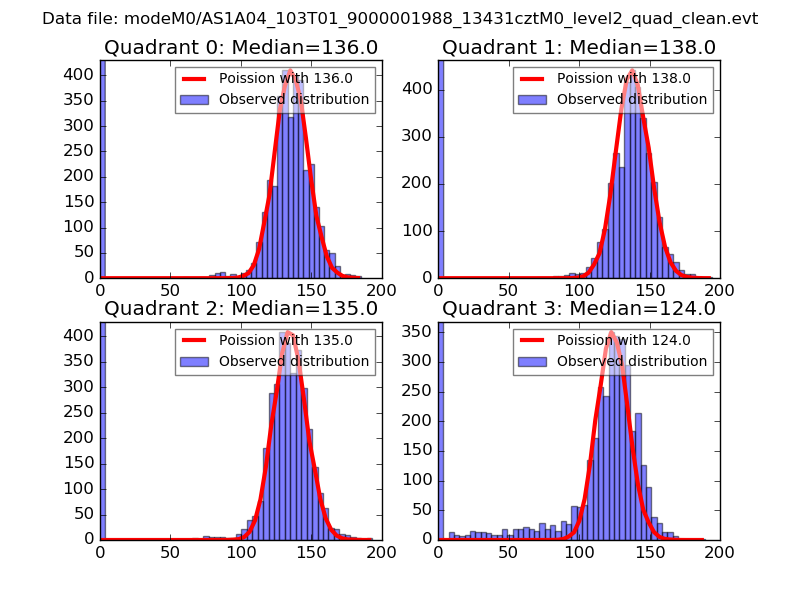 |
 |
| Quadrant-wise count rates Data is divided into 100 sec bins |
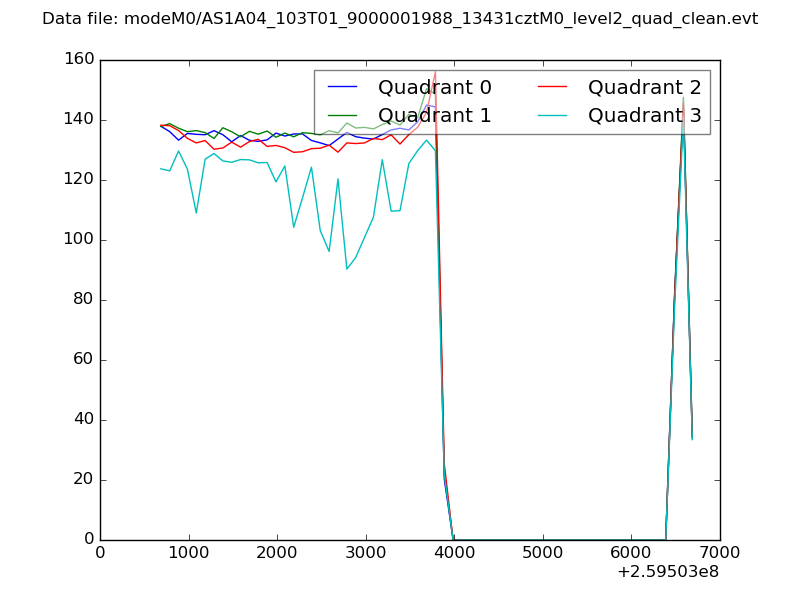 |
|
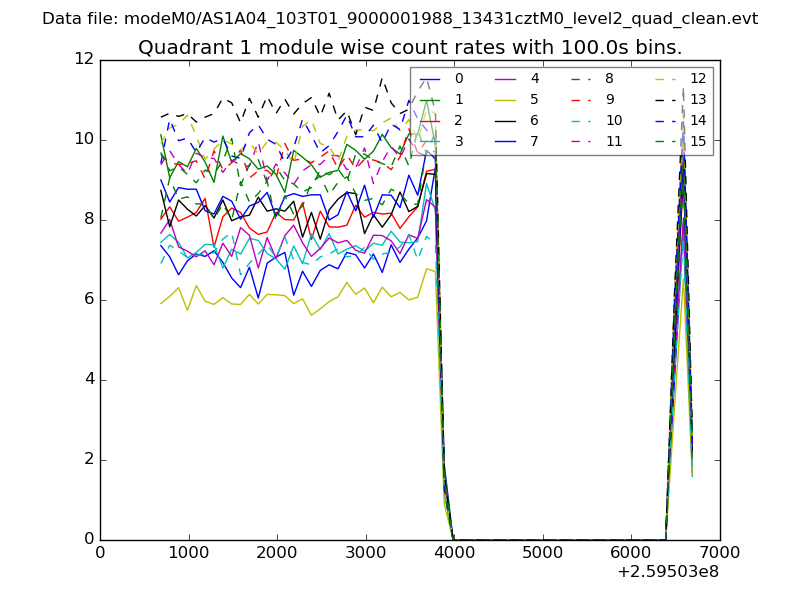
| Module-wise count rates for Quadrant A Data is divided into 100 sec bins |
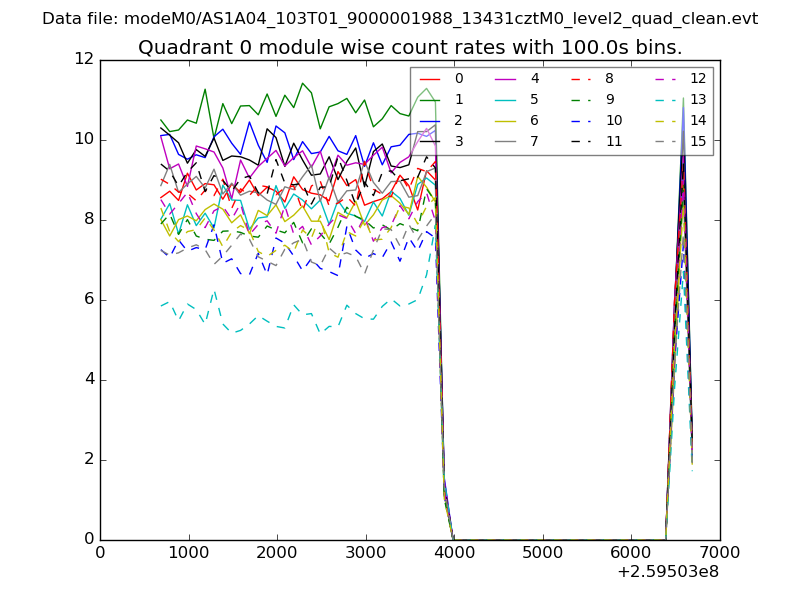 |
 |
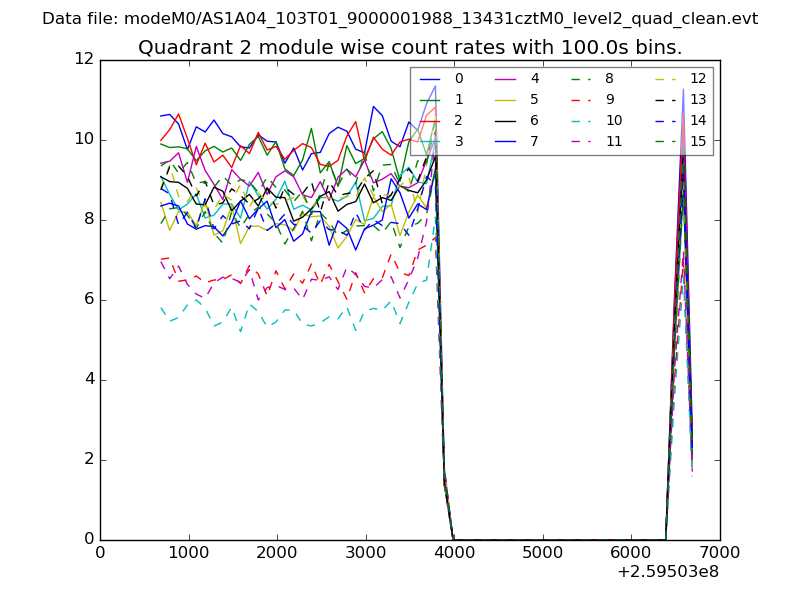
| Module-wise count rates for Quadrant B Data is divided into 100 sec bins |
 |
 |
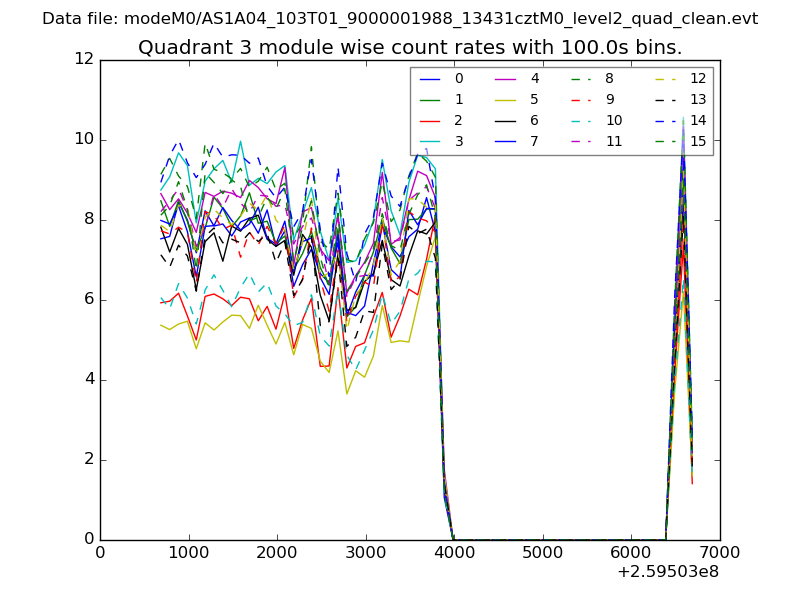
| Module-wise count rates for Quadrant C Data is divided into 100 sec bins |
 |
 |
| Module-wise count rates for Quadrant D Data is divided into 100 sec bins |
 |
 |
| Parameter | Plot |
|---|---|
| CZT HV Monitor | 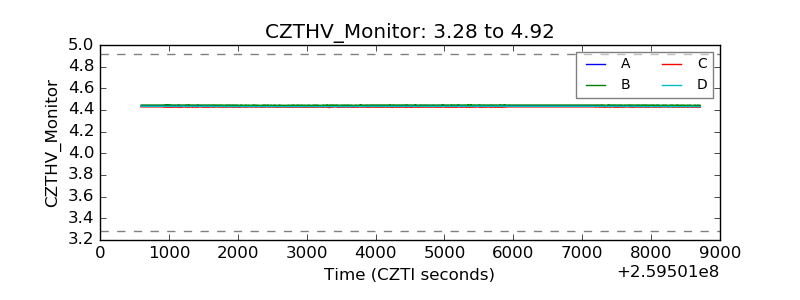 |
| D_VDD | 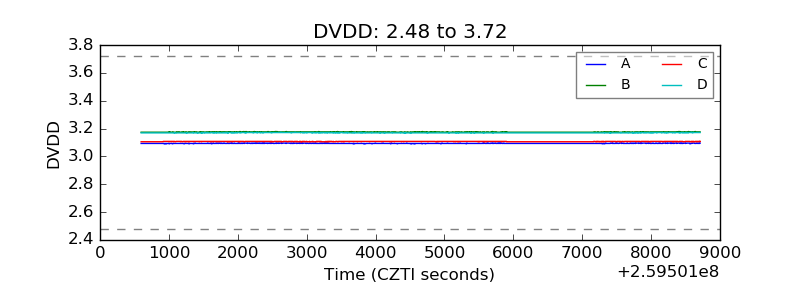 |
| Temperature 1 | 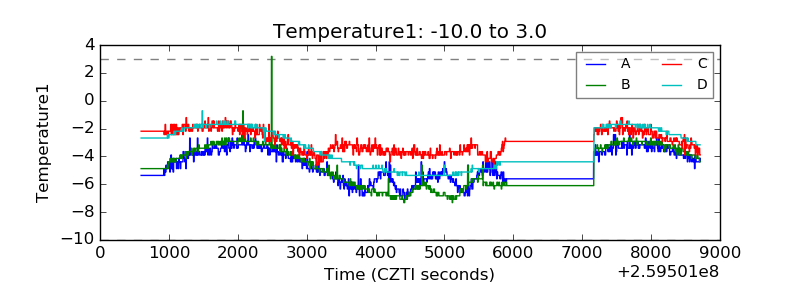 |
| Veto HV Monitor | 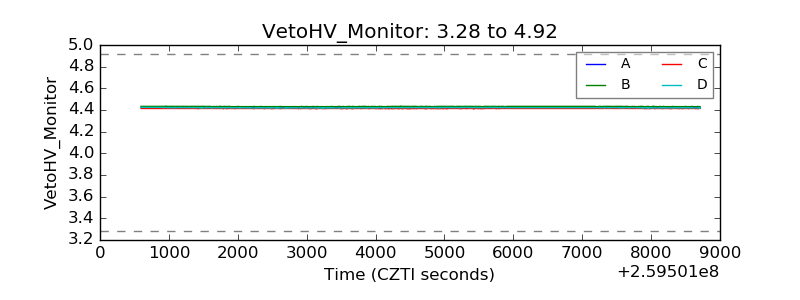 |
| Veto LLD | 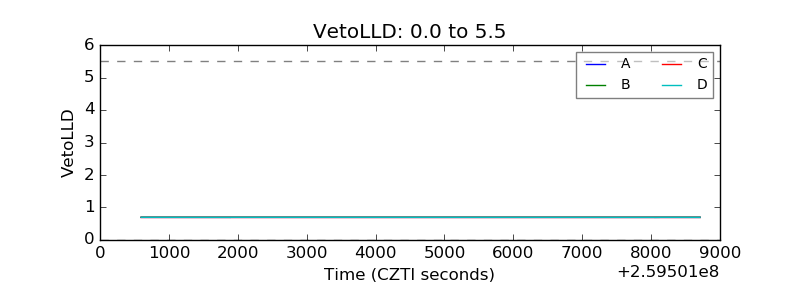 |
| Alpha Counter | 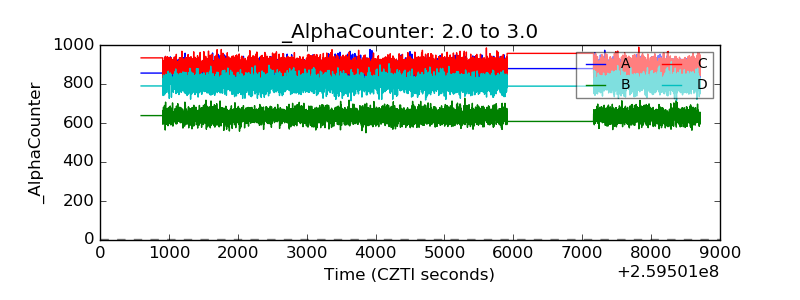 |
| _CPM_Rate |  |
| CZT Counter | 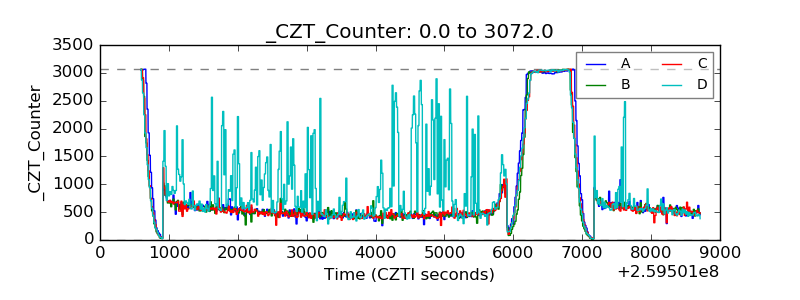 |
| +2.5 Volts monitor |  |
| +5 Volts monitor | 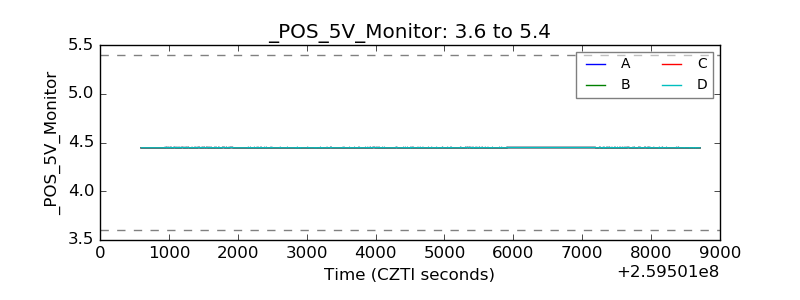 |
| _ROLL_ROT | 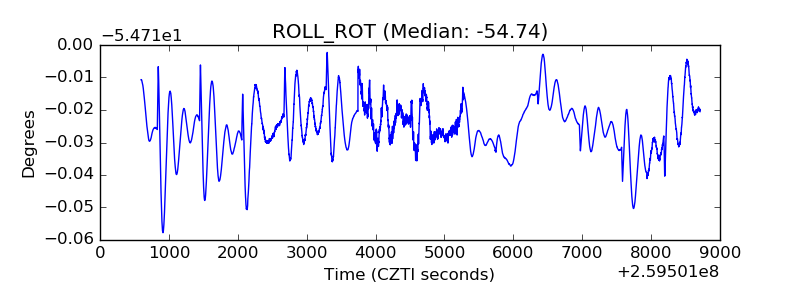 |
| _Roll_DEC | 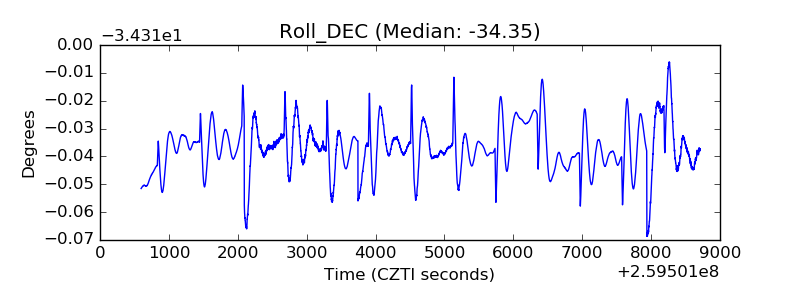 |
| _Roll_RA | 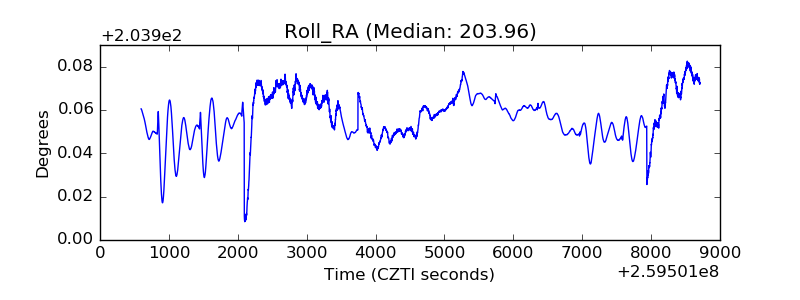 |
| Veto Counter | 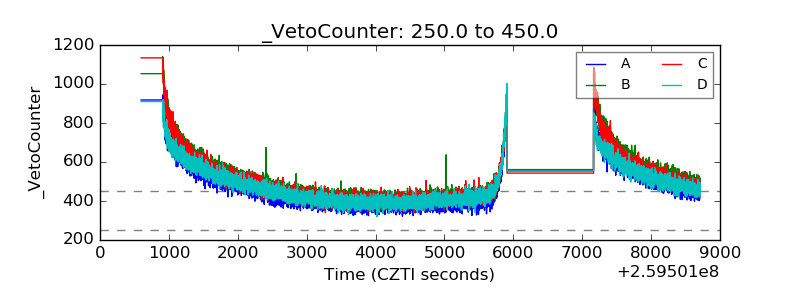 |